Open Journal of Soil Science
Vol.3 No.2(2013), Article ID:32828,11 pages DOI:10.4236/ojss.2013.32015
Soil Pedon Carbon and Nitrogen Data for Alaska: An Analysis and Update
![]()
1Agriculture and Forestry Experiment Station, University of Alaska Fairbanks, Palmer Research Center, Palmer, USA; 2USDANatural Resources Conservation Service, Palmer, USA.
Email: gjmichaelson@alaska.edu, cping@alaska.edu, mclark@mtaonline.net
Copyright © 2013 Gary J. Michaelson et al. This is an open access article distributed under the Creative Commons Attribution License, which permits unrestricted use, distribution, and reproduction in any medium, provided the original work is properly cited.
Received March 1st, 2013; revised April 2nd, 2013; accepted April 10th, 2013
Keywords: Soil Carbon; Soil Nitrogen; Arctic Soils; Pedotransfer Functions; Permafrost Soils
ABSTRACT
We combined C and N related pedon data from the USDA-NRCS National Cooperative Soil Survey Soil Characterization Database with data from the University of Alaska Fairbanks (UAF) northern soils research program, representing 58 and 30 years of field work, respectively. Carbon and N data from 117 UAF pedons were added to 541 pedons from the USDA-NRCS data set for a total of 658. Missing carbon (C), nitrogen (N) and related data were added to nearly all of the USDA-NRCS Arctic region pedons from unpublished UAF data. We present relationships among soil parameters of the data set that are necessary for calculation of pedon soil organic C and N stores. These new relationships are necessary for better estimating missing soil bulk density (Db) from measured soil organic C by high-temperature combustion (SOCHTC) and for conversion of acid chromate reduction soil organic carbon (SOCACR) to SOCHTC. For the USDA-NRCS data, missing Db data were estimated and SOCACR corrected to SOCHTC using the new functional relationships developed. This allowed for pedon SOC and N stores to be calculated for 609 and 468 Alaska pedons respectively, the most available to-date. Additionally, functional relationships were developed for data within soil orders to estimate total SOCHTC and N stores in pedons with missing surface organic horizons where only thicknesses were known. These relationships are presented in order to fill-in missing data and to better define the existing data set for future use. Some 1904 missing Db data points and 1612 corrected SOCHTC data points were added to the total of 4240 points in the 609 pedons that constitute the updated dataset. When O-layer thickness functions developed here were used, SOC and N stores were calculated for an additional 137 and 184 pedons respectively.
1. Introduction
Alaska has large areas of arctic tundra, boreal forest and temperate rainforest. It has been estimated that up to half of the total US soil C stores are in Alaska soils [1,2]. Recently there has been an increased utilization of soil C store data especially for northern latitudes data as more modeling efforts are undertaken to estimate soil C stores and access their vulnerabilities to warming of soil and thawing of permafrost [3,4]. The single most comprehensive and widely used original set of soil pedon C data for Alaska is in the USDA-NRCS National Cooperative Soil Survey Soil Characterization Database [5]. Up to May 2012 the Alaska data set contained 663 individual entries most of which most represent soil pedons collected from across Alaska starting in the 1950s.
These data will be increasingly relied upon for soil C storage assessment calculations for Alaska and in combination with other data to represent the circum-polar north [2,4,6-9]. However as is often pointed in past studies, the Alaska soil data set is not complete with regard to its equal coverage of regions or landscapes in Alaska and there is sparse sampling in general for the large and diverse landscape. Alaska data are also inconsistent with regard to methods used in carbon measurement and lack significant data measurements for soil bulk density [4,8]. These and other parameters necessary for C or N store assessment are incomplete for many pedons making it necessary to estimate or discard points when or if these inconsistencies are recognized [8]. As a result it is necessary for each researcher, whether they are producing regional models or gathering data for C storage assessments, to choose a subset of pedons and recalculate data in ways that are not always transparent or use pedotransfer functions from very different areas and soils to fill-in data [4]. This situation is compounded over the years as these data are selected recalculated or estimated and then data move in whole or in part from one data set to form part of another combined data set [7].
The USDA-NRCS Alaska soil pedon database is most substantial and was developed over many years and with various uses in mind but calculation of C or N stores was not likely one of the major uses envisioned for the data at least not until relatively recent times. Entries to the Alaska USDA-NRCS database began in the 1950s and continue to date. Sampling in the 1950 thru the 1970s began in the interior and south-central regions of Alaska, expanding to southeastern Alaska in the 1980s. In conjunction with the UAF Northern Latitude Soils program, sampling expanded to Arctic Alaska in the 1990s to present. Just over half (53%) of the sites in the Alaska USDA-NRCS data set were described, sampled and analyzed in the 1980s or earlier. During this earlier period (1950-1980), total organic carbon (SOC) was estimated using the acid chromate digestion method [10]. More recently (1980-present) the high temperature combustion method has been used and measures soil C directly as carbon dioxide-C released upon complete combustion of organic matter [10] with no soil-specific correction factors necessary. Field methods employed for collection and description of soils and site parameters also varied through time. For example during the 1950-1960s, data and soil descriptions were not always taken for surface organic soil horizons and the soil surface or “0 cm” mark for soil profiles was often taken at the surface of mineral soil just below the carbon and nitrogen rich surface organic layer. Permafrost layers found in Gelisols were not often sampled before the 1990s. As the Gelisols were more extensively sampled, methods for the description, sampling and laboratory analysis provided new challenges. For example highly cryoturbated horizons in Gelisol profiles (Turbels) are warped, broken and the horizon boundaries recorded can be radically different from the effective horizon thicknesses but accurate thickness is essential for calculation of soil C and N stores, so new descriptive techniques were needed [11- 13]. Other problems were encountered such as the failure of the USDA standard clod method [10] in frozen, wet and highly fibrous organic soil horizons resulting in many missing data points for Alaska soil profiles. Especially sparse were data for organic and permafrost horizon bulk densities (Db), thicknesses and SOC and N contents all of which are essential to calculating pedon C and N stores. These and other variations in the data can be easily overlooked and thus create sources of uncertainties and inconsistencies in using the database. Although each inconsistency needs to be recognized and dealt with on an individual pedon basis when calculating C and N stores they are not always easily recognized. No matter the individual user’s familiarity with cold-region soils, each user of the data must address these types of issues as they are able to recognize them in the data set.
In this work our objective is to combine UAF and USDA-NRCS data, update the dataset to provide a larger more robust, more transparent, consistent and defined pedon-based C and N data set for Alaska soils. We work to provide a more comprehensive data set that can be more easily added to and combined with other data sets in the future. We summarize the existing USDA-NRCS soil pedon C and N related data, augment it with missing parameters and with new pedons both of which were collected through the UAF Northern Soils program using similar methods but were not previously published or available with the more widely used USDA-NRCS data set. The resulting combined updated data set for Alaska is as complete as currently possible for calculation of soil pedon based C and N stores. We standardize and define data as to methodologies used including sampling depths and calculate results for different organic carbon analytical techniques, while filling-in data with pedotransfer functions derived from existing measured data that have comparable methods and soils, including the use of the new along with the existing pedon data. Our objective is to increase the quality and quantity of available whole soil pedon C and N data for the Alaska region so that it can be more easily and appropriately used and augmented as future data points become available in the circumpolar region.
2. Materials and Methods
2.1. Sources of Pedon Data
Two sources of pedon data were used to compile the updated data set, the USDA-National Cooperative Soil Survey website [5] for the Alaska region (accessed 5/2012) and selected unpublished data collected by the UAF Northern Latitudes Soils Program from 1991 through 2011. There were 663 individual data entries for pedons available from the Alaska region USDA-NRCS data set but only 541 pedons contained sufficient data as to be potentially useful for evaluation of pedon soil organic carbon (SOC) and nitrogen (N) stores. These 541 pedons were combined with 117 UAF pedons for a total of 658 for the Alaska updated data set (Figure 1 and Table 1). All UAF pedons were described and sampled using the USDA-NRCS methods [14] with some methods modified according to Ping et al. [13] for Gelisols with cryoturbation (Turbels) or frozen layers. The updated data set [15] contains selected C and N related soil parameters and methods are noted to include soil location, classification, horizon designations and horizon boundary depths (cm), 100˚C oven-dried bulk density, sample
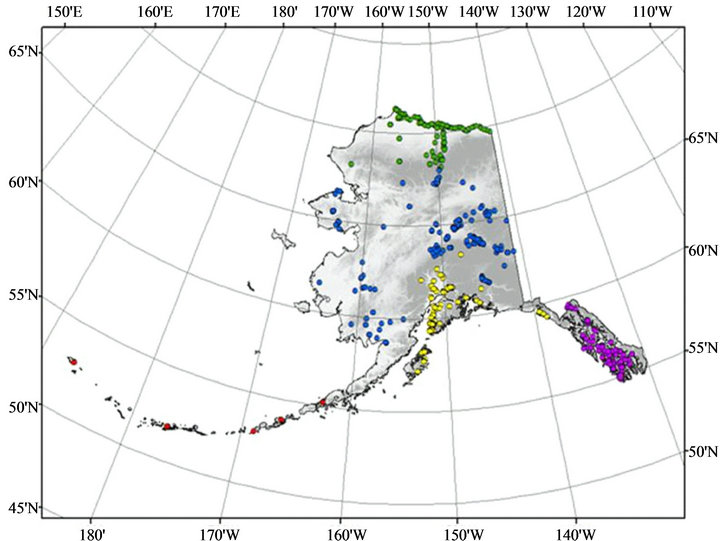
Figure 1. General location of sampling sites for the pedons in the combined updated Alaska data set [15]. Sites are grouped for general geographic area, by color (Green-Arctic, blue-Interior/Western, Red-Aleutians, Yellow-Southcentral, and Magenta-Southeast Alaska).
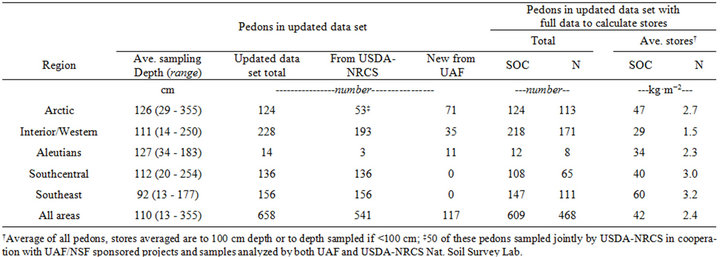
Table 1. Properties of the combined USDA-NRCS and UAF updated soil organic carbon (SOC) and nitrogen (N) data set for Alaska.
coarse fragments volumetric percentage >2 mm, organic carbon by acid chromate reduction (SOCACR), and C and N percentage by high temperature combustion (SOCHTC) [10].
2.2. Augmentation of USDA-NRCS Data
The Arctic region of Alaska is the most recently sampled with the earliest USDA-NRCS pedon data being from 1991 and continuing with UAF data up to 2011. Most Arctic region pedons were sampled and described jointly with the UAF Northern Soils program and thus parallel sampling of soil profiles was performed for 50 of the 53 USDA-NRCS Arctic region pedons (Table 1). For 28 of these 53 Arctic pedons new SOC, N and Db data were added into the updated data set from unpublished UAF data. The UAF data added are from parallel samples that were collected at the same time as the USDA-NCSS samples and analyzed by the UAF Plant and Soils Laboratory at the Palmer Research Center. Bulk density data added to USDA-NRCS pedons were determined by either soil volumetric core or measured-dimension cut block methods, both included massive or vein ice where present in frozen horizons [13,16]. Only 34 out of 899 horizons in the Arctic USDA-NRCS data required Db estimates to be made using SOCHTC measured (Table 2). These missing Arctic Db data added in from UAF data were largely for the organic surface and permafrost (ice rich) soil horizons where the USDA-NRCS clod method failed to be appropriate for field conditions [13] and cut block or core samples were collected and Db measured by UAF.
In addition to the UAF Db, SOCHTC and N data added in, the actual horizon thicknesses were added in for cryoturbated pedons mostly Turbels but also for Orthels and Histels with significant warping of horizons. These horizon thickness values in the USDA-NRCS data were either missing or their data entries represented the depthrange for horizon occurrences rather than actual relative thicknesses for horizons [11,13,16]. These horizon thicknesses were calculated using UAF data files based on field note to-scale sketches calibrated with pit photos of the pedons [13]. Thicknesses were added to 300 horizons in 49 of the 53 arctic sites.
2.3. Fill-In Data for Missing USDA-NRCS Points
While all UAF pedons and horizons were complete for data necessary to calculated pedon stores of SOC and N, there were 306, 478 and 137/64 USDA-NRCS pedons that required parameter estimations for either SOCHTC, Db and organic layer SOC/N stores respectively, out of the 541 total pedons or up to 88% of all USDA-NRCS pedons required some fill-in data (Table 2).
Estimation of Soil Organic Carbon by High Temperature Cumbustion (SOCHTC). Until the 1990s the USDANRCS laboratory reported SOC by the acid chromate reduction (SOCACR) method exclusively. During the 1990s through the early 2000s both SOCACR and SOCHTC were reported for Alaska pedon samples resulting in a set of 434 soil horizons with both SOCACR and SOCHTC data points including horizons from 6 soil orders occurring across Alaska [15]. Best fit simple regression equations were developed using these data for horizons grouped by soil order (Table 3). There were 306 pedons from the USDA-NRCS data set (57%) containing a total of 1612 soil horizons (50%) where the SOCACR method was used exclusively and data required estimation of SOCHTC employing these equations. The SOCACR method over-estimated organic carbon compared to the more direct high-temperature combustion method. Estimated SOCHTC values averaged only 82% - 96% of the SOCACR values within the 6 soil orders with an average over all soil orders of 89% (Table 3).
Estimation of Soil Bulk Density (Db). All the UAF data points added to the updated data set contained measured values for all C-related parameters so estimates were only required for the USDA-NRCS data. Soil Db values were missing and needed estimation in 88% of the USDA-NRCS pedons including 45% of all soil horizon data points. Soil Db were estimated from SOCHTC values for soil horizons within each of the six soil orders using a total of 1846 soil horizon data points. The best-fit log relationships used to estimate Db from SOCHTC varied in strength from R2 = 0.524 for Gelisols and R2 = 0.546 in Spodosols to R2 = 0.683, 0.730, 0.757 and 0.903 for the Inceptisols, Entisols, Andisols, and Histosols respecttively (Table 4).

Table 2. The numbers of pedons and individual soil horizons in the combined updated data set where estimates were necessary and possible to complete site pedon data.
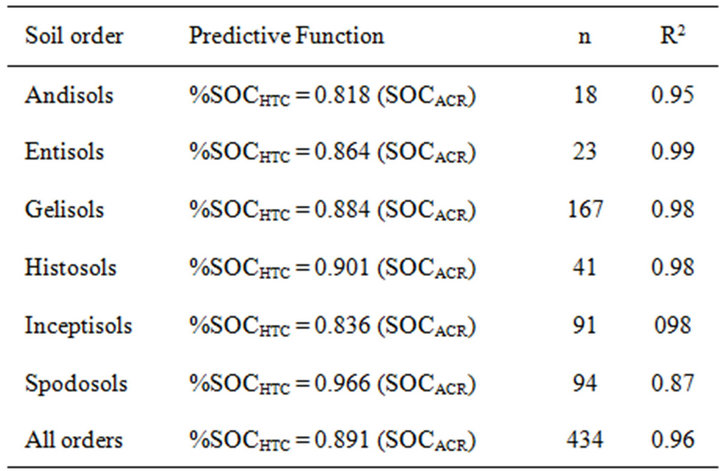
Table 3. Simple linear relationships for %SOCHTC by hightemperature combustion as a function of %OC by acid chromate reduction (SOCACR) among soils from the various orders that occur in Alaska.

Table 4. Predictive log relationships for soil oven-dried bulk-density (Db) as a function of total organic carbon by high temperature combustion method (SOCHTC).

Table 5. Average total organic carbon (SOCHTC) and total nitrogen (N) densities of the O-horizon layer taken as a whole to mineral soil (weighted-by-thickness average of all surface O-horizons for each pedon) and stores of SOCHTC and N in that horizon as a function of horizon thicknesses.
Other USDA-NRCS Data Estimated or Corrected. Location data were corrected for some 14 USDA-NRCS pedons from throughout the various regions of Alaska. Horizon depths were recalculated for 217 pedons (40%) where the mineral soil surface was used as zero instead of the upper boundary of surface O-horizons. Some 48 of the 541 USDA-NRCS pedons (9%) had useful data and general location and soil series information even though their more exact latitude and longitude coordinates were not available [15].
Total field-soil volumetric rock fragments >2 mm (TRv%) were estimated by adding the volumetric laboratory rock fraction percentage (LRv%) to the field estimates of large-rock fraction volumetric percentage (FRv%) or: TRv% = LRv% + FRv%. The field estimates for the large-rock volumetric percentage were for the cobbles, stones, boulders, channers, and flagstones [14] reported in the soil horizon field descriptions. The LRv% was calculated using the laboratory measured weight percentage >2 mm fraction (LRwt > 2 mm%), an estimated particle density assumed to be 2.65 g·cm−3 for >2 mm particles and the measured <2 mm soil bulk density (Dbsoil in g·cm−3) using the equation:
 (1)
(1)
The average particle density of minerals was taken to be 2.65 g·cm−3 and no calculations were necessary for Andisols that could contain on average significantly less dense pyroclastic mineral densities.
2.4. Calculation of Pedon SOC and N Stores
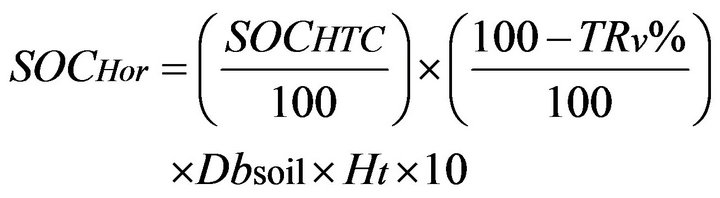
Soil profile stores of SOC and total N (kg·m−2) were calculated to 1 m or to pedon sampling depth if <1 meter, by summing horizon stores (SOCHor in Equation (2)) to depth. Profile total N stores were done in the same way using %N in place of %SOCHTC.
 (2)
(2)
where SOCHTC is percent organic carbon either measured by high-temperature combustion or estimated from relationships given in Table 3, Dbsoil is individual soil horizon bulk density in g·cm−3 measured or estimated from total SOCHTC by equations given in Table 4, Ht is the horizon thickness (cm) and TRv% is estimated volumetric rock fragment content percentage as calculated above.
2.5. SOC and N Store Estimates for Missing Surface O-Horizons
There were a total of 576 organic horizons with SOC and 535 with N data in the combined updated data set. The USDA-NRCS data set had 137 pedons that included 235 horizons where there was no analysis of surface organic horizons. But, of these 137 pedons there were 136 that had at least thickness observations. For pedons with complete analytical data on the whole surface organic layer, average total SOCHTC and N densities (kg·m−2·cm−1) were calculated for pedons within each soil order. These were thickness-weighted average stores for all surface O-horizons (Table 5). These O-layer stores were calculated by summing the stores of all contiguous organic surface horizons using Equation 2 and dividing by the total thickness (cm) of the O-horizons that made up the contiguous surface O-layer. Using these pedons within each soil order, best-fit simple linear regression equations were developed for soil organic carbon (SOC) and nitrogen (N) stores of the whole surface organic layer, each as a function of organic layer thickness (Table 5).
3. Results and Discussion
3.1. Data Augmentations
Soil Horizon SOC Estimates. It is well known that differences exist between results for SOC determined by the direct modern high temperature combustion method and those results obtained by older indirect methods. The commonly used indirect methods are the acid chromate reduction (or variations of this method) and the conversion of weight loss on ignition to SOC [10]. These two indirect methods rely on derived conversion factors that account either for the efficiency of chemical reduction (chromate reduction methods) or the carbon content of soil organic matter lost upon ignition. Neither of these factors remains constant across soils, soil horizon types within profiles or across soils from different physiographic regions. With these inherit variations come inaccuracies using these indirect methods across soils. When pedon stores are calculated, SOC values obtained using these indirect methods are often adjusted so that they approximate values that would be expected if high temperature combustion had been used [8,17]. But sometimes no adjustments are made and data are just taken along with SOC values by high-temperature combustion [2,4,7,17]. There were very good relationships within the USDA-NRCS data set for predicting values for SOC by high-temperature combustion (SOCHTC) using SOC acid chromate reduction (SOCACR) values (Table 3). Predicted SOCHTC was relatively good for data taken both within soil orders (R2 = 0.87 to 0.99) and across all orders (R2 = 0.96). In a recent study of SOC stores of Alaska a similarly good (R2 = 0.98) overall relationship was derived using some of the same data points from the USDA-NRCS data set combined with other research soil samples [8]. However, splitting SOC analytical data into groups by soil orders as done here (Table 3) indicates somewhat different predictive relationships exist for data across orders with the highest variability for predicting SOCHTC from SOCACR in Spodosols (R2 = 0.87, Table 3). When dividing the data for organic and mineral horizons within the Spodosols, weaker relationships were found among the O-horizons (20% - 62% SOC: R2 = 0.232, n = 16) than for mineral horizons (0% - 20% SOC: R2 = 0.973, n = 78). Examining plots of data for other orders indicates a similar trend of higher variability in predicting SOCHTC from SOCACR for the organic horizons compared to the mineral horizons (data not shown) but not as pronounced a difference as found for Spodosols. In general our analysis indicates that an over-all soils equation could be used for estimating SOCHTC from SOCACR with relatively little loss in confidence, keeping in mind the Spodosol organic horizons will be most variable.
Horizon Bulk Density Estimates. As found for other data sets, the USDA-NRCS Alaska soil pedon data set is lacking soil bulk density (Db) for a very significant number of pedons (88%) and horizons (45%). As a consequence, to utilize large amounts of this data, Db must be estimated usually from SOC in order for more pedon data to be useful for storage calculations. In previous studies where the USDA-NRCS Alaska pedon data set has been used missing Db has been handled different ways. Tarnocai et al. [7] used only data from permafrost regions (131 pedons) with measured Db. Bliss and Maursetter [2] calculated average Db for whole soil pedons within soil classification units and used averages to predict similar pedons with missing data. Johnson et al. [8] used data filling equations predicting Db from SOC, equations developed from a combination of pedon data and soils data from other Alaska research sites and for mineral soils, grouping by mineral soil horizon types (R2 = 0.48 - 0.59), and for arctic soils grouping all mineral or organic soils together (R2 = 0.60). Mishra and Riley [4] used the USDA-NRCS Alaska pedon data and estimated Db using equations developed for cultivated and forested Podzolic (Spodosols) soils of Ohio assuming similarity. The Northern Circumpolar Soil Organic Carbon Database (NCSCD) has missing Db data filled in from a variety of methods such as developing relationships for SOC and Db using various regional soils, transferring similar horizon data from pedon to pedon and the use of overall average mineral and organic horizon Db values [17]. The larger NCSCD contains only the 131 USDA-NRCS pedons all with measured Db contributed from the Tarnocai et al. study [7].
We developed best-fit simple linear regression relationships between Db and SOCHTC within the combined Alaska USDA-NRCS and UAF data set. Generally, there were strong relationships for predicting Db from SOCHTC within soil orders (Table 4). The R2 values were strong (R2 = 0.68 - 0.90) within all soil orders except the Gelisols (R2 = 0.52) and the Spodosols (R2 = 0.55). The weaker relationship for Gelisols was mainly due to the lack of a strong relationship within the permafrost horizons (R2 = 0.46). When only considering data from the active layer horizons relationship strength was similar to other soil orders (R2 = 0.71). This can be directly attributed to the presence of a wide range of, and often very high amounts of segregated ice in the bulk density samples taken from frozen samples [18,19] and this was noted by Johnson et al. [8] who found a R2 = 0.48 for frozen soil horizons in their analysis of data that included some data from the USDA-NRCS and UAF data sets. This problem for prediction of permafrost Db is not as serious as it seems for Alaska as most all pedons are measured (only 4 out of 124 pedons lack Db for permafrost horizons), but it does reflect the high field variability for C and ice content of permafrost [20,21]. The weaker Db predicting relationship found for Spodosols was general throughout the entire range of SOC, but when using only horizons with 12% - 65% SOC the relationship was very weak (R2 = 0.12). In contrast to Gelisols, the poor Db prediction in the Spodosols will likely affect the confidence in calculated SOC stores for the Southeast Alaska area as there were Db missing for horizons in all but 3 of the 147 pedons of that area most of which are Spodosols.
Estimated SOC for Missing O-horizons. All 117 UAF pedons in the combined data set were complete for direct calculation of SOC and N stores. Out of the 541 USDANRCS pedons in the combined data set, 25% (137) and 34% (184) lacked surface organic layer SOC and N data respectively, therefore direct calculation of pedon stores was not possible unless stores could be estimated for these surface O-layers (Tables 1 and 2). Almost all of these missing C/N data O-layers had thickness data and even some descriptive information was available for horizons just no Db or SOC and N analysis were available. Two SOC studies for Alaska soils utilized the USDANRCS data set [2,4] but used fewer pedons (from 422 to 479) and did not estimate O-horizon SOC for pedons lacking analytical data. A third study [8] estimated SOC from average densities calculated for O-horizon types (Oi, Oe, Oa, and O-only designation) and averaged across all Alaska. The overall average densities of O-horizon types were then applied to pedons with missing SOC data, using horizon thicknesses to estimate O-horizon stores. The relationships they found for SOC stores as a function of horizon thickness within O-horizon types were relatively weak and R2-values ranged from 0.38 - 0.63. Estimates for missing O-horizon SOC of European and Russian Arctic soils, were filled in to the Northern Circumpolar Soil Carbon Database using estimates based on O-horizon SOC as a function of total thicknesses developed from 14 pedons across different soils (R2 = 0.63) [17].
Table 5 contains our estimates for average SOC and TN densities in the whole surface O-layers (weighted-bythickness average of all surface O-horizons for each pedon) in the USDA-NRCS-UAF combined updated data set, along with the SOC and N stores as a function of O-layer thicknesss within each soil order. The R2-values for O-layer SOC stores within soil orders, as a function of thicknesses ranged from 0.57 - 0.93, generally higher than found by others for horizon types across all soils [8,17] discussed above. The higher R2 for pedons grouped by soil orders indicates that confidence in these estimates can be improved using orders compared to those derived using all pedons grouped together. The R2-values for N stores as a function of thickness within soil orders varied more than SOC, ranging from <0.01 for Andisols to 0.89 for Histosols (Table 5). Soil C and N densities and relationships within soil orders were derived from a total of 420 pedons all of which had complete measured SOC data and 390 with complete N data, with the number of pedons per soil order varying from 14 in the Entisols to 145 in the Gelisols. Average SOC densities for the surface O-horizons within orders, were highest for the Spodosols and Histosols at 2.41 ± 0.54 and 1.73 ± 0.25 kgSOC·m−2·cm−1, respectively followed by Entisols, Inceptisols, Gelisols and Andisols at 1.31 ± 0.41, 1.26 ± 0.51, 1.01 ± 0.44, and 0.460 ± 0.21 kgSOC m−2·cm−1, respectively. The N densities followed a similar pattern with highest TN densities in the Spodosols and Histosols at 0.082 ± 0.029 and 0.060 ± 0.017 kgN m−2·cm−1, respectively followed by Entisols, Inceptisols, Gelisols and Andisols at 0.062 ± 0.024, 0.052 ± 0.028, 0.046 ± 0.028, and 0.019 ± 0.019 kgN·m−2·cm−1, respecttively. The best relationships for O-layer SOC as a function of total thickness were for the Histosols, Spodosols and Entisols with regression coefficients of R2 = 0.93, 0.86 and 0.85, respectively followed by the Inceptisols, Gelisols and Andisols with R2 = 0.69, 0.66 and 0.57, respectively. The N stores of surface organic horizons were predicted by the thickness with the lowest variability for the Histosols and Entisols R2 = 0.89 and 0.79, respecttively and with intermediate variability within the Spodosols, Gelisols and Inceptisols, R2 = 0.56, 0.44, and 0.43, respectively. The Andisols had no significant relationship for N stores and surface O-horizon thickness with and R2 < 0.01.
3.2. The Updated Alaska Pedon Data Set
Pedons. The addition of UAF pedons and the estimation of missing data points in the USDA-NRCS data set have increased the number of complete-data Alaska pedons from 492 to 609 or about a 24% increase. Pedons with complete N stores data have increased 33% from 351 to 468 in the combined updated data set. Although there are few studies utilizing Alaska pedon N [9], the USDANRCS Alaska data set has been used in a number of published SOC assessments. In 2000 Jobbagy and Jackson [22] summarized SOC depth distribution world-wide utilizing some Alaska data. At that time only about 340 pedons some with incomplete points were available for SOC calculation. In 2010 Bliss and Maursetter [2] estimated SOC stores for Alaska using 479 sites including 2538 records (soil horizons) from the USDA-NRCS Alaska data set. The updated Alaska pedon data set [15] adds an additional 130 sites with an additional 1702 records within the data set. In 2009 Tarnocai et al. [7] studied soil SOC stores of the circum-polar region and used data points from 131 Alaska pedons to represent the permafrost regions of Alaska (Interior/Western and Arctic). The combined updated data set provides an additional 71 Arctic and 35 Interior/Western Alaska pedons not available in 2009 (Table 1). The data available through the Tarnocai et al. study [7] were the data (131 pedons) migrated to the current Northern Circumpolar Arctic Database [17]. Also, additional missing data for Db ( in 182 pedons) and corrected SOC data (SOCACR to SOCHTC—in 64 pedons) have been added for the permafrost regions of Interior and Western Alaska, data not available in the 2009 Tarnocai et al. [7] data set.
In 2011, Johnson et al. [8] estimated Alaska SOC stores. Taking data-filling measures discussed above, they used 554 Alaska data sites including both sites from various academic plot studies and an unspecified number of pedons from the USDA-NRCS data set. The study by Johnson et al. [8] illustrates the difficulty in obtaining data from as many sources as possible across an area as large as Alaska and attempting to standardize the data assembled from the different sources. Their study made a very good effort in this regard and data estimating relationships were given even if the actual data used in developing these could be difficult to reassemble. Most recently Mishra and Riley [4] using fill-in data procedures discussed above, estimated Alaska soil SOC stores using only 422 pedons from the USDA-NRCS data set combined with 50 from the UAF data set. Our combined updated data set [15] contains all of the USDA-NRCS pedons used by Johnson et al. [8] and Mishra and Riley [4] along with additional UAF pedons a total of 609 complete pedons for SOC. The updated combined data set increases pedons in the arctic region by 133%, Interior/Western by 18% and the number of pedons available in the Aleutian area increase from 3 to 14 (Table 1). Although no new UAF pedons were added for the Southcentral and Southeastern regions data filling were required on a overwhelming majority of pedons: 85% and 79% of pedons required SOCHTC estimation for the regions respectively and 95% and 97% of pedons respecttively required Db estimation. The O-layer SOC estimates (from total O-horizon thicknesses) were required for 48% and 31% of pedons from the two southern regions respectively (Tables 1 and 2).
Soil N stores for northern soils will become of increasing interest especially in conjunction with studies of soil C dynamics at various scales including globally [23], at landscape levels [24], and at the micro-topographic level [25]. Harden et al. [9] provides some general estimates of N stores in Gelisols and in light of the importance of C-dynamics to future assessments, the need for complete soil N data seems likely to increase. Although the updated data set provides fewer pedons with N data than it does for SOC there are a substantial number (468) of complete pedons (Table 1). As might be expected the variability for estimation of soil N within soil O-horizons is higher than found for SOC and thus estimates for missing data generally should be taken with much less confidence.
Sampling Depths. The updated combined data set is strong in providing pedon SOC and N contents in the near-surface (generally 1 - 2 m) soil profile. Recently however with concern about warming permafrost and increased thermokarst development [3], there is a new interest in “deep carbon stores” and the stores of permafrost-encased deep yedoma deposits (up to 50 m thick) [26]. These data needs are from depths largely below those for standard soil sampling that are detailed in this data set (Figure 2). Various SOC-storage studies to date [2,4,7,8,16,22] have used standard or unified sampling depths or a set of standard summary depths for statistical comparisons or modeling purposes. Sampling to standard depths is not always possible because of the geographic site settings or technical and fieldlimitations. The SOC and N densities (kg−2·cm−1) in our data set [15] taken along with horizon thicknesses allows for recalculation of storage to any depth within the sampling range. Figure 2 presents the general regional distribution and variability of sampling depths for the 658 pedons of the combined updated data set. In the mountainous and alpine regions, soils formed on summits and shoulder slopes are generally shallow, <1 m to bedrock or paralithic contact. For deglaciated uplands, the zone that is affected by pedogenesis is generally <2 m in southcentral Alaska [27] and <1 m in interior Alaska uplands due to weak soil development and limited leaching [28]. For Gelisols formed on glacial moraines of the Arctic Foothills of the north slope of Alaska, biogenic carbon accumulation is generally controlled by cryoturbation in combination with syngenetic permafrost formation and the depth of pedogenesis is usually <1.5 m on the hilly tundra [20] but may reaches 2 m on exposed ridgetops. Generally except for yedoma, deep carbon (>2 m) is limited to lowlands, such as peat accumulations in the valley bottoms of the Arctic Foothills, or broad shallow basins and plains of southcentral and interior Alaska [28]. On the arctic coastal plain, carbon is deposited by repeated burial process due to sediments buildup, thaw lake cycles and paludification due to the wet and cold environments [20,29]. In all of these regions, there has been little sampling to the deeper depths [13]. Limited data from deeper (>3 m) coring projects and from work on exposed bluffs have been used in conjunction with surface geology assessment to project deeper C-stores over broad areas [7,9,30]. Large areas of both arctic and interior Alaska have been identified as potentially having deep yedoma deposits [26]. Available circum-polar SOC and N store data for permafrost soils including Alaska pedons available are summarized by Harden et al., [9].
4. Conclusions
The new updated Soil C and N data set for Alaska presented here, combines 58 years (1952-2010) of data generated by the National Cooperative Soil Survey program in Alaska led by USDA-NRCS, with 30 years (1982- 2011) of data from the UAF Northern Latitude Soils Program. With the combination, examination and analysis of these pedons, we have identified important data set characteristics along with providing a consistent and im-
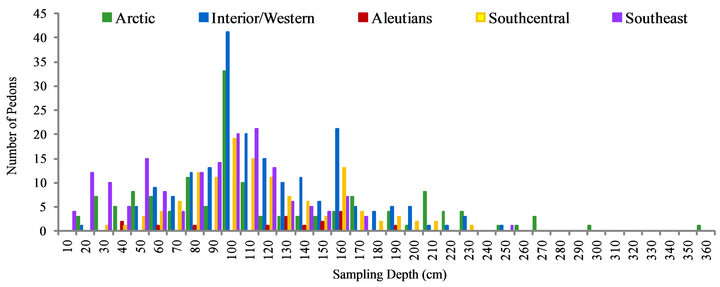
Figure 2. Distribution of soil sampling depths for pedons of the combined updated Alaska data set for the general geographic areas.
proved means of estimating missing data. We added data for permafrost-affected soils that are necessary for accurate C store calculations in the cryoturbated and ice rich Gelisols and increased the number of arctic region pedons significantly (by 134%). Arctic data were added in the form of augmentations to all but 2 of the existing USDA-NRCS pedons. New relationships were developed for estimating missing soil Db from SOCHTC, for correcting SOCACR to reflect soil levels of SOCHTC, and for estimating SOC and N stores in pedons with missing organic surface horizons. The new relationships provide improved predictability for missing parameters as well as point to the weaknesses for some soil groups. The newly updated combined Alaska data set will make for more easy use of and better data definition in future regional and global evaluations of near-surface soil SOC and N stores. This data set is the most complete, and defined pedon data set to-date for Alaska. The SOCHTC and N estimating equations that are presented for filling in missing data make available an additional 137 and 184 pedons respectively in the USDA-NRCS data. The total combined updated data set provides a complete to-date detailed and defined set of Alaska pedon SOC and N data for 609 and 468 pedons respectively. The update and additions to Arctic region pedons provide a set of 124 pedons with all parameters measured and not estimated, for direct calculation SOC and N stores. Histosols SOC and N stores can be estimated with the highest degree of confidence while the organic surface horizons of Andisols are the most variable. The grouping of soils by soil order can decrease variability of data estimates and identifies the differences in variability between soil orders.
For the future, more information about and sampling of the geologic deposits (>3 m) would shed light on the presence or absence of deeper OC deposits especially in areas with possible deep peat or yedoma deposits. Definition of the interrelationships of SOC measurements, ice/water content and soil physical properties, is need to develop better relationships for estimating Db in ice-rich permafrost soils. Alaska Spodosols also need investigation to develop better Db vs. SOC relationships. Data presented here provides the most data to-date and should help users recognize the evolutionary character of the Alaska soil carbon data set and to the extent possible, rectify the differing SOC assessment approaches that have been entered into the data set over time.
5. Acknowledgements
USDA-NRCS-University of Alaska Fairbanks Data Recovery Project, USDA Hatch and Alaska State Soil Survey Projects, and the NSF-ARCSS Flux, ATLAS, Biocomplexity of Patterned Ground and SNAC Projects, Beth Hall, Laurie Wilson and the UAF-Palmer Research Center Plant and Soil Analysis Laboratory.
REFERENCES
- R. Lal, J. M. Kimble, R. F. Follette and C. V. Cole, “The SOC in US Soils and SOC Loss from Cultivation,” In: R. Lal, et al., Eds., The Potential of US Cropland to Sequester Carbon and Mitigate the Greenhouse Effect, CRC Publisher, Boca Raton, 1994, pp. 18-21.
- N. B. Bliss and J. Maursetter, “Soil Organic Carbon Stocks in Alaska Estimated with Spatial and Pedon Data,” Soil Science Society of America Journal, Vol. 74, No. 2, 2010, pp. 565-579. doi:10.2136/sssaj2008.0404
- E. A. G. Schuur, et al., “High Risk of Permafrost Thaw,” Nature, Vol. 480, No. 7375, 2011, pp. 32-33.
- U. Mishra and W. J. Riley, “Alaska Carbon Stocks: Spatial Variability and Dependence on Environmental Factors,” Biogeoscience, Vol. 9, 2012, pp. 3637-3645. doi:10.5194/bg-9-3637-2012
- USDA-NRCS, “Soils Data, State Administrative Division: Alaska,” 2012. http://ncsslabdatamart.sc.egov.usda.gov/ querypage.aspx
- C. L. Ping, et al., “High Stocks of Soil Organic Carbon in the North American Arctic Region,” Nature Geoscience, Vol. 1, No. 9, 2008, pp. 615-619. doi:10.1038/ngeo284
- C. Tarnocai, et al., “Soil Organic Carbon Pools in the Northern Circumpolar Permafrost Region,” Global Biogeochemical Cycles, Vol. 23, No. 2, 2009, Article ID: GB2023. doi:10.1029/2008GB003327
- K. D. Johnson, et al., “Soil Carbon Distribution in Alaska in Relation to Soil-Forming Factors,” Geoderma, Vol. 167-168, 2011, pp. 71-84. doi:10.1016/j.geoderma.2011.10.006
- J. W. Harden, et al., “Field Information Links Permafrost Carbon to Physical Vulnerabilities of Thawing,” Geophysical Research Letters, Vol. 39, 2012, Article ID: L15704. doi:10.1029/2012GL051958
- Soil Survey Laboratory Staff, “Soil Survey Laboratory Methods Manual: Soil Survey Investigations Report No. 42, Version 4.0,” USDA-NRCS, 2004.
- J. M. Kimble, et al., “Determination of the Amount of Carbon in Highly Cryoturbated Soils,” In: D. A. Gilichinsky, Ed., Post-Seminar Proceedings of the Joint RussianAmerican Seminar on Cryopedology and Global Change, Russian Academy of Sciences, Pushchino, 15-16 November 1992, pp. 277-297.
- G. J. Michaelson, C. L. Ping and J. M. Kimble, “Effects of Soil Morphological and Physical Properties on the Estimation of Carbon Storage in Arctic Soils,” In: R. Lal, et al., Eds., Advances in Soil Science, Assessment Methods for Soil Carbon, C. Lewis Publisher, Bocca Raton, 2001, pp. 339-347.
- C. L. Ping, et al., “Sampling Protocols for PermafrostAffected Soils,” Soil Horizons, Vol. 54, No. 1, 2013, pp. 13-19. doi:10.2136/sh12-09-0027
- P. J. Schoeneberger, D. A. Wysocki, E. C. Benham and W. D. Broderson, “Field Book for Describing and Sampling Soils, Ver. 2.0,” USDA Natural Resource Conservation Service, National Soil Survey Center, Lincoln, 2002.
- G. J. Michaelson, C. L. Ping and M. Clark, “Soil Pedon C and N Data for Alaska,” 2013. http://www.uaf.edu/files/snras/Alaska-Soil-C-and-N-Pedon-Data-Table-5-24-2013.xlsx
- G. J. Michaelson, C. L. Ping and J. M. Kimble, “Carbon Storage and Distribution in Tundra Soils of Arctic Alaska, U.S.A.,” Arctic and Alpine Research, Vol. 28, No. 4, 1996, pp. 414-424. doi:10.2307/1551852
- G. Hugelius, et al., “The Northern Circumpolar Soil Carbon Database: Spatially Distributed Datasets of Soil Coverage and Soil Carbon Storage in the Northern Permafrost Regions,” Earth System Science Data, Vol. 5, 2013, pp. 3-13. doi:10.5194/essd-5-3-2013
- P. Kuhry, et al., “Upscaling Soil Organic Carbon Estimates for the Usa Basin (Northeast European Russia) Using GIS Based Landcover and Soil Classification Schemes,” Danish Journal of Geography, Vol. 102, No. 1, 2002, pp. 11-25.
- C. L. Ping, et al., “Cryogenesis and Soil Formation along a Bioclimate Gradient in Arctic North America,” Journal of Geophysical Resarch, Vol. 113, No. G3, 2008, Article ID: G03S12.
- G. Hugelius, et al., “High-Resolution Mapping of Ecosystem Carbon Storage and Potential Effects of Permafrost Thaw in Periglacial Terrain, European Russian Arctic,” Journal of Geophysical Research Biogeosciences, Vol. 116, 2011, Article ID: G03024.
- M. Kanevskiy, et al., “Ground Ice in the Upper Permafrost of the Beaufort Sea Coast of Alaska,” Cold Region Science and Technology, Vol. 85, 2012, pp. 56-70.
- E. G. Jobbagy and R. B. Jackson, “The Vertical Distribution of Soil Organic Carbon and its Relation to Climate and Vegetation,” Ecological Applications, Vol. 10, No. 2, 2000, pp. 423-436. doi:10.1890/1051-0761(2000)010[0423:TVDOSO]2.0.CO;2
- N. H. Batjes, “Total Carbon and Nitrogen in Soils of the World,” European Journal of Soil Science, Vol. 47, 1996, pp. 151-163. doi:10.1111/j.1365-2389.1996.tb01386.x
- K. A. Whittinghill and S. E. Hobbie, “Effects of Landscape Age on Soil Organic Matter Processing in Northern Alaska,” Soil Science Society of America Journal, Vol. 75, No. 3, 2011, pp. 907-917. doi:10.2136/sssaj2010.0318
- M. Lavoie and M. C. Mack, “Spacial Heterogeneity in Understory Vegetation and Soil in an Alaskan Upland Boreal Forest Fire Chronosequence,” Biogeochemistry, Vol. 107, No. 1-3, 2012, pp. 227-239. doi:10.1007/s10533-010-9547-x
- M. Kanevskiy, Y. Shur, D. Fortier, M. T. Jorgenson and E. Stephani, “Cryostratigraphy of Late Pleistocene Syngenetic Permafrost (Yedoma) in Northern Alaska, Itkillik River Exposure,” Quarternary Research, Vol. 75, No. 3, 2011, pp. 584-596. doi:10.1016/j.yqres.2010.12.003
- M. H. Clark and D. R. Kautz, “Soil Survey of Matanuska-Susitna Valley Area Alaska,” USDA Natural Resources Conservation Service, US Government Printing Office, Washington DC, 1998.
- S. Rieger, D. B. Schoephorester and C. F. Furbush, “Exploratory Soil Survey of Alaska,” USDA Soil Conservation Service, US Government Printing Office, Washington DC, 1979.
- J. B. Bockheim, K. M. Hinkel, W. R. Eisner and X. Y. Dai, “Carbon Pools and Accumulation Rates in an AgeSeries of Soils in Drained Thaw-Lake Basins, Arctic Alaska,” Soil Science Society of America Journal, Vol. 68, No. 2, 2004, pp. 697-704. doi:10.2136/sssaj2004.0697
- C. L. Ping, et al., “Soil Carbon and Material Fluxes across the Eroding Alaska Beaufort Sea Coastline,” Journal of Geophysical Research Biogeosciences, Vol. 116, 2011, Article ID: G02004.