Advances in Biological Chemistry
Vol.3 No.3(2013), Article ID:33577,9 pages DOI:10.4236/abc.2013.33038
Potential of proteins and their expression level in marine phytoplankton (Prymnesium parvum) as biomarker of N, P and Fe conditions in aquatic systems
![]()
1Institute of Science and Technology, Kanazawa University, Kanazawa, Japan
2Graduate School of Natural Science and Technology, Kanazawa University, Kanazawa, Japan
3Bangladesh Rice Research Institute (BRRI), Gazipur, Bangladesh
4Centre for Environmental Sustainability, School of the Environment, University of Technology Sydney, Sydney, Australia
Email: *hhiroshi@se.kanazawa-u.ac.jp, *rahmanmmamunur@gmail.com
Copyright © 2013 Hiroshi Hasegawa et al. This is an open access article distributed under the Creative Commons Attribution License, which permits unrestricted use, distribution, and reproduction in any medium, provided the original work is properly cited.
Received 8 April 2013; revised 17 May 2013; accepted 28 May 2013
Keywords: Phytoplankton; Protein; Biomarker; Nitrogen; Phosphorus; Iron; Aquatic Systems
ABSTRACT
Nitrogen (N), phosphorus (P) and Iron (Fe) are important nutrients for phytoplankton, and they are the key limiting nutrients in many marine systems. In the present study, growth and protein expression of marine phytoplankton Prymnesium parvum under different nitrate, phosphate and iron conditions were investigated in order to evaluate whether proteins and their expression level could be used as biomarkers of N, P, and Fe conditions in aquatic systems. The growth of P. parvum increased with the increase of nitrate, phosphate and iron concentrations in the culture medium. Protein expression levels also differed significantly (p < 0.001) for different nitrate, phosphate and iron conditions in the culture medium. The expression level of an 83 kDa protein at 0 and 5 µM nitrate treatments differed significantly (p < 0.001) from those at 20, 30, 50 and 100 µM nitrate treatments, indicating the expression levels of this protein as a biomarker of N status in the culture medium. A 121 kDa protein was up-regulated at phosphate stress conditions ([P] ≤ 1.0 µM), while this protein was not expressed at phosphate replete conditions ([P] ≥ 5 µM). Therefore, the expression of 121 kDa protein in P. parvum is indicative of phosphate deplete condition in aquatic systems. The expression level of a 42 kDa was significantly higher (p < 0.01) at Fe-stress condition ([Fe] = 0.01 µM) than Fe-replete conditions ([Fe] ≥ 0.1 µM). In addition, a new protein of 103 kDa was only expressed under Fe-deplete condition ([Fe] = 0.01 µM). Therefore, the 42 and 103 kDa proteins can be used as a biomarker of Fe-limitation condition of aquatic systems. However, further studies (two dimensional gel electrophoresis and mass spectrometry) are needed to identify and characterize these proteins in P. parvum.
1. INTRODUCTION
Primary productivity of aquatic systems is frequently rate-limited by the availability of nutrients. Principally this involves limitations of nitrogen (N), phosphorus (P) and iron (Fe) [1-3]. Nitrogen is an important nutrient for phytoplankton and is a major element of proteins, nucleic acids, chlorophylls, amino acids, N-containing osmolytes (glycine betaine) and chitin [4]. Nitrogen has been considered to be the predominant limiting nutrient in many coastal and deep sea systems [5,6], which is assumed to be responsible for the decrease of primary production of the aquatic systems [6,7]. Phosphorus is also an obligate requirement for all organisms, which is used for RNA, phospholipid and DNA biosynthesis [8]. It is also an important component of many cellular substrates such as glucose phosphate coenzymes, Adenosine triphosphate (ATP), Cyclic adenosine monophosphate (cAMP), Inositol triphosphate (IP3), and inorganic polyphosphate reserves [4]. Several studies have shown that many marine systems such as the Subtropical Pacific waters [9], the Mediterranean Sea [10], the Sargasso Sea [11], the North Pacific subtropical gyre [12], and the Atlantic Ocean [9] are P limited, which has been an important concern for a sustainable and healthy aquatic environment. Sa study by Elser et al. [6] showed that P limitation is equally strong and important concern to N limitation across marine and freshwater systems.
Iron comprises the central part of chlorophyll-a (Chl-a) molecule, and it is involved in many cellular biochemical processes such as photosynthesis, respiration, nitrogen fixation and nitrate, nitrite, and sulfate reductions [13]. Several studies have identified Fe as a limiting nutrient for phytoplankton [14,15] that controls the primary productivity in many high nutrient and low chlorophyll open seas such as the equatorial Pacific and Southern Ocean [10,16]. Iron limitation is also a major factor that control phytoplankton growth in the subarctic Pacific and the North Atlantic oceans [17].
A bioindicators, which are defined as organisms or biological responses that reveal the presence of chemicals in the environment by producing typical symptoms or measurable responses, have been widely accepted for monitoring ecological risks of environmental pollutants [18]. Usually, biological species or group of species, whose function, population, or status can reveal what degree of ecosystem or environmental integrity is present, are used as bioindicator. However, with the advancement of biotechnology, cellular macromolecules such as phytochelatins [19-21], glutathione [20], phospholipid fatty acid [22], proteins [23-27], and RNA [23] have also been used as bioindicators of metals, nutrients, and environmental pollutants in order to monitor and assess their ecological risks. In addition, several studies have shown that the expression levels of certain proteins [e.g., circulating reactive protein; CRP [25], heat shock protein; Hsp70 [26] can also be used as bioindicators of exposure to environmental contaminants and stressors. In the present study, the growth responses and protein expressions of unicellular marine phytoplankton Prymnesium parvum (Haptophyta) under different conditions of N, P and Fe were investigated under laboratory conditions in order to assess the potential of protein expression levels as bioindicators of nutritional conditions in aquatic systems.
2. MATERIALS AND METHODS
2.1. Phytoplankton Pre-Culture and Maintenance
Marine microalga P. parvum was collected from Fukuyama Bay, Hiroshima, Japan (This strain is gently provided from Prof. I. Imai, Hokkaido University, Japan). The microalgal strain was axenic (axenicity was assessed and monitored by 4’6-diamidino-2-phenylindole (DAPI) test). The axenic microalgal strain was pre-cultured for two weeks in 30-mL polycarbonate bottles with modified f/2 culture solution in artificial seawater without nitrogen ( ), phosphate (
 ), and Fe (FeCl3) (Table 1)
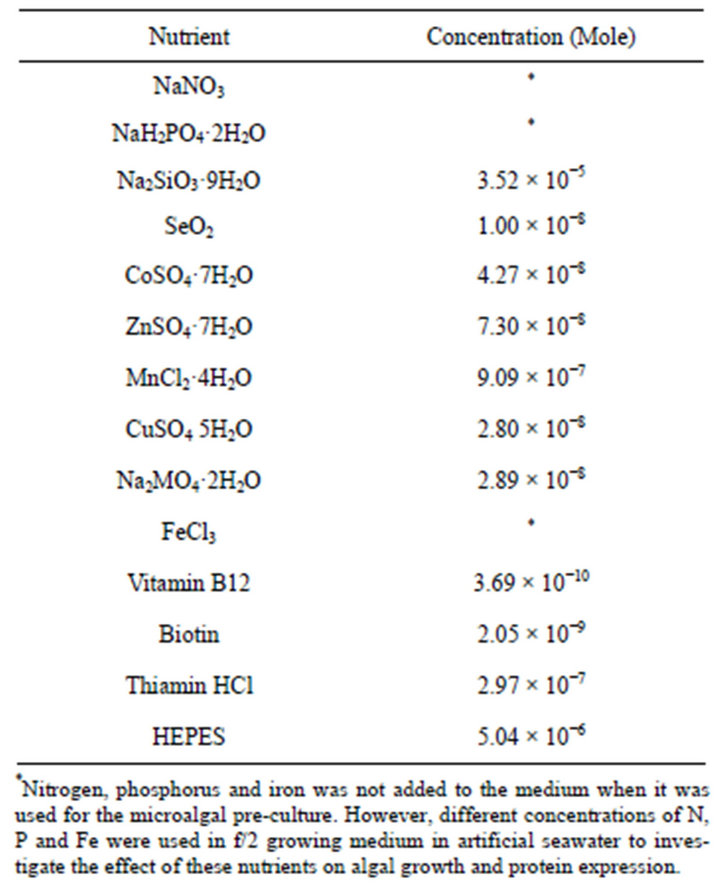
Table 1. Composition of in modified f/2 culture medium in artificial seawater used for growing phytoplankton.
[28,29].
2.2. Chemical Treatments and Growth Measurement
Nitrogen concentrations (prepared from NaNO3; Kanto Chemicals, Tokyo, Japan) of the culture medium were 5, 20, 30, and 50 μM. was used to prepare the solutions. Phosphate solution was prepared from NaH2PO4·2H2O (Wako Pure Chemicals, Osaka, Japan), and treatment concentrations were 10, 5, 1, 0.5 and 0.3 μM. The Fe concentrations (prepared from FeCl3; Kanto Chemicals, Tokyo, Japan) in the culture medium were 1, 0.7, 0.3, 0.1 and 0.01 μM. 10 - 5 M. A control treatment of the nutrients (N, P and Fe) were also included in each of the experiments. All other chemicals and reagents used in this study were of analytical grade.
Phytoplankton growth was measured on the basis of optical density using a spectrophotometer (U-2000, Hitachi High Technologies, Japan) at a wavelength of 540 nm (OD540) following the same method of Maki et al. [30]. The experiment was replicated for three times.
2.3. Growing of Phytoplankton
The phytoplankton strain was grown in 1-L polycarbonate bottles containing modified f/2 culture medium in artificial seawater (Table 1). The polycarbonate bottles and culture medium were sterilized (MLS-3780, SANYO, Japan) before suing them in the experiment. FeCl3 (10-5 M) solution (in 1 M HCl) was placed in the autoclave machine in a separate bottle to avoid Fe contamination. Then FeCl3 solution was mixed with the modified f/2 growing medium. The tips and micropipettes used in the test were also sterilized by autoclaving (wrapping with aluminium foil). Sterilization was done at 121˚C for 30 min. After sterilization, the materials were placed in a clean bench (MCV-710ATS, Sanyo, Japan) and was kept under ultra violet ray for 20 min.
There was no scope of contamination during the sterilization process. On the other hand, all chemicals and their method/source of preparation were carefully selected to avoid any contamination. Before adding Fe (10 - 5 M as FeCl3) to the sterilized growing medium, Fe concentration of the medium was measured and was found below 0.001 μM in every measurement. Ethylenediaminetetraacetic acid (EDTA), a source of Fe contamination, was not used in this study. Since Fe (10 - 5 M as FeCl3) was added to the growing medium after sterilization, and the phytoplankton were grown only 15 d, the possibility of precipitation of added FeCl3 was minimal, and EDTA was not necessarily required.
A 5 mL solution of phytoplankton strains (2 × 10³ cells mL-1 phytoplankton in logarithmic growth phase) was inoculated in 1 L of modified f/2 growing medium under laminar air flow condition. Then the phytoplankton was grown at 20˚C ± 2˚C temperature in the growth chamber with light and dark schedule 14:10 h and light intensity of 188 μE m−2·S−1.
2.4. Protein Extraction
After reaching logarithmic growth phase, the phytoplankton growth solution was transferred to a 50-mL centrifuge tube and centrifuged at 1800 rpm (relative centrifugal force; g = 450) for 10 min at 4˚C.
The supernatant was removed and the phytoplankton pellet was washed twice using 2 mL of 10 mM Tris-HCl (pH 7.2). Then 1.5 mL of 10 mM Tris-HCl was added to the sample to make a phytoplankton cell suspension. One mL of the phytoplankton cell suspension was transferred to a 1.5-mL micro-tube and sonicated for 20 seconds using an ultrasonic homogenizer (UH-50, Surface Mount Technology (SMT), Japan) at output 5 under ice-cold condition. The phytoplankton cell suspension was then centrifuged at 15,000 rpm (g = 14,000) for 10 min at 4˚C. The supernatant was then transferred to centrifugal filter unite (Amicon Ultra-4, MWCO of 5000 Da, Millipore). The proteins were recovered on the filters after being concentrated by centrifugation at 2000 rpm (g = 550) for 60 min at 4˚C.
2.5. Gel Electrophoresis of Protein
After adding 3.75 μL of 20% Triton X-100 [C14H22O(C2H4O)n] and 3.75 μL of 50 mM MgCl2 to 30 μL of protein sample of Fe-deplete and Fe-rich treatments, the samples were incubated in ice for 60 min. Equal volume (37.5 μL) of the sample and buffer solution (125 mM Tris-HCl, 4% sodium dodecyl sulfate (SDS), 10% 2-mercaptoethanol, 10% sucrose, 0.004% bromophenol blue (BPB), pH 6.8) were then mixed together and then incubated for 3 min at 95˚C. A molecular weight marker (MWM) was diluted by 20-times and an equal volume (30 μL) of MWM and buffer were mixed together and then incubated for 3 min at 95˚C. A 20 μL protein sample and MWM were loaded in 14% polyacrylamide gel. The gel was then run in a mini pageRun system (AE-6531, ATTO bioscience & Biotechnology, Japan) for 100 min at 40 mA current using buffer solution prepared with 25 mM Tris-HCl, 0.1% SDS, 192 mM glycine. After electrophoresis, the gel was stained by AgNO3 staining following the procedure of Gromova and Celis [31]. The molecular weights of protein bands were then measured by Alpha-Ease FC (v 4.0) software.
2.6. Statistics
One-way ANOVA of the growth and protein expression data was performed with GraphPad InStat (GraphPad Software, USA) to assess the significant differences among the mean values of the nutrient treatments.
3. RESULTS AND DISCUSSION
3.1. Growth of Phytoplankton under Different N, P, and Fe Conditions
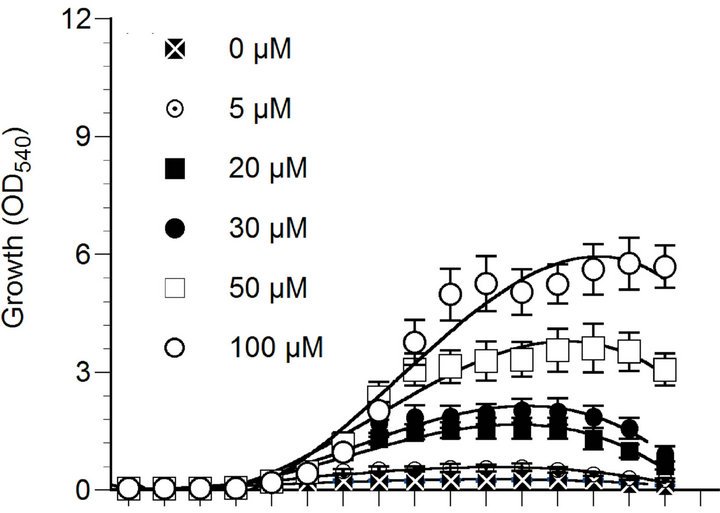
The growth of marine phytoplankton P. parvum was largely affected by N, P and Fe concentrations in culture medium (Figure 1(a)). Phytoplankton growth was the highest at 100 µM nitrate concentration and the lowest in N starvation (0 - 5 µM nitrate concentrations). In fact, phytoplankton growth was gradually increased with the increase of nitrate concentration in the culture medium. However, the growth of the organism decreased gradually after day 12, which may be because of gradual decrease of N concentration in the culture medium with exposure time due to uptake by the organism. The phytoplankton did not grow when phosphate was not added to the culture medium. Compared to 0.3 - 1.0 µM phosphate treatments, the growth of P. parvum was significantly (p < 0.05) higher under 5 - 10 µM phosphate treatments (Figure 1(b)). Phosphorus and nitrogen limitation of phytoplankton growth has been well documented in previous studies [32,33] due to the fact that these nutrients are involved in many biochemical reactions including proteins, nucleic acids, chlorophylls and amino acids biosynthesis in photosynthetic organisms [4,8].
The marine phytoplankton P. parvum showed normal growth at Fe concentration of 0.1 µM or above, and
 (a)
(a) (b)
(b)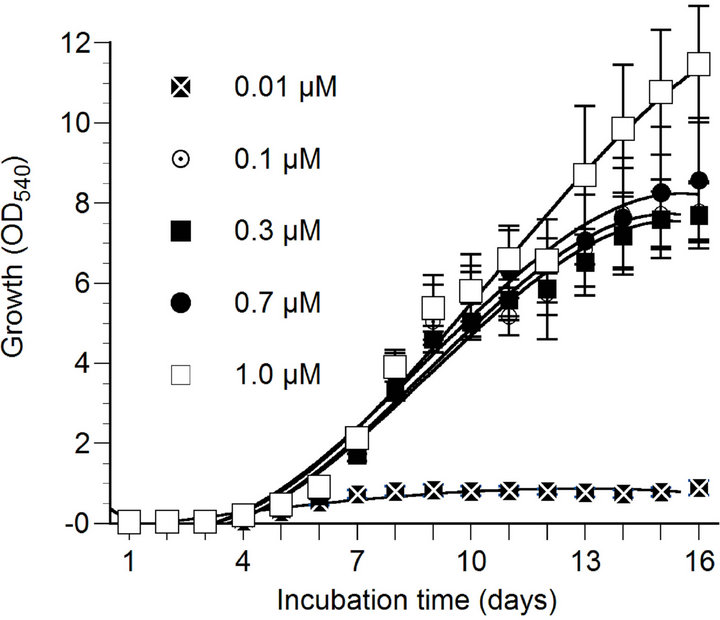 (c)
(c)
Figure 1. Effect of nitrate (a), phosphate (b) and iron (c) concentrations on the growth of Prymnesium parvum. The growth measurement was performed based on the optical density at a wavelength of 540 nm (OD540). Data are mean ± SD (n = 3).
growth was significantly reduced (p < 0.05) at 0.01 µM Fe concentration (Figure 1(c)). In marine systems, Fe has been identified as a limiting nutrient for phytoplankton [14,15] that reduce phytoplankton grown and primary productivity in many open seas such as the equatorial Pacific and Southern Ocean [10,16] and the subarctic Pacific and the North Atlantic oceans [17]. The growth reduction under Fe-trace condition may associated with the fact that this nutrient play important roles in many cellular biochemical processes such as photosynthesis, respiration, nitrogen fixation, and nitrate, nitrite, and sulfate reductions [13].
3.2. Proteomic Expression of P. parvum in Response to Different N, P, and Fe Conditions
Protein expression of the marine phytoplankton P. parvum was studied under different conditions of nitrate, phosphate and iron in the culture medium. Results showed that that P. parvum changes the expression levels of certain proteins in response to different concentrations of the nutrients. For example, an 83 kDa protein was highly expressed in P. parvum at 5 µM nitrate treatment, and it’s expression was significantly down-regulated (p < 0.001) at higher nitrate treatments (20 - 100 µM) (Figure 2). The expression level of this protein at 0 µM nitrate treatment was also significantly lower (p < 0.001) than that at 5 - 100 µM nitrate treatments (Figure 1(b)). In the present study, we did not identify and characterize the 83 kDa protein, however, Palenik and Koke [34] reported the expression of a N-regulated cell membrane or cell wall bound protein (nrp1) of similar molecular weight (82 kDa) under N-limitation in two strains of a singlecelled planktonic alga Emiliania huxleyi. Although Palenik and Koke [34] reported the expression of 82 kDa protein under N-deplete condition, the 83 kDa protein was expressed under both N-deplete and N-replete conditions, however, the expression levels differed for Ndeplete and N-replete conditions (Figure 2(b)). Therefore, the expression levels of the 83 kDa protein can be a useful biomarker for N conditions in an aquatic system.
The levels of protein expression in P. parvum also differed significantly for different phosphate concentrations in the culture medium. Prymnesium parvum expressed a new protein of 121 kDa at phosphate concentrations of ≤1 µM, and this protein was not expressed at phosphate concentrations ≥ 5 µM (Figure 3). It is notable that P. parvum showed a significant growth reduction (p < 0.05) at phosphate concentrations of ≤1 µM (Figure 1(b)), in which the 121 kDa protein was upregualted. Therefore, this protein in P. parvum can be used as a biomarker of P-deplete condition of an aquatic system. Further studies on the identification and characterization of the 121 kDa protein are needed in order to better understand the molecular functions of this protein under P-deplete condition.
 (a)
(a) (b)
(b)
Figure 2. (a) Protein expression of marine phytoplankton Prymnesium parvum in sodium dodecyl sulfate (SDS) gel electrophoresis under different nitrate concentrations. Lane M is the molecular marker. Arrow indicates protein band that was differentially expressed under different nitrate concentrations; (b) Expression levels of 83 kDa protein under different nitrate concentrations. Different letters on the bars indicate significant difference (p < 0.001) between the treatments.
 (a) (b)
Figure 3. (a) Protein expression of marine phytoplankton Prymnesium parvum in sodium dodecyl sulfate (SDS) gel electrophoresis under different phosphate concentrations. Lane M is the molecular marker. Arrow indicates protein band that was differentially expressed under different nitrate concentrations; (b) Expression levels of 121 kDa protein under different phosphate concentrations. Same letter on the bars indicate no significant difference (p > 0.05) between the treatments.
Compared to Fe-replete conditions ([Fe] ≥ 0.1 µM), the expression of a 42 kDa protein increased significantly (p < 0.01) and a new protein of 103 kDa was expressed under Fe-deplete condition ([Fe] = 0.01 µM) (Figure 4(a)). The up-regulation of 42 kDa protein has also been reported in cyanobacteria (Synechococcus, Trichodesmium, and Crocosphaera spp. [35] and Synechococcus sp. [36]) under Fe-depleted condition. This protein has been characterized as a cytoplasmic membrane carotenoprotein of the cyanobacterium Synechococcus sp. strain PCC7942 by Reddy et al. [37] which is involved in Fe-deficient growth of the cyanobacterium. In a later study, Webb et al. [35] identified the 42 kDa protein as membrane-bound iron deficiency-induced protein A (IdiA) homologue. Webb et al. [35] proposed this protein as an excellent biomarker for Fe stress in openocean cyanobacterial field populations. The present study showed that marine phytoplankton P. parvum also expressed the 42 kDa protein in response to Fe-stress condition, which can be used as a biomarker of Fe-stress condition of marine systems. However, further study is needed to characterize this protein in order to better understand the cellular functions in P. parvum.
A new protein of 103 kDa was expressed only under Fe-deplete condition (Figure 4(a)). Prinz and Tommassen [38] reported the expression of a 103 kDa protein in a bacterium (Neisseria meningitidis), and characterized as a Fe-regulated outer membrane protein of the organism. The present study reports the expression of 103 kDa protein in marine phytoplankton P. parvum in response to Fe-limitation, and we propose this protein as a potential biomarker of Fe-deplete condition of marine systems.
3.3. Proteins and Their Expression Levels as Biomarker of N, P and Fe Status in Aquatic Systems
A biomarker, an indicator of a biological state, has been widely used in many scientific fields such as medicine, cell biology, geology, astrobiology and ecotoxicology. The nature of biomarkers and the objectives of their use differ for scientific fields. For example, in cell biology biomarker is a molecule that facilitates the characterization of a cell type, their identification, and eventually their isolation. In ecotoxicology, biomarkers are used to indicate an exposure to or the effect of xenobiotics which are present in the environment and in organisms.
Biomarkers have been used in order to monitor the health of an environment or ecosystem and the ecological risks of pollutants [18]. Biomarkers can be measured at molecular, biochemical, cellular, or physiological
 (a) (b)
Figure 4. (a) Protein expression of marine phytoplankton Prymnesium parvum in sodium dodecyl sulfate (SDS) gel electrophoresis under different iron concentrations. Lane M is the molecular marker. Arrows indicate protein bands that were differentially expressed under different iron concentrations. The 103 kDa protein only expressed under iron-deplete condition, while a 42 kDa differentially expressed under different iron concentrations; (b) Expression levels of 42 kDa protein under different nitrate concentrations. Different letters on the bars indicate significant difference (p < 0.01) between the treatments.
levels of biological organization [39]. The use of proteins [27,40,41] and their expression level [25,26] in microorganisms have been proposed as biomarkers of nutrient and heavy metal conditions in aquatic systems. In the present study, we also have found several proteins to be differentially expressed in marine phytoplankton P. parvum in response to different exposure levels of nitrate, phosphate and iron. We proposed for the present study that the expression levels of an 83 kDa protein in P. parvum can be used as the biomarker of N-status, while a 121 kDa protein can be used as a biomarker of P-deplete condition in aquatic systems. In addition, a 103 kDa protein expression in P. parvum can be the indication of Felimitation, while the expression level of a 42 kDa protein can used as a biomarker of Fe-status (deplete or replete conditions) in aquatic systems. In the present study, we could not characterize and identify these proteins. Further studies are needed to identify the location of the proteins and to characterize the proteins to understand the role of the proteins in cellular metabolic pathways of P. parvum.
4. ACKNOWLEDGEMENTS
This research was supported by a Grand-in-Aid for scientific research (24310056) from the Japan Society for the Promotion of Science. Dr. M. Azizur Rahman wish to acknowledge supports from the University of Technology, Sydney (UTS), Australia.
REFERENCES
- Menzel, D.W., Hulburt, E.M. and Tyther, J.H. (1963) The effects of enriching Sargasso sea water on the production and species composition of the phytoplankton. Deep Sea Research and Oceanographic Abstracts, 10, 209-219. doi:10.1016/0011-7471(63)90357-7
- Moore, J.K. and Doney, S.C. (2007) Iron availability limits the ocean nitrogen inventory stabilizing feedbacks between marine denitrification and nitrogen fixation. Global Biogeochemical Cycles, 21, GB2001. doi:10.1029/2006GB002762
- Timmermans, K.R., Van der Wagt, B., Veldhuis, M.J.W., Maatman, A. and De Baar, H.J.W. (2005) Physiological responses of three species of marine pico-phytoplankton to ammonium, phosphate, iron and light limitation. Journal of Sea Research, 53, 109-120. doi:10.1016/j.seares.2004.05.003
- Geider, R. and La Roche, J. (2002) Redfield revisited: Variability of C:N:P in marine microalgae and its biochemical basis. European Journal of Phycology, 37, 1-17. doi:10.1017/S0967026201003456
- Howarth, R.W. and Marino, R. (2006) Nitrogen as the limiting nutrient for eutrophication in coastal marine ecosystems: Evolving views over three decades. Limnology and Oceanography, 51, 364-376. doi:10.4319/lo.2006.51.1_part_2.0364
- Elser, J.J., Bracken, M.E.S., Cleland, E.E., Gruner, D.S., Harpole, W.S., Hillebrand, H., Ngai, J.T., Seabloom, E.W., Shurin, J.B. and Smith, J.E. (2007) Global analysis of nitrogen and phosphorus limitation of primary producers in freshwater, marine and terrestrial ecosystems. Ecology Letters, 10, 1135-1142. doi:10.1111/j.1461-0248.2007.01113.x
- Tyrrell, T. (1999) The relative influences of nitrogen and phosphorus on oceanic primary production. Nature, 400, 525-531. doi:10.1038/22941
- Van Mooy, B.A.S., Fredricks, H.F., Pedler, B.E., Dyhrman, S.T., Karl, D.M. and Koblížek M. (2009) Phytoplankton in the ocean use non-phosphorus lipids in response to phosphorus scarcity. Nature, 458, 69-72. doi:10.1038/nature07659
- Ammerman, J.W., Hood, R.R., Case, D.A. and Cotner, J.B. (2003) Phosphorus deficiency in the Atlantic: An emerging paradigm in oceanography. Eos, Transactions American Geophysical Union, 84, 165. doi:10.1029/2003EO180001
- Beardall, J., Berman, T., Heraud, P., Omo Kadiri, M., Light, B.R., Patterson, G., Roberts, S., Sulzberger, B., Sahan, E. and Uehlinger, U. (2001) A comparison of methods for detection of phosphate limitation in microalgae. Aquatic Sciences-Research across Boundaries, 63, 107- 121. doi:10.1007/PL00001342
- Moore, C.M., Mills, M.M., Langlois, R., Milne, A., Achterberg, E.P., La Roche, J. and Geider, R.J. (2008) Relative influence of nitrogen and phosphorous availability on phytoplankton physiology and productivity in the oligotrophic sub-tropical North Atlantic Ocean. Limnology and Oceanography, 53, 291. doi:10.4319/lo.2008.53.1.0291
- Van Mooy, B.A.S., Rocap, G., Fredricks, H.F., Evans, C.T. and Devol, A.H. (2006) Sulfolipids dramatically decrease phosphorus demand by picocyanobacteria in oligotrophic marine environments. Proceedings of the National Academy of Sciences, 103, 8607-8612. doi:10.1073/pnas.0600540103
- Geider, R.J. and Roche, J. (1994) The role of iron in phytoplankton photosynthesis, and the potential for ironlimitation of primary productivity in the sea. Photosynthesis Research, 39, 275-301. doi:10.1007/BF00014588
- Watson, A.J., Bakker, D.C.E., Ridgwell, A.J., Boyd, P.W. and Law, C.S. (2000) Effect of iron supply on Southern Ocean CO2 uptake and implications for glacial atmospheric CO2. Nature, 407, 730-733. doi:10.1038/35037561
- Shi, D., Xu, Y., Hopkinson, B.M. and Morel, F.M.M. (2010) Effect of ocean acidification on iron availability to marine phytoplankton. Science, 327, 676-679. doi:10.1126/science.1183517
- Blain, S., Quéguiner, B., Armand, L., Belviso, S., Bombled, B., Bopp, L., Bowie, A., Brunet, C., Brussaard, C. and Carlotti, F. (2007) Effect of natural iron fertilization on carbon sequestration in the Southern Ocean. Nature, 446, 1070-1074. doi:10.1038/nature05700
- Moore, C.M., Hickman, A.E., Poulton, A.J., Seeyave, S. and Lucas, M.I. (2007) Iron-light interactions during the CROZet natural iron bloom and EXport experiment (CROZEX): II-Taxonomic responses and elemental stoichiometry. Deep Sea Research Part II: Topical Studies in Oceanography, 54, 2066-2084. doi:10.1016/j.dsr2.2007.06.015
- Bartell, S.M. (2006) Biomarkers, bioindicators, and ecological risk assessment—A brief review and evaluation. Environmental Bioindicators, 1, 60-73. doi:10.1080/15555270591004920
- Gawel, J.E., Trick, C.G. and Morel, F.M.M. (2001) Phytochelatins are bioindicators of atmospheric metal exposure via direct foliar uptake in trees near Sudbury, Ontario, Canada. Environmental Science & Technology, 35, 2108-2113. doi:10.1021/es0016250
- Kawakami, S.K., Gledhill, M. and Achterberg, E.P. (2006) Production of phytochelatins and glutathione by marine phytoplankton in response to metal stress. Journal of Phycology, 42, 975-989. doi:10.1111/j.1529-8817.2006.00265.x
- Morelli, E. and Pratesi, E. (1997) Production of phytochelatins in the marine diatom phaeodactylum tricornutum in response to copper and cadmium exposure. Bulletin of Environmental Contamination and Toxicology, 59, 657-664. doi:10.1007/s001289900530
- Kaur, A., Chaudhary, A., Kaur, A., Choudhary, R. and Kaushik, R. (2005) Phospholipid fatty acid—A bioindicator of environment monitoring and assessment in soil ecosystem. Current Science, 89, 1103-1112.
- Haasch, M.L., Quardokus, E.M., Sutherland, L.A., Goodrich, M.S., Prince, R., Cooper, K.R. and Lech, J.J. (1992) CYP1A1 protein and mRNA in teleosts as an environmental bioindicator: Laboratory and environmental studies. Marine Environmental Research, 34, 139-145. doi:10.1016/0141-1136(92)90098-7
- Sánchez, E., Soto, J.M., García, P.C., López-Lefebre, L.R., Rivero, R.M., Ruiz, J.M. and Romero, L. (2000) Phenolic and oxidative metabolism as bioindicators of nitrogen deficiency in French bean plants (Phaseolus vulgaris L. cv. Strike). Plant Biology, 2, 272-277. doi:10.1055/s-2000-3699
- Karsten, A.H. and Rice, C.D. (2004) c-Reactive protein levels as a biomarker of inflammation and stress in the Atlantic sharpnose shark (Rhizoprionodon terraenovae) from three southeastern USA estuaries. Marine Environmental Research, 58, 747-751. doi:10.1016/j.marenvres.2004.03.089
- Lewis, S., Donkin, M.E. and Depledge, M.H. (2001) Hsp70 expression in Enteromorpha intestinalis (Chlorophyta) exposed to environmental stressors. Aquatic Toxicology, 51, 277-291. doi:10.1016/S0166-445X(00)00119-3
- Shpigel, M., Ragg, N.L., Lupatsch, I. and Neori, A. (1999) Protein content determines the nutritional value of the seaweed Ulva lactuca L. for the abalone Haliotis tuberculata L. and H. discus hannai Ino. Journal of Shellfish Research, 18, 227-234.
- Guillard, R.R.L. and Ryther, J.H. (1962) Studies of marine planktonic diatoms: I. Cyclotella nana hustedt, and detonula confervacea (cleve) gran. Canadian Journal of Microbiology, 8, 229-239. doi:10.1139/m62-029
- Lyman J. and Fleming R.H. (1940) Composition of sea water. Journal of marine Research, 3, 134-146.
- Maki, T., Suzuki, T., Kido, K., Nakahara, A., Higashi, T., Hasegawa, H., Ueda, K. and Saijoh, K. (2008) Effect of iron stress on gene expression in harmful microalga Prymnesium parvum. Journal of Ecotechnology Research, 14, 13-16.
- Gromova, I. and Celis, J.E. (2006) Protein detection in gels by silver staining: A procedure compatible with massspectrometry. Cell Biology: A Laboratory Handbook, 4, 421-429.
- Colijn, F. and Cadée, G.C. (2003) Is phytoplankton growth in the Wadden Sea light or nitrogen limited? Journal of Sea Research, 49, 83-93. doi:10.1016/S1385-1101(03)00002-9
- Elser, J.J., Marzolf, E.R. and Goldman, C.R. (1990) Phosphorus and nitrogen limitation of phytoplankton growth in the freshwaters of North America: A review and critique of experimental enrichments. Canadian Journal of Fisheries and Aquatic Sciences, 47, 1468-1477. doi:10.1139/f90-165
- Palenik, B. and Koke, J.A. (1995) Characterization of a nitrogen-regulated protein identified by cell surface biotinylation of a marine phytoplankton. Applied and Environmental Microbiology, 61, 3311-3315.
- Webb, E.A., Moffett, J.W. and Waterbury, J.B. (2001) Iron stress in open-ocean cyanobacteria (Synechococcus, Trichodesmium, and Crocosphaera spp.): Identification of the IdiA Protein. Applied and Environmental Microbiology, 67, 5444-5452. doi:10.1128/AEM.67.12.5444-5452.2001
- Reddy, K.J., Bullerjahn, G.S., Sherman, D.M. and Sherman, L.A. (1988) Cloning, nucleotide sequence, and mutagenesis of a gene (irpA) involved in iron-deficient growth of the cyanobacterium Synechococcus sp. strain PCC7942. Journal of Bacteriology, 170, 4466-4476.
- Reddy, K.J., Masamoto, K., Sherman, D.M. and Sherman, L.A. (1989) DNA sequence and regulation of the gene (cbpA) encoding the 42-kilodalton cytoplasmic membrane carotenoprotein of the cyanobacterium Synechococcus sp. strain PCC 7942. Journal of Bacteriology, 171, 3486-3493.
- Prinz, T. and Tommassen, J. (2000) Association of ironregulated outer membrane proteins of Neisseria meningitidis with the RmpM (class 4) protein. FEMS Microbiology Letters, 183, 49-53. doi:10.1111/j.1574-6968.2000.tb08932.x
- Ricketts, H.J., Morgan, A.J., Spurgeon, D.J. and Kille, P. (2004) Measurement of annetocin gene expression: A new reproductive biomarker in earthworm ecotoxicology. Ecotoxicology and Environmental Safety, 57, 4-10. doi:10.1016/j.ecoenv.2003.08.008
- Shepard, J.L. and Bradley, B.P. (2000) Protein expression signatures and lysosomal stability in Mytilus edulis exposed to graded copper concentrations. Marine Environmental Research, 50, 457-463. doi:10.1016/S0141-1136(00)00119-7
- Shepard, J.L., Olsson, B., Tedengren, M. and Bradley, B.P. (2000) Protein expression signatures identified in Mytilus edulis exposed to PCBs, copper and salinity stress. Marine Environmental Research, 50, 337-340. doi:10.1016/S0141-1136(00)00065-9
NOTES
*Corresponding authors.