Journal of Surface Engineered Materials and Advanced Technology
Vol.4 No.2(2014), Article ID:45469,11 pages DOI:10.4236/jsemat.2014.42015
Calculating the Phase Transformation Kinetics Using Impedance Spectroscopy for Sb2Te3
Carlos Rivera-Rodríguez1*, Juan Aspiazu Fabián2, Raúl Díaz Godoy2
1Environmental Studies Department, National Institute for Nuclear Research, Carretera México-Toluca S/N (Km 36.5), 52750 La Marquesa, Mexico
2Accelerators Department, National Institutefor Nuclear Research, Carretera México-Toluca S/N (Km 36.5), 52750 La Marquesa, Mexico
Email: *carlos.rivera@inin.gob.mx
Copyright © 2014 by authors and Scientific Research Publishing Inc.
This work is licensed under the Creative Commons Attribution International License (CC BY).
http://creativecommons.org/licenses/by/4.0/


Received 27 February 2014; revised 26 March 2014; accepted 20 April 2014
ABSTRACT
This paper describes a simple form, the theory to determine the crystallization fraction during the phase transformation of a solid, at a constant heating rate, from data obtained by impedance spectroscopy, where the change of the applied alternating voltage and measured current are proportional to the microstructural changes at the sample, corresponding to the volume fraction of a series layer model of two phases. To determine the volume fraction of each phase present in the sample, electrical data are obtained: conductivity and permittivity at DC, which are modeled by an electrical circuit composed by 2-RC, taking into that the permittivity and the occupied volume correspond to the filling fraction of each phase. By Cathodic Erosion or Sputtering, samples were obtained in film form of about 500 in thickness, composed of an alloy of Sb2Te3, in amorphous phase. To ensure the existence of the phase transformation in the sample, phase transition tests are performed by changes in: Reflection Optics, Electrical Resistivity and X-Ray Diffraction, showing clearly the presence of such a transformation. In the final part of this work, it completely shows the experimental results, giving a clear and precise idea of the kinetics of phase transformation of Sb2Te3 alloy, by impedance spectroscopy technique, which proves to be a simple and practical calculation tool.
Keywords:Phase Transformation, Sb2Te3, Impedance Spectroscopy

1. Introduction
It is observed that any substance or material element when subjected to changes in temperature or pressure, is obtained different states or phases of the same material with the same chemical composition, called “Aggregate states of matter”. Currently, it is known that these aggregate states of matter are closely related to attraction or repulsion forces of the particles (molecules, atoms or ions) that constitute it, which are from those that occur naturally in our environment, to the Bose-Einstein condensate, Fermiones condensate, etc. with very specific properties and characteristics in each.
Why a same substance can have different aggregation states under what conditions it takes, all the more, what are the mechanisms for carrying out such transformation, are always questions that have been raised and currently the kinetic theory is able to resolve.
Specifically, phase transformation from a crystalline state to an amorphous state, and heterogeneous reactions in solid state, tend to be described through nucleation mechanisms and grain growth, while homogeneous reactions could be conducted by diffusion processes. This means that the phase transformation is performed simultaneously on the entire array of the initial solid phase, without allowing the creation of an interface between them.
This phase transformation is possible, if nucleation energy decreases so that the nuclei are too small, but they are in all material, allowing the initial phase behave unstably, and become instant. For the case where processing is carried out without change in the chemical composition of the amorphous structure, it is called “Controlled transformation Interface”, as occurs in the recrystallization, and some other processes. But in the case of change occurring in the composition of the final phase, the process will be controlled by diffusion and a clear example is the precipitin reactions by saturated solutions, requiring this process transport of atoms to long range, which is: entering and leaving the atoms of the growing region, allowing segregation of some element.
These types of transformations constitute an important basis in fundamental research and in applied research. Because in many technological applications of solid state equipment, requiring materials that are thermally stable over time and of course in temperature fluctuations during its use, the amorphization and crystallization of alloys or also metal recrystallization during cooling work are only representative examples of this transformation type.The study presented here, has been used not only to describe a wide range of phase transformation in the solid state, but also in heterogeneous chemical reactions, such as, solid-gas decomposition, solid attack by acid, ammonia synthesis, petroleum cracking, oxidation of SO2 to SO3, etc. Besides, being able to be applied to other areas, such as, biology and environment, it takes into account the theory of mechanisms and concept of universals.
The experimental procedures employed for the study of the kinetics of solid phase transformation, are often a limiting factor, because they are to be laborious. However, the increasing use of different techniques has helped simplify and obtain useful data with the use of thermal analytical methods or simple electrical, as the one presented in this work. These methods are certainly useful tools, long as correctly used in the analysis of experimental data, for this reason, many mathematical calculations have been proposed, and are based on the kinetic theory of phase transformation and with totally different assumptions.
The next section (Section 2) discussed the classical theory for calculating the phase transformation fraction, assuming certain conditions for simplification. Subsequently Section 3 presented a model capable of determining experimentally the kinetics of phase transformation, from the electrical conductivity measured in the different samples through our equipment (Section 4), according to the geometric characteristics of the specimens. In section 5 of this paper, the results obtained are shown by alternative techniques, to confirm the existence of such phase transformation in the material compound Sb2Te3. Finally, the results obtained by Impedance Spectroscopy (IS) are shown and through them the crystallization fraction of the alloy is calculated, specifying in the graph obtained, nucleation, growth and saturation time during the phase transition.
In this way, the kinetic exponent and the activation energy of the Sb2Te3, are calculated by a phase transition during a heterogeneous reaction in solid phase, as well as its classical interpretation of these results.
2. Calculating the Phase Transformation Fraction
The volume fraction of phase transformation (x), may be calculated by a different thermal history using experimental techniques, such as: DSC (Differential scanning calorimetry), DTA (Differential thermal Analysis), electrical resistivity, optical properties (reflection and transmission), hardness measurements, X-Ray Diffraction (XRD), etc. Unfortunately both in theory and in practice the different models and methods for determining the kinetic parameters are far from being considered universal. Kinetic relationship developed independently by: Kolmogorov [1] , John and Mehl [2] , Avrami [3] and Yerofeev [4] , leading to the famous Equation JMAYK, has been widely used not only to describe a variety of solid state transformations, but also in heterogeneous chemical reactions, such as solid-gas decomposition, among others.
The kinetic Equation JMAYK is based on the concept of “Extended Volume”, which consists in generating a volume within a certain phase material, which take the new phase formed in the absence of any external effects and even phase overlaps transformed at adjacent locations, which means it is simply the ratio of the kinetic laws phase growth.
A calculation of the kinetic Equation formulation JMAYK was done by Christian [5] , which describes the time evolution of the crystalline volume x, in terms of the frequency of nucleation per unit volume Iv and the rate of crystal growth u, by the following equation:
 (1)
(1)
where: g, is a geometric factor that depends on the shape of the crystal growth, t, is the induction time or incubation time and m is an integer or half integer which depends on the growth mechanism and dimensionality crystal.
This Equation is valid under various thermal conditions, to such a degree that depends on the initial time for both Iv and for u, implicit time dependence of Iv[T(τ)] and u[T(θ)], may be included without further problem. Therefore, under isothermal conditions and assuming an Arrhenius type dependence for the nucleation and growth rates of grain, is obtained by:
 (2)
(2)
EN y EG, are energy nucleation and energy growth respectively,  is the Boltzmann constant and T is the absolute temperature, substituting these values in Equation (1) and integrating, we obtain:
 (3)
(3)
This is the basic Equation for calculating the transformed volume fraction, redefining constants; we obtain the general relation for isothermal transformations proposed by Avrami.
 (4)
(4)
 (5)
(5)
E is the effective energy of the system, which may be calculate the activation energy which describes the crystallization process by:
 (6)
(6)
n is the kinetic exponent defines the condition of phase transformation, which may be: polymorphic or diffusion controlled [6] .
The experimental procedures employed for the study of the kinetics of phase transformation were often a limiting factor, because the laborious that happen to be the calculation. However, the increase in the use of different techniques helped simplify and obtain useful data with the aid of thermo-analytical methods simple. These methods are certainly useful tools, as long as aptly used in the analysis of experimental data, for this reason large number of mathematical calculations have been proposed based on transformation kinetics theory and totally different assumptions.
The method presented in this paper is mainly based on the equations proposed by Avrami for isothermal transformations (4) and (5), assuming the heating rate Z is constant, i.e.:
 (7)
(7)
where To is the initial temperature and Z = dx/dt, leaving completely determined by this effective energy system (E), now just need to calculate the kinetic exponent of the system (n). Ozawa [7] is determined by differentiating and then clears it of Equation (4), obtaining the following expression:
 (8)
(8)
So then, for isothermal processes when plotting In[In(1 − x)] versus Int is obtained n, another option to calculate the kinetic exponent of the system are the contributions made by Borchardt [8] and Pilotan [9] , which involve differentiation with respect to time in Equation (4), later determined by Augis and Bennett [10] , which are not discussed in this work, but worth mentioning as an alternative form.
3. Electrical Method for Studying the Kinetics of Phase Transformation
Phase transformation from the electrical standpoint, results in changes in conductivity of the material, showing an increase due to the transformation of the amorphous phase to the crystalline phase or decreased in the case of contrary transformation of the crystalline phase to the amorphous phase. So, using this technique presents a method used to completely determine the kinetics of phase transformation of a solid material.
This model to determine the kinetics of phase transformation from the conductivity was proposed by Mott and Davis [12] , based on an Arrhenius dependence, where involved conduction terms through extended states, conductivity for tunneling effect and conductivity for impurities in the material, model applied which is shown to be a simple, fast and accurate for the study of phase transformation. However, this model does not provide information on the material microstructure such as grain boundary volume, dielectric constant, etc.
On the other hand, the Impedance Spectroscopy (IS) used by Ross [13] , usually applied in electrochemistry and polycrystalline structures, shown to be a viable technique as it has been applied in the study of structural transformations of amorphous solid materials [14] . The impedance that is by definition a complex quantity which depends on the frequency (w), is determined from the ratio of the applied alternating voltage and the measured current:
 (9)
(9)
The results obtained by IS, include transport processes at the molecular level in the sample and fundamental processes such as: oxidation-reduction phenomena, grain boundary, defects, corrosion, porosity, etc. This is because studies to determine electrical properties in heterogeneous medium, dates from the late XIX, developments proposed by Maxwell [15] , which to date have been arduously studied and refined by several authors.
Impedance spectra obtained in the complex plane in two phase materials mixed, may be related to equivalent circuits with different methods, corresponding to this geometry of the material in thin film form. The conductivity and/or the capacitance of polycrystalline materials can be completely determined from this methodology, with the sole condition of having efficient ohmic contacts, optimal metals like gold, silver, aluminum or copper in the latter case, on the surface of the sample to be studied [16] , for the purpose of ensure reliable measurements on structures present.
So then, the volume fraction of the two phase present in the material x1 and x2, may be shown theoretically to calculate the in series layer model, Figure 1. The total thickness for this model to present each is proportional to the volume fraction of each phase.
Respectively, conductivity and resistivity for this model are given by:
 (10)
(10)
 (11)
(11)
Layer model serial to the contacts is equivalent to a circuit composed of two series RC, as shown in the following Figure 2.

Figure 1. Layer model serial for two phases.

Figure 2. Serial circuit composed.
Calculating the values for each of the components, extensive conductive to the volume (g1 and g2), and capacitive (C1 and C2), according to the model, are given by:
 (12)
(12)
where: s1, s2, e1 and e2, are defined as DC conductivity and permittivity of each phase respectively, graphs of impedance spectra for this model takes the form of semi-circles with diameters defined by 1/g1 and 1/g2 for each phase, while the time constants are given by T1 = C1/g1 and T2 = C2/g2, with different values for the capacitances fully employed in each of them.
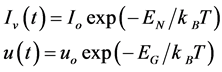
The acquisition of resistivity values and therefore electrical conductivity of the material as a function of temperature and time, developed in practice from samples with planar geometry, as shown in the diagram in figure below, Figure 3.
The electrical resistivity for this type of geometry is determined by the following Equation:
 (13)
(13)
It may be observed in this model, that the resistivity or conductivity of the phases present are very simple to determine, because all values are experimentally known or easily measured, except F(d) which is a geometrical correction factor. However, this calculation is based on not very real assumptions, mainly in the current distribution in a heterogeneous medium. Bruggeman [16] presented a model which considers a contained volume in a uniform dielectric medium polarized, Figure 4, with an effective conductivity sm, which was reformulated and applied for inhomogeneous media by Garlnad and Tanner [17] .
The dipole moment associated with this volume is determined by the following equation:
 (14)
(14)
Em The dipole moment associated with this volume is determined by the following equation of electric displacement, we have:
 (15)
(15)
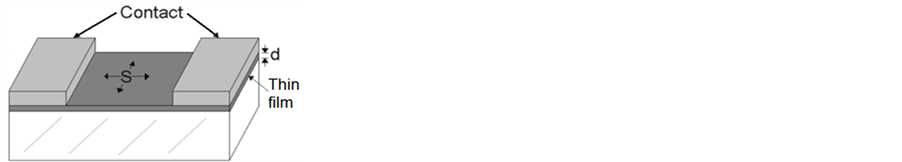
Figure 3. Planar geometry of the sample formfilm.
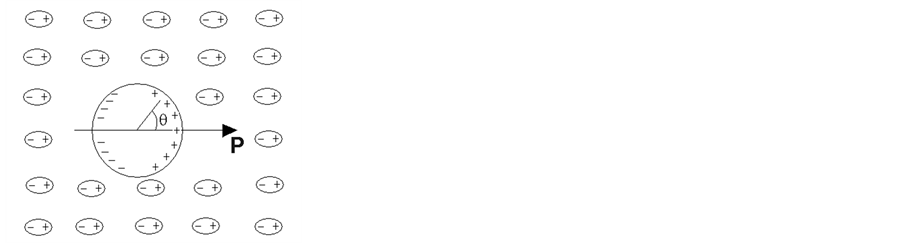
Figure 4. Lorentz sphere into a polarized dielectric.
nr is the number of regions per unit volume polarized, but distant points of the sphere have that the electric field approaches zero, then obtains; 
Substituting this value in Equation (14) and rearranging terms, is obtained:
 (16)
(16)
For the case of a two-phase system, Bruggeman [16] taking this Equation assumes that each phase comprising the region is symmetric. That is, the permittivity and the occupied volume correspond to the filling fraction of each phase, obtained:
 (17)
(17)
4. Experimental Development
As an experimental test of theory development exposed in the previous sections of this work, focuses on determining the kinetics of phase transformation of a binary alloy stoichiometry, consisting of Sb2Te3, because it is one of most studied materials for possessing peculiar characteristics, mainly in optical memory technology of de phase change.
The experimental work was developed in a “Work-Cell”, thermally and electrically isolated, and any other outside interference that could affect measurements of reflection and impedance of the sample, has a temperature control for isokinetic testing, as shown in the diagram of Figure 5.
The calculation of the crystallization kinetics of the material by impedance spectroscopy was performed in amorphous thin film of Sb2Te3 on glass, with gold contacts made by sputtering at room temperature, with a planar structure as shown in Figure 3, 1.5 mm is the distance between the contacts, 3.1 mm the width and 500 nm in thickness samples for which different tests were performed, all with very similar characteristics; the heating was done at a constant rate of temperature of 5˚C/min.
To determine the behavior of the resistivity as a function of temperature and time, it was used a “Cell four-probe”, which consists of four ohmic contacts equidistant collinear, as is seen in the schematic of Figure 6. The two outer tips are used for the passage of current and the other two internal tips are used to detect the induced voltage [13] .

Figure 5. Diagram of the Work-Cell.
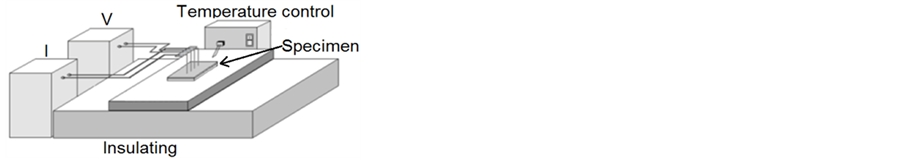
Figure 6. Diagram of cell four-probe.
This arrangement allows for data independently of the sample shape, including small resistivity regions in a matrix having different electrical properties, analysis of the electrostatic potential and the electric field distribution in the thin film, is easily calculated from values obtained experimentally, as the thin film thickness and geometrical dimensions of the sample.
5. Experimental Results
The following results show the optical and electrical behaviors of the Sb2Te3 as a function of temperature, where clearly a phase transition is observed, subsequently by X-Ray Diffraction results are corroborated these results.
In a isokinetic process, changes in the optical reflection of a sample are clearly observed in the representative graph of Figure 7, where in an optical reflection behavior typical low, caused by the presence of the initial amorphous phase, which is maintained until 70˚C, subsequently microstructural changes occur due to oxide present in the material and y and around 80˚C a sudden increase is generated in the optical reflection of the material, produced by the transition to the crystalline phase of the specimen.
Similarly heating tests were conducted with samples of Sb2Te3 by four point probe cell, to determine the resistivity of the specimen during the phase transition, at a heating constant rate of 5˚C/min, obtaining resistivity measurements versus temperature and time.
The electrical resistivity measurements are very sensitive to micro-structural changes of the material, as seen in Figure 8. It shows a slight decrease from room temperature to 70˚C, due to the presence of impurities in the amorphous phase of Sb2Te3 samples. Subsequently, a drastic decrease of 107 to 104 Ohms in the temperature range 70˚C to 90˚C, result of the phase transformation from amorphous to crystalline. Thereafter, the resistivity is almost constant.
The diffractograms of Figure 9 show the crystallization of the material, from the initial amorphous phase to the crystalline phase, corroborating the results obtained by optics reflection, and electrical resistivity of the material.
Formation of the crystalline structure is clearly observed: Trigonal-Hexagonal Scalenohedral pertaining to Sb2Te3 cristalline, are indicated by bars the position of the peaks associated with the structure, where it is seen that at temperatures above 130˚C, define more precisely the characteristic peaks of the material, this because the crystallization is produced, however, the high temperature conducive to the preferential crystallization along certain directions.
6. Crystallization Kinetics of Sb2Te3
To experimentally determine the phase transformation of the composite material of Sb2Te3, reflection

Figure 7. Reflection behavior of Sb2Te3.

Figure 8. Resistivity behavior of Sb2Te3.

Figure 9. DRX Espectra of Sb2Te3.
and impedance working cell were used , Figure 5, during isothermal heating runs using near the crystallization temperature of the material, that is: 60˚C, 65˚C and 68˚C.
Impedance spectra versus time obtained experimentally, are shown in the graphs of Figure 10, at a constant temperature of 65˚C. Each of these values were adjusted by the equivalent circuit of two phases in series, Figure 2, from which the resistance values were determined at different times at a given temperature and using Equation (13), the resistivity of the material was calculated during the process of crystallization and therefore the conductivity of the material.
With electrical conductivity calculated, we proceeded to determine the crystal volume fraction by Bruggeman symmetric model for two phases, Equation (17), and total crystalline phase was taken to 100˚C, based on approximate form, on what observed in the graphs of Figures 7-9.
The graph in Figure 11 shows the changes of the crystalline volume fraction versus time and clearly identifies: nucleation, growth and saturation time, during the phase transition of the sample.
The process for determining the volume fraction of crystalline carried out similarly for the other temperatures, 60˚C and 68˚C. Showing similar behavior to the already reported in the literature for Ohshima [11] , where in the transformation of amorphous-crystal phase, is initially done using a known nucleation incubation time or induction time, and starting from which the crystalline phase is increased continuously to produce overlap between regions transformed and so interfere in the growth of the new phase, until reaching the saturation phase.
The kinetic exponent of the phase transformation of Sb2Te3, is determined starting from the crystal volume fraction and the time, Equation (8), which are plotted and are adjusted, as shown in the graphs of Figure 12.
The kinetic exponent, calculated from a classical phase transformation behavior is linear, as it results in this sample of Sb2Te3 at different temperatures, the calculation of the average value is 2.03 ± 0.12. The effective energy calculated for the phase transformation of in the sample, is obtained from the Equation (5), differentiating with respect to (1/T):
 (18)
(18)
The graph below, Figure 13, shows the values obtained for each of the temperatures, whom are adjusted by a line function to determine the slope and simultaneously the effective energy of the crystallization process.
The value of the effective energy is: 4.2 ± 0.05 eV and the activation energy of describing the crystallization process is 2.06 ± 0.03 eV.
7. Conclusions
Crystallization kinetics, of the films of Sb2Te3 determined by the impedance spectroscopy techniques (IS), result in a value for the kinetic exponent of 2.03 ± 0.12 and an activation energy of 2.06 ± 0.03 eV, which correspond

Figure 10. Impedance spectra at 65˚C of Sb2Te3.

Figure 11. Crystalline volume fraction calculated using IS at 65˚C.
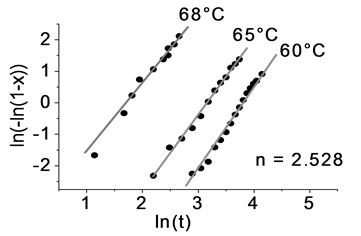
Figure 12. Kinetic exponent calculated by IS on Sb2Te3.
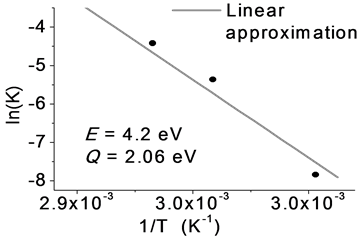
Figure 13. Activation energy of Sb2Te3 by the impedance technique.
to the classical theory, a controlled grain growth by atomic diffusion, with decrease in the generation of nucleation sites in the final stage of the process.
This method, unlike other models which is determined by the electric field but not by the mixture of material phases, which lead to problems of percolation effects, to increase the second phase within the initial phase continuous of the medium. However, an analysis of different models reported in literature [18] , clearly shows that when a dominant phases, approximately 70% of the total material, the models of Maxwell-Warner or Brailsford-Hohnke, describe perfectly the system, but in case that the percolation effects generated during the phase transformation, the Bruggeman model is the most appropriate one to describe the process, which is our case.
References
- Kolmogotov, A.A.N. (1937) A Statistical Theory for the Recrystallisation of Metals. Izvestiya Akademii Nauk SSSR, Neorganicheskie Materialy (Inorganic Materials (USSR)), 1, 355.
- Johnson, W.A. and Mehl, K.E. (1939) Reaction Kinetics in Processes of Nucleation and Growth. Transactions of the American Institute of Mining, Metallurgical and Petroleum Engineers, 195, 416.
- Avrami, M. (1939) Kinetics of Phase Change. Journal of Chemical Physics, 7, 1103. http://dx.doi.org/10.1063/1.1750380
- Yerofeev, B.V. (1946) Doklady Akademii Nauk SSSR, 52, 511.
- Chistian, J.W. (1975) The Theory of Transformations in Metals and Alloys. 2nd Edition, Pergamon Press, Oxford.
- Feinleib, J., deNeufville, J., Moss, S.C. and Ovshinsky, S.R. (1971) Rapid Reversible Light-Induced Crystallization of Amorphous Semiconductors. Applied Physics Letters, 18, 254-257. http://dx.doi.org/10.1063/1.1653653
- Ozawa, T. (1971) Kinetics of Non-Isothermal Crystallization. Polymer, 12, 150-158. http://dx.doi.org/10.1016/0032-3861(71)90041-3
- Borchardt, H.J. (1960) Initial Reaction Rates from DTA. Journal of Inorganic and Nuclear Chemistry, 12, 252. http://dx.doi.org/10.1016/0022-1902(60)80369-7
- Piloyan, G.O., Rybachikov, I.D. and Novikov, O.S. (1966) Determination of Activation Energies of Chemical Reactions by Differential Thermal Analysis. Nature, 212, 1229. http://dx.doi.org/10.1038/2121229a0
- Augis, J.A. and Bennett, J.E. (1978) Calculation of the Avrami Parameters for Heterogeneous Solid-State Reaction Using a Modification of the Kissinger Method. Journal of Thermal Analysis, 13, 283-292. http://dx.doi.org/10.1007/BF01912301
- Ohshima, N. (1996) Crystallization of Germanium-Antimony-Tellurium Amorphous Thin Film Sandwiched between Various Dielectric Protective Films. Journal of Applied Physics, 79, 8357-8363. http://dx.doi.org/10.1063/1.362548
- Mott, N.F. and Davis, E.A. (1979) Electronic Process in Non-Crystalline Materials. 2nd Edition, Clarenton Press, Oxford.
- Ohring, M. (1992) The Materials Science of Thin Films. Academic Press Inc., San Diego.
- Sze, S.M. (1981) Physics of Semiconductor Devices. 2nd Edition, John Wiley and Sons, Hoboken.
- Ross Macdonald, J. (1987) Impedance Spectroscopy. John Wiley and Sons, Hoboken.
- Bruggeman, D.A.G. (1935) Berechnung verschiedener physikalischer Konstanten von heterogenen Substanzen. I. Dielektrizitätskonstanten und Leitfähigkeiten der Mischkörper aus isotropen Substanzen. Annalen der Physik, 416, 636- 664.
- Garlnad, J.C. and Tanner, D.B. (1978) Electrical Transport and Optical Properties of Inhomogeneous Media. American Institute of Physics, New York.
NOTES

*Corresponding author.