New Journal of Glass and Ceramics
Vol.3 No.1(2013), Article ID:27347,5 pages DOI:10.4236/njgc.2013.31008
Difference in Structural Relaxation Times of Inner Surface and Inner Bulk Region of Silica Glass Arc Tube
![]()
1Protection & Material Engineering Department, Toshiba Lighting & Technology Corporation, ,Yokosuka, Japan; 2Research Center for Advanced Photon Technology, Toyota Technology Institute, Nagoya, Japan.
Email: *takuya.honma@tlt.co.jp
Received November 15th, 2012; revised December 15th, 2012; accepted December 25th, 2012
Keywords: Structural Relaxation Time; Fictive Temperature; High-Intensity Discharge Lamps
ABSTRACT
The fictive temperature and structural relaxation of a silica glass arc tube were investigated to elucidate the origin of cracking in the arc tubes used in high-intensity discharge lamps for vacuum ultraviolet light sources. The structural relaxation time near the inner surface was decreased much more than that in the inner bulk region, resulting in a large difference in the fictive temperature between these two areas at high-intensity discharge lamp operating temperatures. This difference should induce strain in the silica glass network. On the basis of our results, we suggest ways to avoid cracking and extend the lifetime of high-intensity discharge lamps.
1. Introduction
High-intensity discharge (HID) lamps made of silica glasses, as shown in Figure 1, are widely used as vacuum ultraviolet light sources. In recent years, as these lamps have achieved higher luminance, their arc tube operating temperature has also increased. Consequently, cracks occasionally develop in the inner surface of the arc tube, though the rate of the development of these cracks is low. Thus, a more thorough understanding of the origin of the cracking is required to prolong the lamp lifetime. One possible origin is that the fictive temperature (Tf) of the inner surface changes with the operating temperature and becomes different from that of the inner bulk region. Because the density of the glass depends on Tf, a large difference in Tf could induce strain near the inner surface, causing cracking [1-4]. At the operating temperatures (800˚C - 1000˚C) of arc tubes in HID lamps, little structural relaxation occurs in bulk silica glass. However, the structural relaxation time on the surface decreases more than that in the bulk, and the surface Tf can be decreased easily by thermal annealing. Furthermore, OH contamination of the surface during fabrication of the arc tube could dramatically enhance the structural relaxation near the surface [5].
The Tf of silica glass is easily estimated by measuring the absorption band of the asymmetric vibration of Si-O-Si, which is very sensitive to changes in the Si-O-Si bonding angle with changing Tf [6]. The value near the surface can be investigated using the infrared (IR) reflection peak at around 1120 cm−1 [7], whereas that in the inner bulk region can be investigated using the IR absorption peak at around 2260 cm−1 [6]. The structural relaxation time can thus be investigated by measuring the changes in the IR peak position during thermal annealing, which reveals the changes in Tf [3].
This paper uses this method to compare the structural relaxation times of the inner surface and inner bulk region of the silica glass arc tube in order to elucidate the origin of cracking in the arc tubes in HID lamps. It reports a correlation between the OH concentration and the structural relaxation, the Tf of the arc tube before and after arc tube processing, and the structural relaxation of the inner surface and inner bulk region of the arc tube.
2. Experimental Procedure
2.1. Sample Preparation
A silica glass arc tube was fabricated from a straight sil-
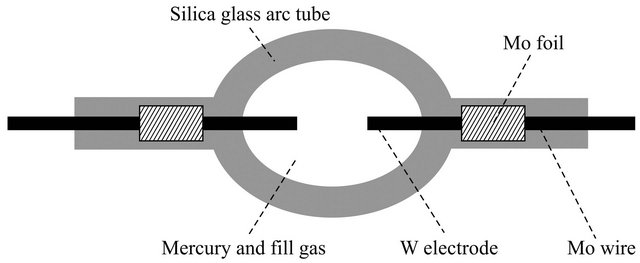
Figure 1. High-intensity discharge lamp.
ica glass tube (GE quartz, GE214). The straight tube was heated by an oxygen-hydrogen burner and expanded by controlling the flow of N2 gas inside of it, as shown in Figure 2.
Samples for the investigation of Tf and structural relaxation in the arc tube were prepared as follows. Samples for investigating the inner and outer surfaces were prepared by cutting 10 mm × 10 mm × 2 mm sections from the tubes (dark gray area in figure). Samples for investigating the inner bulk region were prepared by optical polishing of the cut surfaces to remove the hatched area shown in the figure. The final size of these samples was 10 mm × 10 mm × 0.5 mm. To investigate the depth profile of the OH concentration, 0.5 mm-thick rings were cut from the region of maximum tube diameter, and the cut surfaces were prepared by optical polishing. Samples for investigating the straight tube were also prepared by the same fabrication process. The samples for investigating the inner and outer surfaces were 10 mm × 10 mm × 3 mm in size; those of the inner bulk region were 10 mm × 10 mm × 0.5 mm in size, and those used to measure the depth profile of OH concentration were 0.5 mm thick.
2.2. Characterizations
The depth profile of the OH concentration was measured by a microscopic Fourier transform infrared spectrophotometer (mFT-IR) (PerkinElmer, Spectrum 2000) with a 100 μm × 100 μm aperture in transmission mode. The IR spot was scanned at intervals of 100 μm from the inner surface to the outer surface of each sample. The OH concentration was calculated from the peak intensity of the absorption peak at around 3667 cm−1 using an absorption coefficient of 77.5 L/(mol∙cm).
Tf near the surface was determined by measuring the IR reflection peak at around 1120 cm−1 for an area of 150 μm × 150 μm at a resolution of ±10−2 cm−1 [7]. The penetration depth of the IR spot was about 100 nm. Tf was calculated from the IR peak position using the following relation [7,8]:
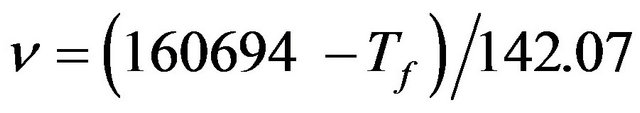 (1)
(1)
In the inner bulk region, Tf can be measured using the IR absorption peak at around 2260 cm−1 [6]. A measuring spot 5 mm in diameter was used. Tf was determined using [6,7]:
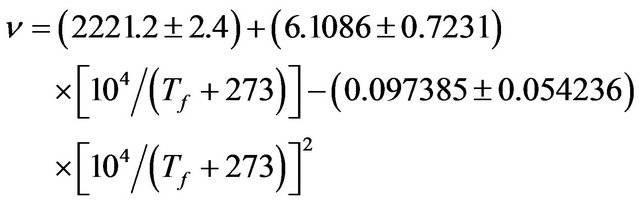 (2)
(2)
Structural relaxation in the samples was investigated in two ways. First, the arc tube was annealed for 2 h at temperatures ranging from 800˚C to 1300˚C in 50˚C steps. The annealed sample was then quenched in water, and the change in Tf was determined by the IR method described above. Second, the strict structural relaxation time was investigated by determining the change in Tf during thermal annealing [3]. Thermal annealing, quenching, and IR peak measurement were repeated at a fixed temperature between 800˚C and 1300˚C. Measurements continued until a change in Tf was observed [3]. To determine the activation energy of the inner surface and inner bulk region, the structural relaxation time was investigated by measuring the change in Tf during thermal annealing. The relaxation behavior can be represented by the stretched exponential function [5],
 (3)
(3)
where Ta is the annealing temperature, t is the annealing time, τ is the structural relaxation time, and β is the stretched exponential factor. The relaxation time τ was derived by fitting the data according to Equation (3). The activation energy Ea of the structural relaxation was calculated by
 (4)
(4)
where kB is the Boltzmann constant [3].
3. Results
3.1. Depth Profile of the OH Concentration
Figure 3 shows the OH concentrations for the straight tube and the arc tube. Differences in the OH concentrations can be seen near the surfaces of both samples. OH contamination of the arc tube occurred mainly on the outer surface because the oxygen-hydrogen burner was in direct contact with this surface during fabrication [5]. Consequently, the OH concentration on this surface was quite high, ~100 ppm, and the OH contamination penetrated to ~500 µm below the surface. The OH concentration of the arc tube also increased on the inner surface, although this was not in direct contact with the burner. The OH concentration on this surface, around 15 ppm, was not as high as that on the outer surface but could enhance the structural relaxation around the inner surface area.
3.2. Fictive Temperature
The measured Tf values for the straight tube and the arc tube are shown in Figure 4. These values were lower for the inner and outer surfaces than for the inner bulk region in both tubes.
3.3. Structural Relaxation
Figure 5 shows Tf as a function of the annealing temperature of the arc tube. At temperatures below 900˚C, Tf
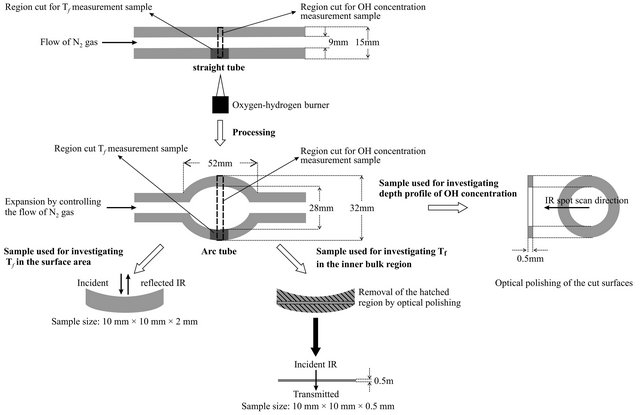
Figure 2. Arc tube processing and sample preparation.
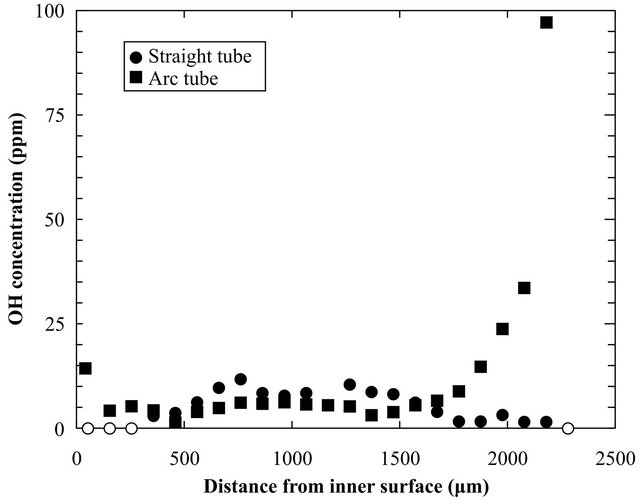
Figure 3. Depth profile of the OH concentration in the straight tube and the arc tube.
in the inner bulk region was almost the same as that before annealing, approximately 1380˚C, indicating that little structural relaxation occurred. In contrast, the structure on the inner surface was almost completely relaxed even after annealing at 900˚C. Consequently, the difference in Tf between the inner surface and the inner bulk region was more than 400˚C.
As described in Section 2.2, to determine the activation

Figure 4. Tf of the straight tube and the arc tube.
energy of the inner surface and inner bulk region, the structural relaxation time was investigated by measuring the change in Tf during thermal annealing. Figure 6 shows an example of the results for an annealing temperature of 1150˚C. The structural relaxation time of the inner surface has clearly decreased more than that of the inner bulk region. Figure 7 presents the structural relaxation times of the inner surface and inner bulk region. The estimated activation energies were 1.63 eV and 6.54 eV for the inner surface and inner bulk region, respecttively.
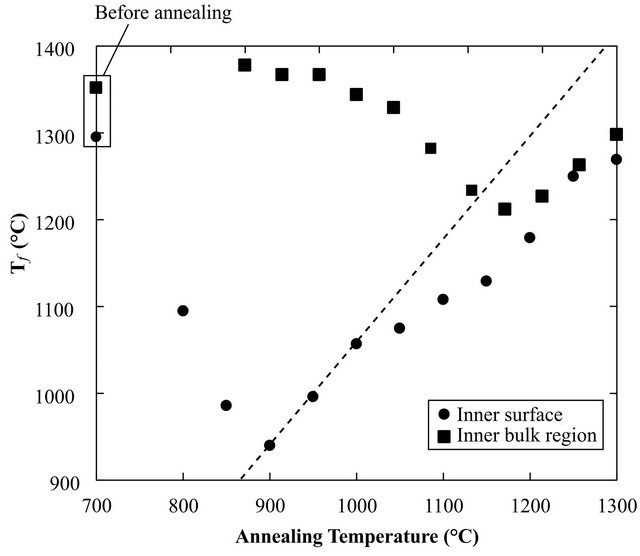
Figure 5. Tf of the inner surface and the inner bulb region before and after annealing. The dashed line shows the complete structural relaxed condition.

Figure 6. Relaxation processes of the inner surface and the inner bulb region. The annealing temperature was 1150˚C.
4. Discussion
Because the density of the glass depends on Tf, the large Tf difference described in Section 3 could induce strain near the inner surface of the arc tube [1,2]. It is known that structural relaxation occurs more rapidly on the surface than in the bulk and that hydroxyl groups influence this process. The OH concentration of ~15 ppm on the inner surface obtained by analyzing the depth profile of OH concentration (Figure 3) is expected to decrease the structural relaxation time there. Despite the use of N2 gas during the fabrication of the arc tube, OH contamination clearly occurred at the inner surface. It shows that the relatively less concentration of OH in N2 gas influenced the large Tf difference between the inner surface and the bulk [5].

Figure 7. Arrhenius plot of structural relaxation times of the inner surface and inner bulb region.
In addition to the strain caused by the Tf difference, other phenomena can also contribute to cracking; for example, UV light irradiation is well known to generate various defects in the silica glass network, which is accelerated at the strained Si-O-Si bonds [8-11]. In this study, we have not investigated the relationship between the fictive temperature and UV-light-induced defect formation. However, it may be possible to suppress cracking in the arc tubes in HID lamps because the strain (i.e, the strained Si-O-Si bonds) near the inner surface decreases by minimizing the OH contamination on the inner surface and decreasing the difference between the structural relaxation times of the inner surface and inner bulk region.
5. Summary
The fictive temperature and structural relaxation of a silica glass arc tube were investigated to elucidate the origin of cracking occurring in the arc tubes in HID lamps for vacuum ultraviolet light sources. The results indicated that OH contamination enhances structural relaxation near the inner surface of the arc tube. Moreover, at the operating temperatures of arc tubes in HID lamps (800˚C - 1000˚C), large differences in Tf between the inner surface and the inner bulk region can easily occur. These differences arise because the structural relaxation time near the inner surface decreases much more than that in the inner bulk region. The large difference in Tf can induce strain in the silica glass network. This is one possible origin of the cracking. Avoiding OH contamination of the surface and decreasing the difference in the structural relaxation times of these regions is effective for suppressing this source of cracking.
REFERENCES
- H. Kakiuchida, K. Saito and A. J. Ikushima, “FictiveTemperature Dependence of Structural Relaxation in Silica Glass,” Journal of Applied Physics, Vol. 94, No. 3, 2003, pp. 1705-1708. doi:10.1063/1.1587252
- R. Le Parc, B. Champagnon, P. Guenot and S. Dubois, “Thermal Annealing and Density Fluctuation in Silica Glass,” Journal of Non-Crystalline Solids, Vol. 293-295, No. 1-2, 2001, pp. 366-369. doi:10.1016/S0022-3093(01)00835-3
- K. Saito, N. Ogawa, A. J. Ikushima, Y. Tsurita and K. Yamahara, “Effects of Aluminum Impurity on the Structural Relaxation in Silica Glass,” Journal of Non-Crystalline Solids, Vol. 270, No. 1-3, 2000, pp. 60-65. doi:10.1016/S0022-3093(00)00057-0
- H. Kakiuchida, K. Saito and A. J. Ikushima, “Local Structural Relaxation around OH in Silica Glass,” Japanese Journal of Applied Physics, Vol. 41, No. 5A, 2002, pp. 2993-2998. doi:10.1143/JJAP.41.2993
- N. Kuzuu, Y. Kokubo, T. Nishimura, I. Serizawa, L. H. Zeng, K. Fujii, M. Yamaguchi, K. Saito and A. J. Ikushima, “Structural Change of OH-Free Fused Quartz Tube by Blowing with Hydrogen-Oxygen Flame,” Journal of Non-Crystalline Solids, Vol. 333, No. 2, 2004, pp. 115-123. doi:10.1016/j.jnoncrysol.2003.10.004
- H. Kakiuchida, K. Saito and A. J. Ikushima, “Precise Determination of Fictive Temperature of Silica Glass by Infrared Absorption Spectrum,” Journal of Applied Physics, Vol. 93, No. 1, 2003, pp. 777-779. doi:10.1063/1.1527206
- A. Agarwal, K. M. Davis and M. Tomozawa, “A Simple IR Spectroscopic Method for Determining Fictive Temperature of Silica Glasses,” Journal of Non-Crystalline Solids, Vol. 185, No. 1, 1995, pp. 191-198. doi:10.1016/0022-3093(94)00676-8
- Y. Ikuta, S. Kikugawa, K. Hino, T. Minematsu and H. Kojima, “Synthetic Silica Glass for Vacuum Ultraviolet Light,” Reports of the Research Laboratory, Vol. 53, 2003, pp. 31-35.
- A. Schreiber, B. Kühn, E. Arnold, F.-J. Schilling and H.-D. Witzke, “Radiation Resistance of Quartz Glass for VUV Discharge Lamps,” Journal of Physics D: Applied Physics, Vol. 38, No. 17, 2005, pp. 3242-3250. doi:10.1088/0022-3727/38/17/S28
- K. Saito, A. J. Ikushima, T. Kotani and T. Miura, “Improvement of the Ultraviolet-Proof Property of Silica Glass Fibers for ArF Excimer-Laser Applications,” Optics Letters, Vol. 24, No. 23, 1999, pp. 1678-1680. doi:10.1364/OL.24.001678
- K. Saito and A. J. Ikushima, “Effects of Fluorine on Structure, Structural Relaxation, and Absorption Edge in Silica Glass,” Journal of Applied Physics, Vol. 91, No. 8, 2002, pp. 4886-4890.
NOTES
*Corresponding author.