Journal of Analytical Sciences, Methods and Instrumentation
Vol. 3 No. 2 (2013) , Article ID: 32861 , 6 pages DOI:10.4236/jasmi.2013.32015
Elasticity Mapping Analysis of Apical Cell Periphery Actin Structures of Normal Fibroblasts and Cervical Cancer Cells
![]()
Department of Mechanical Science and Bioengineering, Graduate School of Engineering Science, Osaka University, Osaka, Japan.
Email: takanori.kihara@gmail.com
Copyright © 2013 Takanori Kihara et al. This is an open access article distributed under the Creative Commons Attribution License, which permits unrestricted use, distribution, and reproduction in any medium, provided the original work is properly cited.
Received February 28th, 2013; revised March 31st, 2013; accepted April 30th, 2013
Keywords: Atomic Force Microscopy; Actin Cytoskeleton; Elasticity Mapping Analysis; Mechanical Structure
ABSTRACT
The cell mechanical features are largely regulated by actin cytokeleton. By analyzing the mechanical features, it is possible to evaluate the characteristics of the complicated actin cytoskeleton in diverse cell types. In this study, we examined the sub-membrane mechanical structures of normal fibroblasts TIG-1 cells, and cervical cancer Hela cells using local elasticity mapping method of atomic force microscope. Especially we aimed at clarifying the regulatory mechanisms of sub-membrane actin structures in these cells by activation of actomyosin formation using calyculin A. This technique revealed that TIG-1 and Hela cells bore clearly different sub-membrane mechanical structures. TIG-1 cells had aligned stiff filamentous structures, whereas Hela cells had crooked and relatively soft filaments. The surface stiffness of TIG-1 cells increased slightly by actomyosin formation due to stiffness increase of the aligned filamentous structures. On the other hand, the surface stiffness of Hela cells increased by actomyosin formation due to upregulation of the apical actin filaments. Therefore, the structural and regulatory differences of the apical actin filaments could be demonstrated by atomic force microscopy elasticity mapping analysis.
1. Introduction
The mechanical features of cells are unique indicators for cellular states and diseases. In mesenchymal stem cells, these features are attributed to their diverse characteristics and states [1,2]. Malignant cancer cells exhibit lower stiffness than the corresponding normal cells [3,4]. Thus, it is hoped that the cell mechanical features play significant roles in cell diagnosis and analysis.
There are several methods to measure the mechanical features of cells including micropipette aspiration [5], optical stretcher [6], and atomic force microscopy (AFM) [7]. These technologies measure the surface tension, stiffness, or deformation of cells wholly or locally in physiological conditions. The micropipette aspiration elucidates cell surface tension partially. The optical stretcher elucidates whole cell deformation and AFM measures the cell stiffness or viscoelasticity locally. Especially the spatial resolution of AFM measurements for cell mechanical features is outstanding compared to other methods [8-10]. AFM can investigate the mechanical properties of cell surface with high-sensitivity (~1 pN) and -spatial resolution (~1 nm) under physiological cell culture conditions based on the employed cantilever.
The mechanical features are largely attributable to the actin cytoskeleton [11-14]. Stress fibers are specific determinants of cell mechanics [15], and cortical actin has also been reported to promote cortical rigidity [16,17]. Dominant actin substructures differ by cell type as well as their subcellular localization. Thus, by analyzing the mechanical features of cells, it is possible to shed light on the characteristics of their intricate actin networks. Highly sensitive and spatially resolved AFM measurements are promising analytical methods for investigation of biological surfaces. The cortical rigidity of mitotic round cells is less than that of trypsinized round cells despite of similar cell morphology and optical-microscopy visible actin networks [18]. It is also known that the stiffness of the cleavage furrow region of cells in cytokinesis, which contains an actomyosin contractile ring, drastically increases [10].
The mechanical features are cell-type specific. Cancer and normal cells exhibit different mechanical features because of the difference of their optical-microscopy defined actin cytoskeleton structures [4,19]. Our previous study showed that the regulatory mechanisms for actin cytoskeleton structures are different in normal stromal and cancer cells [20]. We demonstrated that the mechanical responsiveness to actin-modifying agents was different between these cells. In particular, the mechanical responsiveness of cancer cells was relatively affected by calyculin A treatment but hardly affected in normal stromal cells. Calyculin A is a myosin light chain phosphatase inhibitor that activates actomyosin formation and enhances actin polymerization (Figure 1) [21]. Additionally, the cortical rigidity of Drosophila embryonic S2R+ cells was increased via accelerating cortical actin formation by calyculin A treatment [17]. However, it is unclear why and how actin cytoskeleton structures generate these variations. Because surface stiffness measurement by AFM is a highly sensitive method which can detect optical-microscopy invisible information about the maturation or strength of the actin cytoskeleton network near cell surface [18,20], in this study to clarify the actin cytoskeleton structures responsible for these variations in each cell type, we examined the surface mechanical structures of normal fibroblasts and cancer cells using local elasticity mapping method of AFM.
2. Materials and Methods
2.1. Materials
The pyramidal probe (SN-AF01S-NT; spring constant: 0.09 N/m) was purchased from Seiko Instruments Inc. (Tokyo, Japan). Human fetal lung normal fibroblast TIG-1 cells [22] and human cervical cancer Hela cells were obtained from Health Science Research Resources Bank (Osaka, Japan). Antibiotics were purchased from Sigma-Aldrich (St. Louis, MO). pEGFP-actin vector was purchased from Clontech (Mountain View, CA). Other reagents were purchased from Sigma-Aldrich, Wako Pure Chemical Industries Ltd. (Osaka, Japan), or Life Technologies Japan Ltd. (Tokyo, Japan).
2.2. Cell Culture
TIG-1 and Hela cells were maintained in DMEM containing 10% FBS and antibiotics (100 units/mL penicillin G, 100 μg/mL streptomycin sulfate, and 0.25 μg/mL amphotericin B). The culture medium was replaced three times a week. Cells adhered to the culture dishes were manipulated by AFM.
2.3. Transfection and Fluorescence Observation
TIG-1 and Hela cells were transfected with pEGFP-actin

Figure 1. Regulation pathway of actin filaments formation by calyculin A.
vector by electroporation (ECM399; BTX, Holliston, MA), as recommended by the manufacturer. The transfected cells were observed by confocal laser scanning microscopy (CLSM) (FV-1000; Olympus, Tokyo, Japan) using a 60× oil immersion lens (NA = 1.42). The images were obtained from the upper part of the cell at intervals of 30 sec after treatment with 0.1 nM of calyculin A.
2.4. AFM Measurements
TIG-1 and Hela cells were manipulated by AFM (Nanowizard 3; JPK Instruments AG, Berlin, Germany) at 37˚C. Combining the optical microscope (IX-71; Olympus) with AFM allows the probe to be placed on a particular region of the cell surface. In this study, the scanning area of the cell surface was set at 5.0 × 5.0 μm on the nuclear region. The scanning area was set to a grid of 128 pixels × 128 lines with a loading force of up to 0.5 nN at 93.75 μm/s. The cells were continuously scanned after calyculin A treatment. Each scanning round took about 12 min. The Young’s modulus of each pixel was calculated using the Hertz model [23]. Each force-distance curve was fitted using JPK data processing software (JPK instruments AG) as
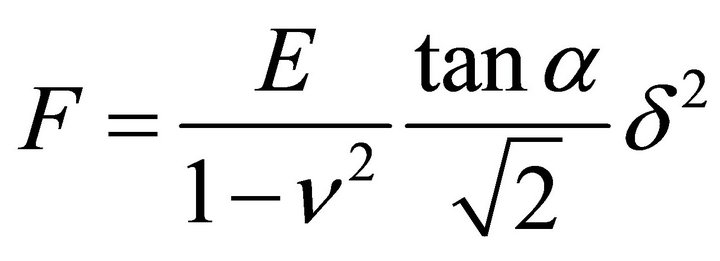 , (1)
, (1)
where F = force, δ = depth of the probe indentation, ν = Poisson’s ratio (0.5), α = half-angle to the face of the pyramidal probe (20˚), and E = Young’s modulus. More than 5 cells were used per experiment. The distribution of the Young’s modulus of each point was indicated with log scale [2,24].
3. Results and Discussion
3.1. Optical Microscopy Analysis of Actin Cytoskeleton of Cells Treated with Calyculin A
In this study, we used 2 types of cells: human TIG-1 fibroblasts and human cancer Hela cells. We previously demonstrated that the distribution of Young’s modulus and the mechanical responsiveness to calyculin A of these cells were different [20]. The Young’s modulus of TIG-1 cells slightly increased by calyculin A treatment, whereas that of Hela cells increased.
Firstly, we characterized these alterations by observing the reaction of the actin cytoskeleton of these cells to calyculin A. The cells were transfected with pEGFPactin vector by electroporation to force the EGFP-actin expression. In TIG-1 cells, EGFP-actin clearly localized in stress fibers, but in case of Hela cells distributed in cytoplasm (Figure 2). Then we time-lapse observed the alterations of apical actin structures in these cells during calyculin A treatment. Although it appeared that apical stress fibers of TIG-1 cells decreased a bit, calyculin A treatment did not cause any alterations in the actin cytoskeleton of these cells (Figure 2). Thus, it was difficult to define an alteration of actin cytoskeleton structures of these cells by optical microscopy.
3.2. Details of Mechanical Structures of TIG-1 and Hela Cells
We then determined the surface mechanical structures of these cells by the elasticity mapping method of AFM. The elasticity mapping method enables the visualization of those cell-periphery mechanical structures which are invisible by optical microscopy. In this study, in order to define the details of the mechanical structures of cell surface, we scanned a grid of 5.0 × 5.0 μm consisting of 128 pixels × 128 lines and scan resolution of 39.4 nm on the nuclear region of cell surface.
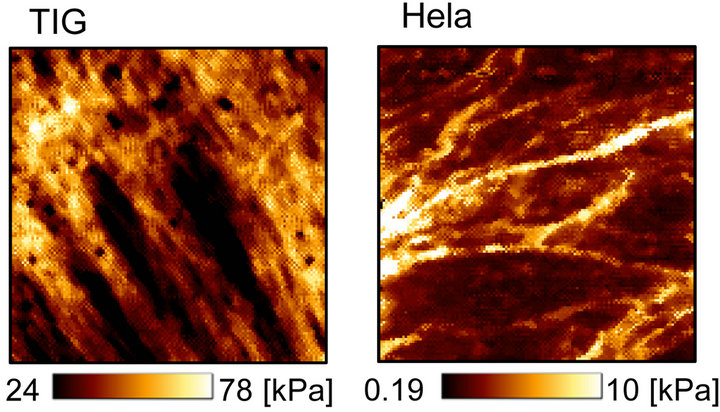
Figure 3(a) shows the sub-surface elasticity mapping images of TIG-1 and Hela cells. TIG-1 cell had many aligned stiff (>60 kPa) filamentous structures. On the other hand, Hela cell had some crooked filamentous structures whose stiffness was less than 10 kPa. The histogram of these elasticity data (Young’s modulus, E) are shown in Figure 3(b). The Young’s modulus was broadly distributed and followed a log-normal pattern as reported

Figure 2. CLSM images of EGFP-actin expressing TIG-1 and Hela cells during calyculin A treatment. Apical surface of these cells were continuously scanned by CLSM during calyculin A treatment at 37˚C. Time in each micrograph means incubation time with calyculin A. Bar: 40 μm.
 (a)
(a)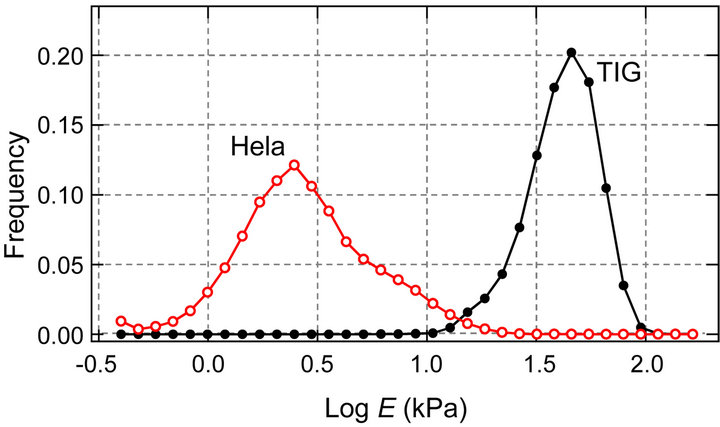 (b)
(b)
Figure 3. Apical surface stiffness of TIG-1 and Hela cells. (a) Elasticity mapping images of TIG-1 and Hela cells; (b) Histogram of the Young’s modulus values (E) of TIG-1 and Hela cells.
previously [2,24]. The distribution of the Young’s modulus of TIG-1 cell was clearly higher than that of Hela cell which is consistent with our previous study in which surface elasticity of these cells was examined by AFM using 40 cells for each cell type and 25 points measured in each cell [20]. The probe approaching speed to cell surface for the elasticity mapping was very high (93.75 μm/s) meaning that the probe was strongly affected by the cytoplasmic viscosity. However, since the distribution tendency of the Young’s modulus of cell surface was consistent with our previous study (probe approaching speed: 5.00 μm/s), the elasticity mapping data seemed reliable.
3.3. Alterations of Mechanical Structures of TIG-1 and Hela Cells by Treatment with Calyculin A
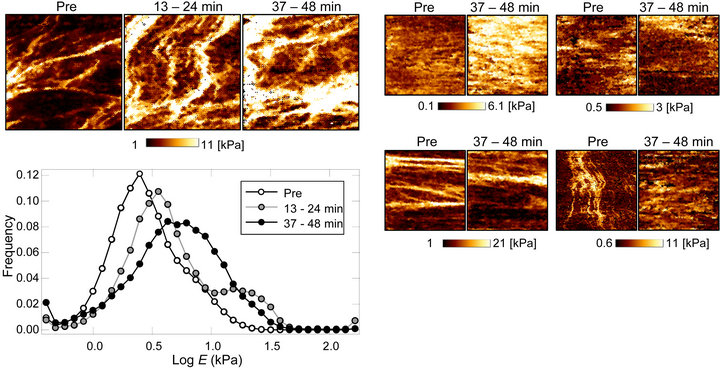
We next analyzed the alterations of the mechanical structures of TIG-1 and Hela cells by treating with calyculin A using the elasticity mapping method. To clarify the dynamics of the mechanical structures of the cell surface, we continuously scanned the cell surface by AFM after addition of 0.1 nM of calyculin A to culture media.
Figure 4(a) shows the time-lapse elasticity maps of calyculin A treated TIG-1 cells. The filamentous mechanical structures appeared to be almost unchanged. The histogram of the Young’s modulus of these mapping data showed that the surface stiffness slightly increased by calyculin A treatment. Then we compared the elasticity maps before and after (37 - 48 min) treatment with calyculin A in several TIG-1 cells (Figure 4(b)). The shape of the filamentous structures appeared almost the same, but the stiffness of the structures seemed to increase in some cells. Thus, it can be concluded that the surface stiffness of TIG-1 cells increased slightly by calyculin A due to stiffness increase of the aligned filamentous structures.
On the other hand, Figure 5(a) shows the time-lapse elasticity maps of calyculin A treated Hela cells. The amount and stiffness of the crooked filamentous structures apparently increased by treating with calyculin A. This trend was also confirmed by the histogram of the elasticity mapping data. The distribution of Young’s modulus was elevated over time. Figure 5(b) shows the comparison of the elasticity maps before and after (37 - 48 min) treatment with calyculin A in several Hela cells. The surface stiffness increased in some cells and there was little change in others by calyculin A treatment. Thus, the surface stiffness of Hela cells increased by calyculin A due to upregulation of the cell periphery mechanical structures.
4. Conclusion
Finally, we summarize our study and discuss about the mechanical structures of TIG-1 normal fibroblasts and Hela cancer cells. TIG-1 fibroblasts had many aligned filaments with high stiffness in vicinity of their apical surface. Inducing actomyosin formation in TIG-1 cells by treatment with calyculin A resulted in little rise in the stiffness of their apical surface due to increase of filaments stiffness. Thus, the aligned stiff filaments are assumed as apical actin stress fibers, whose stiffness in stromal cells is regulated by actomyosin activity (Figure 6). On the other hand, Hela cells had crooked elastic filaments in vicinity of their apical surface. Induction of actomyosin formation in Hela cells increased the stiffness of their apical surface due to upregulation of the surface filaments and structures. Thus, the crooked elastic filaments and surface structures are indeed actin fibers existing in apical space including cortical actin whose density and stiffness in cancer cells are regulated by actomyosin activity (Figure 6). The difference in structures and regulations of actin filaments existing in cell’s apical region cannot be observed by optical microscopy but can be demonstrated by AFM measurements. Therefore, elasticity mapping analysis and AFM measurements in general are very useful technologies to reveal the invisible information about the structures and regulatory mechanisms of actin cytoskeleton in vicinity of cell surface.
5. Acknowledgements
This work was supported by a Grant-in-Aid for Scientific Research on Innovative Areas “Nanomedicine Molecular
 (a) (b)
Figure 4. Time-lapse elasticity mapping analysis of TIG-1 cells during calyculin A treatment. (a) Transition of the elasticity maps and Young’s modulus distribution of calyculin A treated TIG-1 cells; (b) Alterations of elasticity maps of TIG-1 cells before (Pre) and after (37 - 48 min) calyculin A treatment.
 (a) (b)
Figure 5. Time-lapse elasticity mapping analysis of Hela cells during calyculin A treatment. (a) Transition of the elasticity maps and Young’s modulus distribution of calyculin A treated Hela cells; (b) Alterations of elasticity maps of Hela cells before (Pre) and after (37 - 48 min) calyculin A treatment.
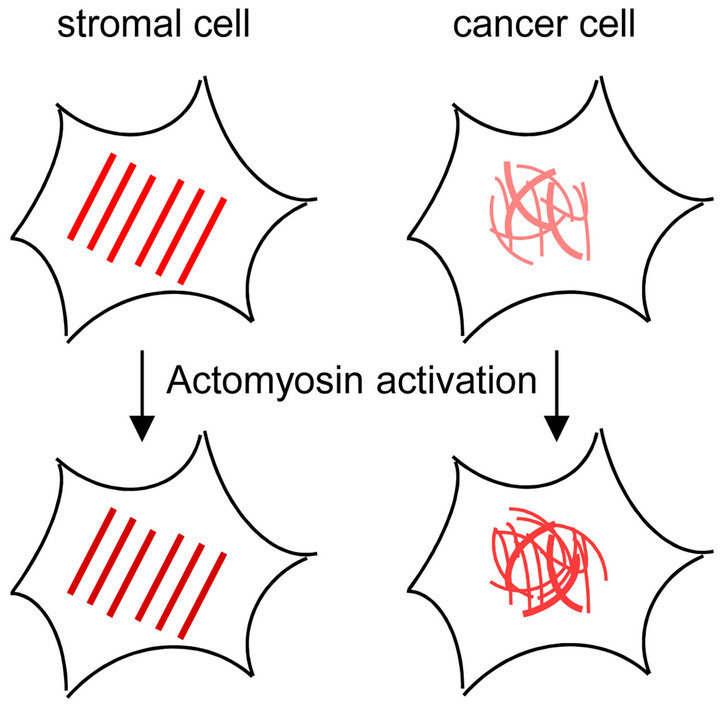
Figure 6. Diagrams of apical actin filaments of stromal and cancer cells. Red lines indicate actin filaments. Stromal cell has aligned stiff actin stress fibers in their apical region, and actomyosin regulates the stiffness of the stress fibers. On the other hand, cancer cell has crooked elastic actin fibers in the apical region, and actomyosin formation upregulates the actin fibers of the cell surface.
Science” (No. 2306) from the Ministry of Education, Culture, Sports, Science, and Technology of Japan.
REFERENCES
- J. M. Maloney, D. Nikova, F. Lautenschlager, E. Clarke, R. Langer, J. Guck and K. J. Van Vliet, “Mesenchymal Stem Cell Mechanics from the Attached to the Suspended State,” Biophysical Journal, Vol. 99, No. 8, 2010, pp. 2479-2487. doi:10.1016/j.bpj.2010.08.052
- T. Kihara, S. M. Haghparast, Y. Shimizu, S. Yuba and J. Miyake, “Physical Properties of Mesenchymal Stem Cells Are Coordinated by the Perinuclear Actin Cap,” Biochemical and Biophysical Research Communications, Vol. 409, No. 1, 2011, pp. 1-6. doi:10.1016/j.bbrc.2011.04.022
- S. Suresh, J. Spatz, J. P. Mills, A. Micoulet, M. Dao, C. T. Lim, M. Beil and T. Seufferlein, “Connections between Single-Cell Biomechanics and Human Disease States: Gastrointestinal Cancer and Malaria,” Acta Biomaterialia, Vol. 1, No. 1, 2005, pp. 15-30. doi:10.1016/j.actbio.2004.09.001
- S. E. Cross, Y. S. Jin, J. Rao and J. K. Gimzewski, “Nanomechanical Analysis of Cells from Cancer Patients,” Nature Nanotechnology, Vol. 2, No. 12, 2007, pp. 780-783. doi:10.1038/nnano.2007.388
- E. Evans and A. Yeung, “Apparent Viscosity and Cortical Tension of Blood Granulocytes Determined by Micropipet Aspiration,” Biophysical Journal, Vol. 56, No. 1, 1989, pp. 151-160. doi:10.1016/S0006-3495(89)82660-8
- J. Guck, R. Ananthakrishnan, T. J. Moon, C. C. Cunningham and J. Kas, “Optical Deformability of Soft Biological Dielectrics,” Physical Review Letters, Vol. 84, No. 23, 2000, pp. 5451-5454. doi:10.1103/PhysRevLett.84.5451
- M. Radmacher, M. Fritz, C. M. Kacher, J. P. Cleveland and P. K. Hansma, “Measuring the Viscoelastic Properties of Human Platelets with the Atomic Force Microscope,” Biophysical Journal, Vol. 70, No. 1, 1996, pp. 556-567. doi:10.1016/S0006-3495(96)79602-9
- C. Rotsch, F. Braet, E. Wisse and M. Radmacher, “AFM Imaging and Elasticity Measurements on Living Rat Liver Macrophages,” Cell Biology International, Vol. 21, No. 11, 1997, pp. 685-696. doi:10.1006/cbir.1997.0213
- H. Haga, S. Sasaki, K. Kawabata, E. Ito, T. Ushiki and T. Sambongi, “Elasticity Mapping of Living Fibroblasts by AFM and Immunofluorescence Observation of the Cytoskeleton,” Ultramicroscopy, Vol. 82, No. 1-4, 2000, pp. 253-258. doi:10.1016/S0304-3991(99)00157-6
- R. Matzke, K. Jacobson and M. Radmacher, “Direct, High-Resolution Measurement of Furrow Stiffening during Division of Adherent Cells,” Nature Cell Biology, Vol. 3, No. 6, 2001, pp. 607-610. doi:10.1038/35078583
- J. Dai and M. P. Sheetz, “Mechanical Properties of Neuronal Growth Cone Membranes Studied by Tether Formation with Laser Optical Tweezers,” Biophysical Journal, Vol. 68, No. 3, 1995, pp. 988-996. doi:10.1016/S0006-3495(95)80274-2
- N. Wang, “Mechanical Interactions among Cytoskeletal Filaments,” Hypertension, Vol. 32, No. 1, 1998, pp. 162- 165. doi:10.1161/01.HYP.32.1.162
- W. R. Trickey, T. P. Vail and F. Guilak, “The Role of the Cytoskeleton in the Viscoelastic Properties of Human Articular Chondrocytes,” Journal of Orthopaedic Research, Vol. 22, No. 1, 2004, pp. 131-139. doi:10.1016/S0736-0266(03)0150-5
- T. Sugitate, T. Kihara, X.-Y. Liu and J. Miyake, “Mechanical Role of the Nucleus in a Cell in Terms of Elastic Modulus,” Current Applied Physics, Vol. 9, No. 4, 2009, pp. e291-e293. doi:10.1016/j.cap.2009.06.020
- L. Lu, S. J. Oswald, H. Ngu and F. C. Yin, “Mechanical Properties of Actin Stress Fibers in Living Cells,” Biophysical Journal, Vol. 95, No. 12, 2008, pp. 6060-6071. doi:10.1529/biophysj.108.133462
- A. S. Maddox and K. Burridge, “RhoA Is Required for Cortical Retraction and Rigidity during Mitotic Cell Rounding,” The Journal of Cell Biology, Vol. 160, No. 2, 2003, pp. 255-265. doi:10.1083/jcb.200207130
- P. Kunda, A. E. Pelling, T. Liu and B. Baum, “Moesin Controls Cortical Rigidity, Cell Rounding, and Spindle Morphogenesis during Mitosis,” Current Biology, Vol. 18, No. 2, 2008, pp. 91-101. doi:10.1016/j.cub.2007.12.051
- Y. Shimizu, S. M. Haghparast, T. Kihara and J. Miyake, “Cortical Rigidity of Round Cells in Mitotic Phase and Suspended State,” Micron, Vol. 43, No. 12, 2012, pp. 1246-1251. doi:10.1016/j.micron.2012.03.011
- M. Lekka, K. Pogoda, J. Gostek, O. Klymenko, S. Prauzner-Bechcicki, J. Wiltowska-Zuber, J. Jaczewska, J. Lekki and Z. Stachura, “Cancer Cell Recognition—Mechanical Phenotype,” Micron, Vol. 43, No. 12, 2012, pp. 1259-1266. doi:10.1016/j.micron.2012.01.019
- S. M. A. Haghparast, T. Kihara, Y. Shimizu, S. Yuba and J. Miyake, “Actin-Based Biomechanical Features of Suspended Normal and Cancer Cells,” Journal of Bioscience and Bioengineering, 2013 (in press). doi:10.1016/j.jbiosc.2013.03.003
- H. Ishihara, H. Ozaki, K. Sato, M. Hori, H. Karaki, S. Watabe, Y. Kato, N. Fusetani, K. Hashimoto and D. Uemura, “Calcium-Independent Activation of Contractile Apparatus in Smooth Muscle by Calyculin-A,” Journal of Pharmacology and Experimental Therapeutics, Vol. 250, No. 1, 1989, pp. 388-396.
- M. Ohashi, S. Aizawa, H. Ooka, T. Ohsawa, K. Kaji, H. Kondo, T. Kobayashi, T. Noumura, M. Matsuo, Y. Mitsui, S. Murota, K. Yamamoto, H. Ito, H. Shimada and T. Utakoji, “A New Human Diploid Cell Strain, TIG-1, for the Research on Cellular Aging,” Experimental Gerontology, Vol. 15, No. 2, 1980, pp. 121-133. doi:10.1016/0531-5565(80)90083-2
- H. Hertz, “Über die Berührung Fester Elastischer Körper,” Journal für die Reine und Angewandte Mathematik, Vol. 92, No. 1881, pp. 156-171.
- Y. Shimizu, T. Kihara, S. M. Haghparast, S. Yuba and J. Miyake, “Simple Display System of Mechanical Properties of Cells and Their Dispersion,” PLoS ONE, Vol. 7, No. 3, 2012, Article ID: e34305. doi:10.1371/journal.pone.0034305