Journal of Analytical Sciences, Methods and Instrumentation
Vol.2 No.3(2012), Article ID:23289,4 pages DOI:10.4236/jasmi.2012.23027
Adsorptive Removal of Antimony (III) Using Modified Montmorillonite: A Study on Sorption Kinetics
![]()
Department of Chemistry, University of Delhi, Delhi, India.
Email: *monikadatta_chem@yahoo.co.in
Received January 22nd, 2012; revised February 17th, 2012; accepted March 1st, 2012
Keywords: Adsorption; Antimony (III); Montmorillonite; Modified MMT
ABSTRACT
The adsorptive removal of antimony (III) has been successfully obtained on montmorillonite (MMT) and modified MMT from synthetic solution. The adsorption behavior of the modified and unmodified MMT has been investigated as a function of initial concentration of metal ion in the solution, pH of the solution and contact time using a batch extraction process. The optimized process can be applied for the adsorption, detection and estimation of antimony from 0.006 µg/ml (6.0 ppb) to 100.00 µg/ml (100.0 ppm) in aqueous solution. It has been observed that almost 99% of antimony (III) can be successfully extracted from a solution containing 100 µg/ml of the metal ion at pH 6.0 at 25˚C ± 2˚C. The investigation of the kinetics of sorption of antimony (III) on MMT/modified MMTshows intraparticle diffusion to be the rate limiting step during the initial stages of adsorption followed by chemisorption.
1. Introduction
The metals of major environmental concern in the present day world are arsenic, cadmium, antimony, chromium, cobalt, copper, lead, manganese, mercury, nickel and zinc, etc. Antimony hasbeen considered as one of the toxic and carcinogenic metal [1]. Antimony and its compounds are considered as pollutants of priority interest by the Environmental Protection Agency of the United States (USEPA, 1979) and the European Union Council of the European Communities (1976). The maximum admissible concentration of antimony established by the European Union in drinking water is 5 mg/l [2].
Antimony shares some toxicological properties with arsenic [3-5] and thus the contamination of natural water by the metal is a world-wide problem posing a challenge for the world scientists. Antimony can occur in a variety of oxidation states (–3, 0, +3, +5) but mainly exist in two oxidation states (+3 and +5) in environmental, biological and geochemical samples [6]. Antimony exists primarily as antimonate, Sb (V), in oxic systems and antimonite, Sb (III), in anoxic systems [7]. Of both the forms Sb (III) is known to be more toxic than Sb (V) and is predominant in ground waters. The trivalent specie is responsible for the mediation of its toxicological effects [8].
The International Agency for Research on Cancer (IARC) has reported adequate evidence for the carcinogenicity of antimony (III) in experimental animals. World production for antimony has been estimated as 165,000 tons antimony mine output that is considerably larger than arsenic [9]. Environmental enrichment of the metalloid occurs naturally in areas of geological mineralization and anthropogenically as well [10-13] although the majority of antimony contamination appears to originate from mining and industrial emission sources, often smelting [14].
Chronically hazardous, elevated exposures to antimony have been mostly caused by the intake of contaminated water [15-17]. The presence of antimony in natural water is due to leaching from the antimony containing rocks and sediments, thereby causing increased incidents of various kinds of cancer targetting skin, lung, liver, bladder and kidney, skin thickening (hyperkeratosis) neurological disorders, muscular weakness, loss of appetite and nausea [17-20].
The conventional analytical techniques reported for the removal of antimony from aqueous solution includes coagulation and flocculation, precipitation and ion exchange, ozone oxidation etc. Most of these methods involve production of highly contaminated sludge [21]; high maintenance cost and requires relatively expensive mineral adsorbents which offset performance and efficiency advantages. Adsorption utilizing biological materials, mineral oxides, aluminosilicates, activated carbon, polymer resins has generated increasing interest [22,23].
In the present work, montmorillonite (MMT, a class of Smectite clay mineral) has been selected as the host material for the removal of antimony (III) from aqueous solutions. MMT is known for its low cost, high surface area, high chemical stability, high sorption properties and rich intercalation chemistry.
The best detection limit reported so far for antimony (III) using bentonite accounts for 1.0 µg/ml [24]. We have been successful in devising an efficient and costeffective methodology based on the simple principle of adsorption for the removal of antimonite from aqueous solution with the competence of detecting and extracting Sb (III) from as low as 0.006 µg/ml, a concentration much lower than assigned by the European Union in drinking water (5.0 mg/l) whereas almost touching the maximum permissible limit assigned by World Health Organization (0.005 µg/ml).
2. Experimental
2.1. Materials and Methods
Montmorillonite (MMT-KSF) was obtained from Sigma Aldrich (USA). Cetylpyridinium chloride (CPC) and cetyl trimethylammonium bromide (CTAB) were obtained from Merck (Germany) and British Drug House (England) respectively. Potassium antimonyl tartarate was obtained from British Drug House (England), Sodium hydroxide; hydrochloric acid and potassium iodate were obtained from Qualingens (India). Leuco crystal violet (LCV) was obtained from Sigma Aldrich Pvt. Ltd. (Germany). The AR grade chemicals/reagents and double distilled water was used throughout the experiment.
2.2. Synthesis of Modified Montmorillonite
Surfactant modified clay (CPC-MMT and CTAB-MMT) were synthesized by the modification of the reported procedures [25].
5.0 g of MMT, (dried at 80˚C) was dispersed in 250 ml double distilled water and was allowed to stand for 24 hours to wash and allow the clay to swell. To this 1% aqueous surfactant (CPC and CTAB) solution was gradually added with constant stirring for 3 hours at 26˚C ± 2˚C at 1 atm. The clay suspension was separated by centrifugation and washed with double distilled water for the complete removal of unreacted surfactant. The residues thus obtained were dried at 80˚C and was labelled as CPC-MMT and CTAB-MMT.
2.3. Preparation of Antimony (III) Stock Solution
Sb (III) stock solution (1000 ppm) was prepared by dissolving 2.668 g of potassium antimonyltartarate in double distilled water and the volume of the solution was made up to 1liter in a standard volumetric flask.
2.4. Spectrophotometric Determination of Antimony (III)
The concentration of antimony was determined spectrophotometrically at 592 nm, using LCV (Leuco crystal violet) by the modification of reported procedure [26]. A linear calibration graph, absorbance vs. concentration of the crystal violet (CV) produced from the reaction of Sb (III) with LCV, which is directly proportional to the concentration of Sb (III) in solution is obtained. The concentration of Sb (III) in each unknown solution was calculated from the calibration curve. The reagent blank does not indicate any noticeable absorbance at the chosen wave length.
2.5. Batch Adsorption of Sb (III) on MMT and Modified MMT
The adsorption experiments were carried out using MMT and modified MMT (CPC-MMT and CTAB-MMT). The batch experiments were carried out using 0.1 g of the adsorbent with 50 ml of metal solution. Studies were performed as a function of concentration of metal in the solution, pH of the solution and contact time. The percentage of the metal adsorbed onto the adsorbent was calculated using the following expression
Amount of metal adsorbed (qe) was calculated from the following expression
where Ci was the initial concentration (mg/L), Ce was the final concentration of Sb (III) in the solution after equilibrium was attained (mg/L), V was the volume of the Sb (III) solution (l) and m was the mass of the adsorbent (g) used.
3. Results and Discussions
3.1. X-Ray Diffraction Analysis
In addition to adsorption onto external surface, intercalation also takes place in phyllosilicates as evident from the XRD analysis. The d(001) spacing of MMT, CTAB-MMT and CPC-MMT was found to be 1.2, 1.76 and 1.95 nm respectively (an increase, with respect to MMT, of 0.56 nm and 0.75 nm for CTAB-MMT and CPC-MMT respectively), as already reported in our previous work [27]. The results suggest CTAB and CPC attached strongly to MMT because of the higher van der Waals and electrostatic interactions with the negatively charged silicate layers [28].
3.2. Fourier-Transform Infrared Analysis
The infrared spectroscopic analysis of the modified montmorillonite is shown in Figure 1. An intense relatively broad hydroxyl-stretching band is observed at 3440 cm−1 in MMT combined with an intense, relatively sharp band is observed at 3629 cm−1 in the modified MMT (CTAB-MMT and CPC-MMT) that accounts for the presence of intermolecular hydrogen bonding.
The band at 3440 cm−1 is unaffected by the presence of the CTAB and CPC and is assigned to the OH-stretching vibration of the montmorillonite. The water in the montmorillonite interlayer is gradually displaced by the CTAB/CPC as their concentration increases.
The stretching vibration of the C-H bonds at 2854 cm−1 (sym. -CH2) and 2928 cm−1 (asym. -CH2–) in CTAB-MMT and CPC-MMT respectively are absent in MMT, thereby confirming the presence of the organic moiety onto the modified clay surface [29].
The adsorption of surfactant causes Si-O bond polarization due to the positive charge on the silicate surface and thus the Si-O dipole moment and consequently the stretching band intensities increase in modified MMT. The excessive nonstoichiometric amount of CPC and CTAB results in high accumulation of the positive charge that provides the most intensive Si-O spectral bands.
Accordingly, the surfactant molecules of saturated modified MMT are assumed to be attached to the montmorillonite external face not only via the electrostatic forces related to the stoichiometric ion exchange but also due to interaction between aromatic nitrogen with the crystal edge or the other acidic site by the hydrophobic π-π interactions of two neighboring aromatic rings.
3.3. Effect of pH on Adsorption
The effect of pH on the amount of antimony adsorbed from the solution using MMT and modified MMT was investigated in the pH range of 1 - 12 (Figure 2). The percentage of Sb (III) adsorbed on MMT increases from 95.1% to 97.0% in the pH range of 1 - 6, and then decreased to 95.0% at pH 12. A similar behavior was observed for modified MMT where in 96.5% to 99.0% of Sb (III) is adsorbed using CTAB-MMT and 97.8% to 99.0% using CPC-MMT respectively.
Thus, the results indicate that more than 95.0% of Sb (III) can be successfully removed in the pH range 1 - 12, from aqueous solution thereby making it a pH independent process.
In highly acidic medium Sb (III) mainly exists in the form of neutral antimonous acid, H3SbO3 species that onsets dissociation with increasing pH to produce antimoniteions. Thus, the adsorption of Sb (III) on positively charged adsorbents increases and maximizes at pH 6.0. However, the extent of adsorption is much higher (>90%) on modified MMT due to the presence of higher positive charge density, as supported by the experimentally observed zeta values (zeta potential: MMT = 12.9 mV, CPC-MMT = 17.2 mV and CTAB-MMT = 21.6 mV). At pH > 8, the adsorbent surface gradually becomes less positive and hence, the interaction between the adsorbent and antemonite ions decreases leading to an insignificant decrease in Sb (III) uptake. The Sb (III) solutions were maintained at pH 6.0 for further investigations, that lies in the pH range of most of the drinking water available.
3.4. Effect of Contact Time on Adsorption
The extraction efficiency of antimony on MMT and modified MMT was investigated as a function of time, the pH of the solution was maintained at 6.0 (Figure 3). The percentage of Sb (III) efficiently absorbed extracted from its aqueous solution, using MMT marginally
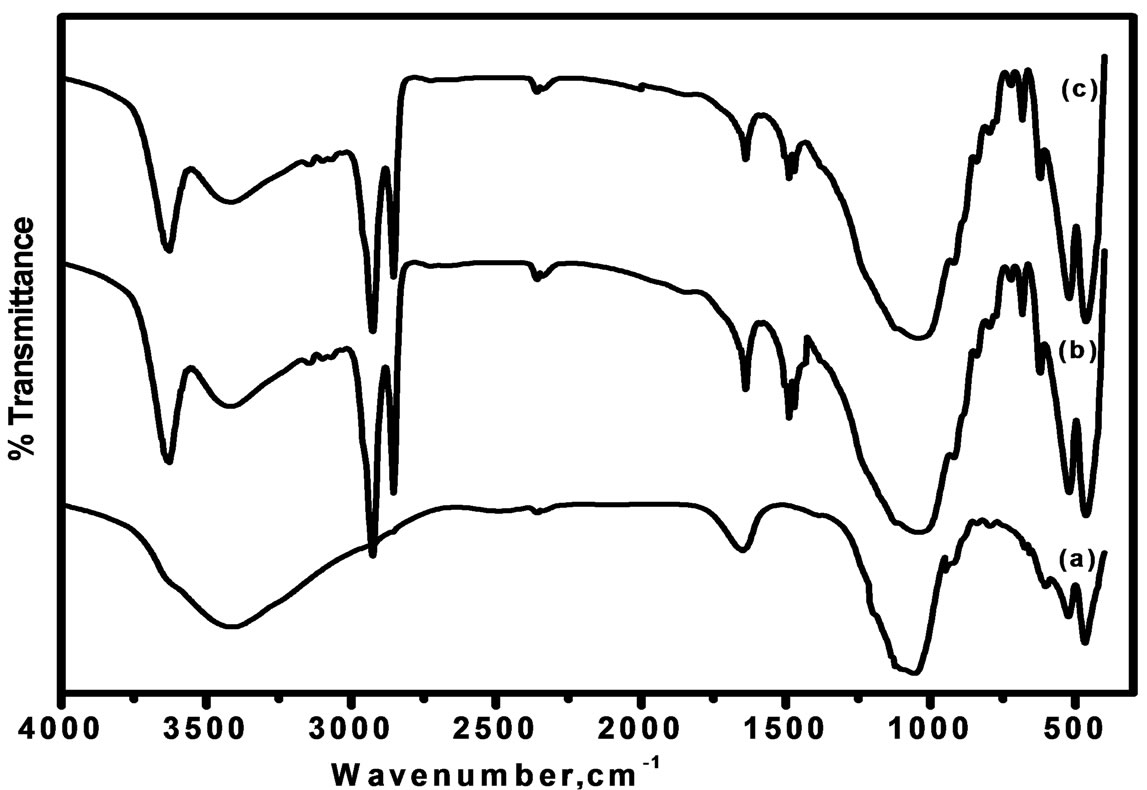
Figure 1. FT-IR spectra of (a) MMT (b) CTAB-MMT and (c) CPC-MMT.
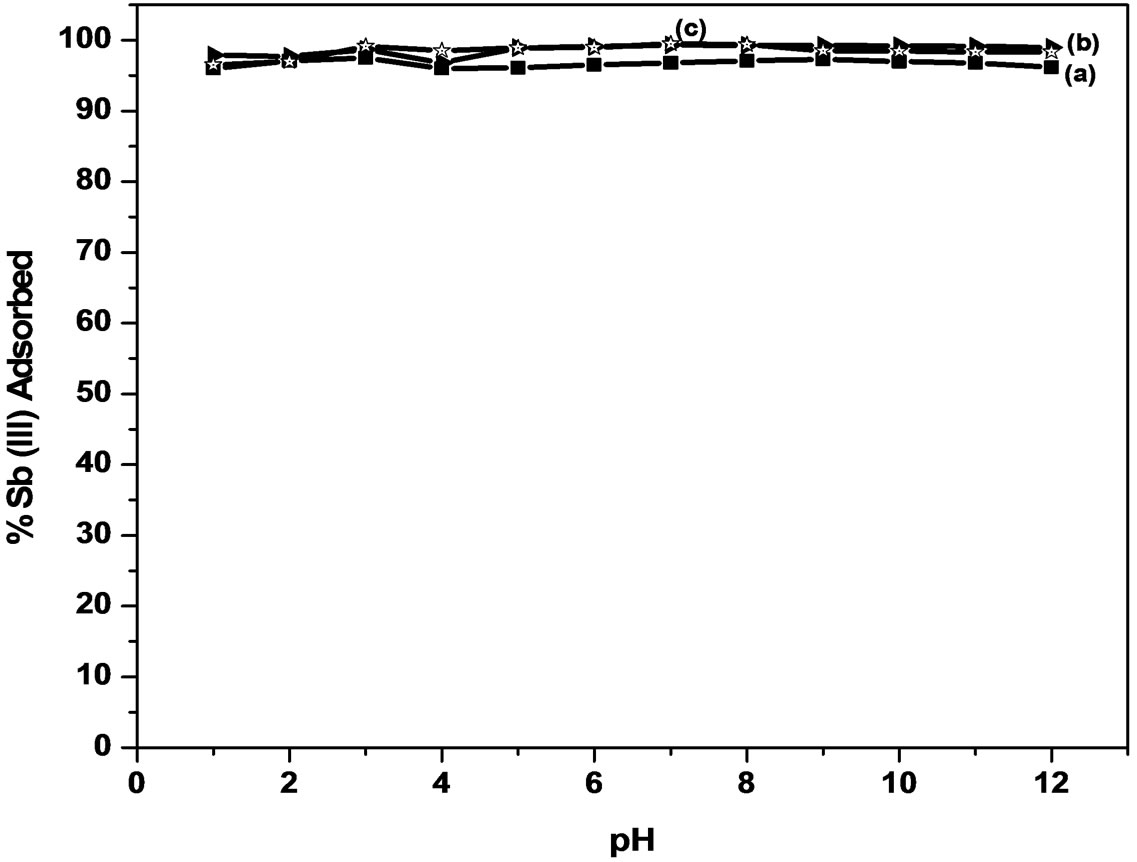
Figure 2. Effect of pH on Sb (III) adsorption.

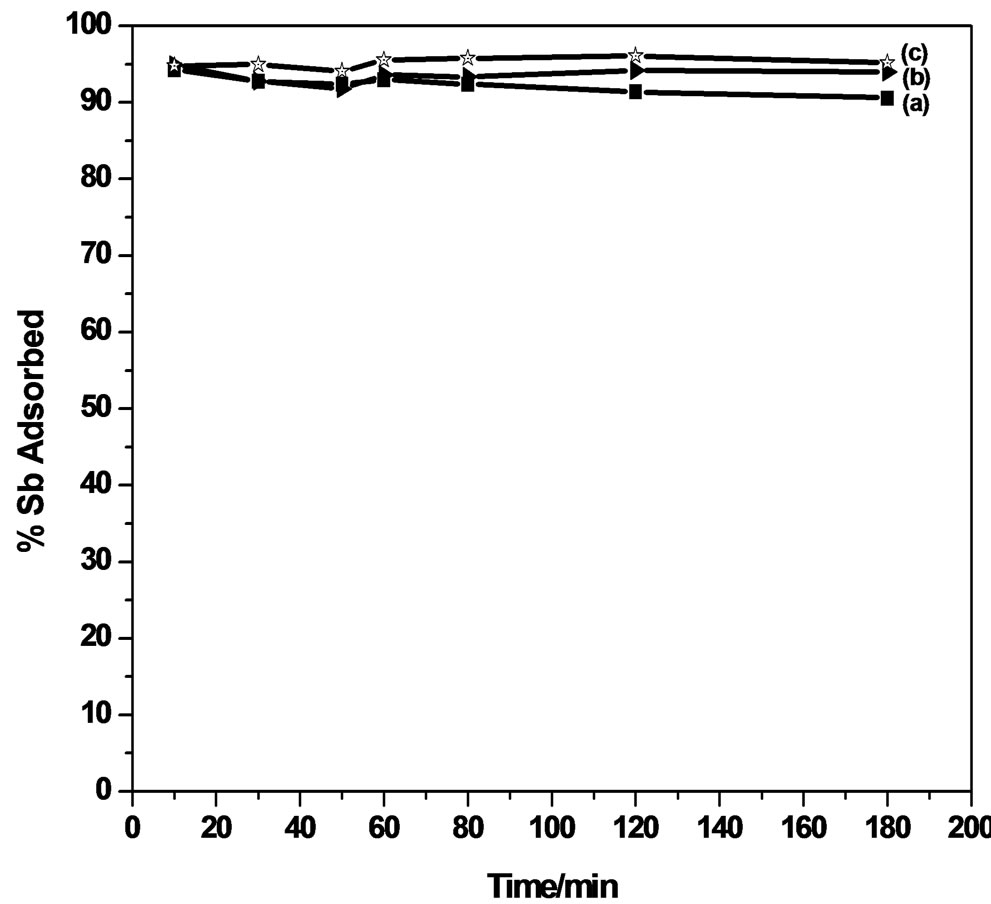
Figure 3. Effect of contact time on Sb (III) adsorption.
decreased from 94.9% during the contact time of 10 minutes to 93.6% during 60 minutes, and thereafter remains almost constant up to 180 minutes. CPC-MMT and CTAB-MMT shows an uptake of 98.0% during the initial 10 minutes and thereafter decreases to 95.0% during 180 minutes, at pH 6.0.
The adsorption of Sb (III) on MMT and modified MMT was found to follow a steep rise during the initial phase of the experiment. This could be due to the availability of a large number of adsorption sites on the adsorbent surface. Maximum adsorption of Sb (III) was observed in the time duration of 60 minutes and beyond this no further increase in adsorption was observed.
Taking into account an efficient adsorption of almost 90% - 99% of Sb (III) from the solution during the contact time of 10 minutes, using MMT and modified MMT, an attempt was made to investigate the minimized time required for the removal process, wherein the maximum extraction of 98.5% of antimonite from its aqueous solution was observed in 10 minutes, using CPC-MMT.
The results indicate an extraction of 94.5% of and 98.5% of Sb (III) using CTAB-MMT and CPC-MMT respectively. Thus, a minimum duration of almost 10 minutes is enough to make an efficient removal 95.0% - 99.0% Sb (III) of antimonite from an aqueous solution, using modified MMT. This time duration poses new horizons to the removal efficiency of antimonite wherein no such work has been reported so far, to the best of our knowledge.
3.5. Effect of initial Concentration of Metalion on Adsorption
The adsorption efficiency of the adsorbents used forthe removal of Sb (III) from an initial concentration of 0.01 - 100 µg/ml, using MMT and modified MMT was investigated.
An adsorption of 92.0% and 78.0% of Sb (III) from an initial concentration of 100 µg/ml and 10 µg/ml solution of antimonite respectively has been observed using unmodified MMT whereas modified MMT (CPC-MMT) shows 99.0% and 84.0% of Sb (III) adsorption from 100 µg/ml and 0.01 µg/ml solution of antimonite respectively (Figure 4).
An increase in Sb (III) adsorption on all the three adsorbents within the given concentration range indicates a heterogeneous system wherein the adsorption is not restricted to monolayer formation. The percentage of antimonite extracted by modified MMT was observed to be higher than that of the host clay. This increase in adsorption is due to the electrostatic attraction between the appreciable positively charged adsorbent (modified MMT) and the neutral as well as negatively charged antimonite.
3.6. Adsorption Isotherm
The sorption process considered in the present research work involves surfactant modified MMT as the solid phase and an aqueous phase containing dissolved antimony specie to be sorbed. Due to the higher affinity of the adsorbent for the ionic specie, it is attracted to bind to the solid/adsorbent. This process takes place until equilibrium between the amount of solid bound ions and their concentrations in solution is reached.
The surface heterogeneity and the exponential distribution of active sites and their energies is encompassed by the Freundlich isotherm. It is one of the widely used mathematical descriptions that fits the experimental data over a wide range of concentrations and describes a heterogeneous system and reversible adsorption process that is not restricted to monolayer formation. The linear form of the above equation is given as:

where Kf is the Freundlich constant (mg/g) and 1/n is the heterogeneity factor. A plot of logqe and logCe gives a straight line and the values of Kf and n can be calculated from the intercept and slope of the plots respectively.
This model predicts that adsorption of antimonite on the adsorbents increases with increase in metal concentration in the solution.
The antimonite adsorption onto the adsorbents follow the linear fit of the equation thereby suggesting the best fit for the Freundlich isotherm and the heterogeneity of the system as shown in Figure 5. The linear equations obtained were logqe = 1.7268 logCe + 2.4079 for MMT, logqe = 0.0023 logCe + 0.763 and logqe = 1.7128 logCe + 2.640 for CTAB-MMT and CPC-MMT respectively and the regression coefficient (R2) was found to be 0.987 for MMT, 0.830 and 0.801 for CTAB-MMT and CPCMMT respectively.
The Kf values for Sb (III) adsorption onto CPC-MMT and CTAB-MMT obtained from the equation were 436.51 mg/g and 255.80 mg/g respectively whereas 11.61 mg/g for MMT. Thus, an efficient adsorption capacity of the modified MMT is observed than the host clay, MMT. The value of “n” obtained from the isotherm equations was 0.579 and 0.584 respectively that indicate a favorable adsorption process.
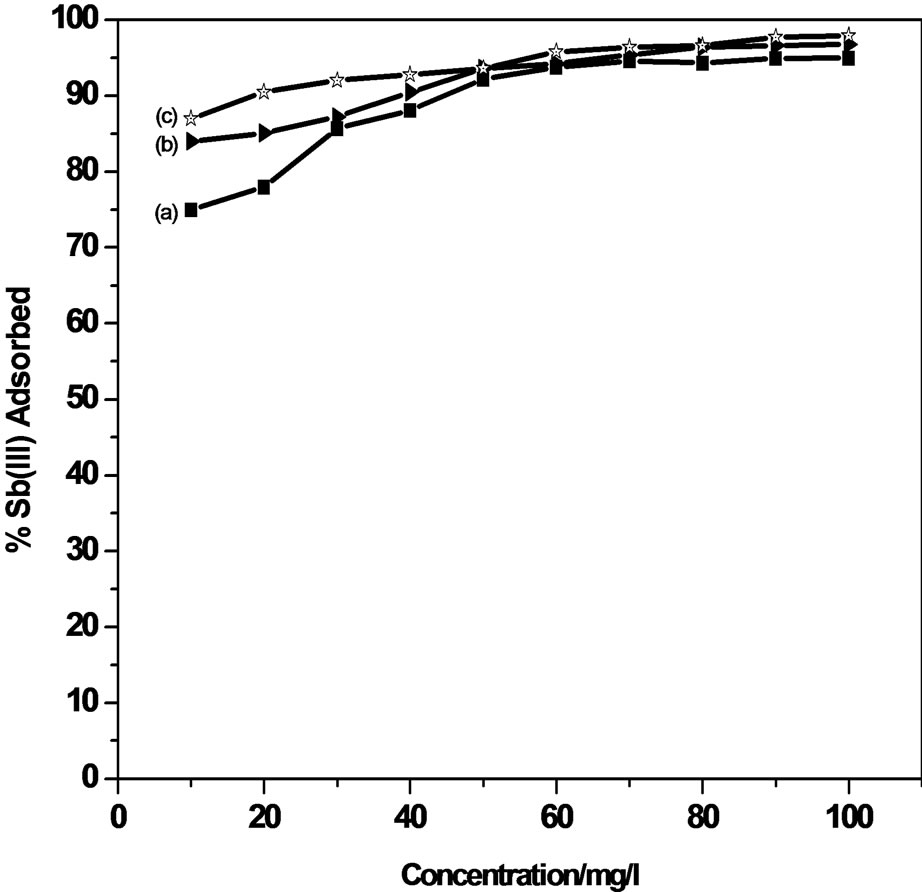
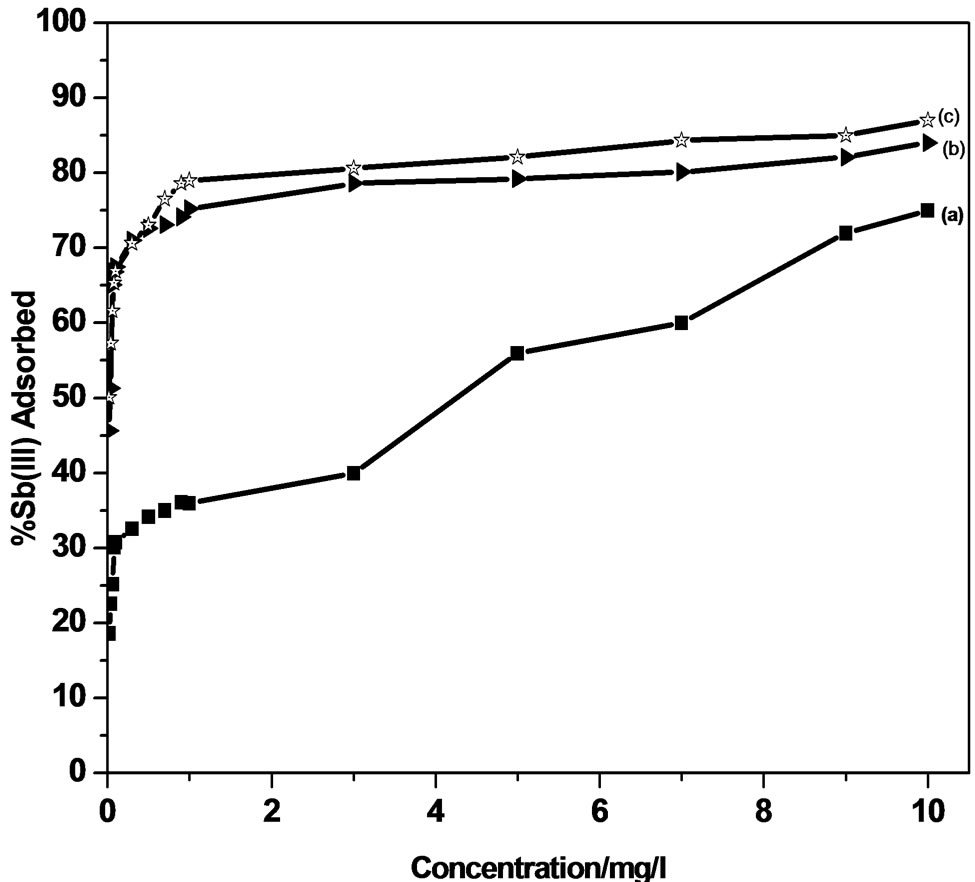
Figure 4. Effect of initial concentration on Sb (III) adsorption.
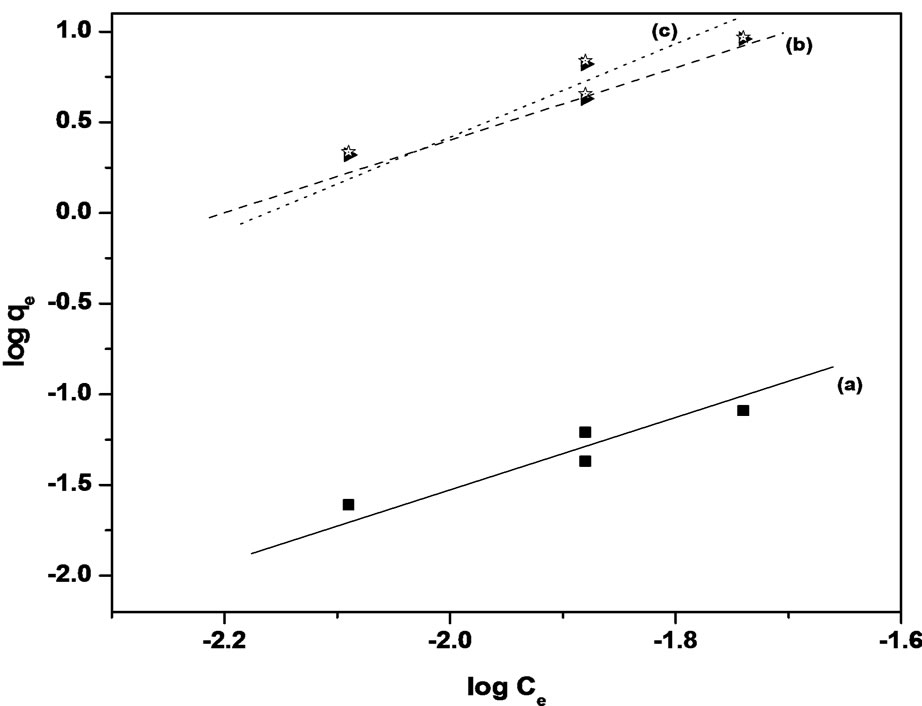
Figure 5. Freundlich isotherm of Sb (III) adsorption onto MMT (b) CTAB-MMT and (c) CPC-MMT.
4. Kinetic Studies
The time dependent metal adsorption behavior was measured by varying the equilibrium time between adsorbate and adsorbent in the range of 01 - 180 minutes. The sorption mechanism and potential rate controlling step of Sb (III) adsorption using MMT and modified MMT have been investigated using kinetic models to test the experimental data. The adsorption kinetic models mentioned in the literature have their own limitations and are derived according to the certain initial conditions based on certain experimental and theoretical assumptions.
The best fit for the experimental series of the study was achieved by investigating various kinetic models. The pseudo-first-order model of Lagergren et al., pseudosecond-order reaction model of Ho and McKay [30,31] and intra-particle diffusion were analyzed and a comparison of the best fit sorption mechanism were made using an initial concentration of 100 mg/l of Sb (III). The overall calculation for the rate of adsorption was estimated and the mechanism of adsorption was determined by the rate determining step.
The Lagergren pseudo-first order kinetic model assumes the rate of change of solute uptake with time as directly proportional to the difference in saturation concentration and the amount of solute uptake with time. The linear form of Lagergren pseudo-first order kinetic model equation is given as
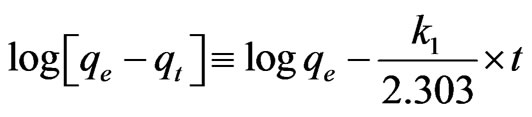 (1)
(1)
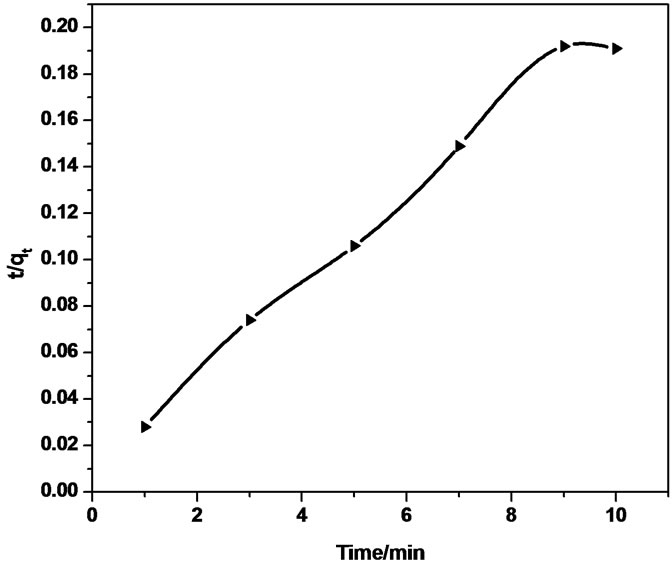
The linear fit correlation coefficient for antimony (III) adsorption on the adsorbents indicate that the pseudo- first-order reaction model slightly deviates with coefficient of correlation as 0.698, 0.884 and 0.891 for Sb (III) adsorption onto MMT, CTAB-MMT and CPC-MMT respectively as shown in Figure 6. Thus pseudo first order model is not found to be in total agreement for the adsorption. However the relationship between initial concentration of Sb (III) and the rate of adsorption is not linear when pore diffusion limits the adsorption process, (Figure 7) and thus pseudo first order reaction model is accompanied with another model.
The Ho and McKay Pseudo-second order kinetic model equation given by Ho and McKay is based on the sorption capacity of the solid phase.
 (2)
(2)
Thus, the applicability of pseudo-second order kinetic model is confirmed by the straight line plot of  against t. Contrary to Lagergren first-order model this model predicts the sorption behavior over the whole time of adsorption.
The linear equation obtained for Sb (III) adsorption during the contact time of 10.0 - 180.0 minutes was observed to be  = 0.0212t + 0.01 using MMT,
  = 0.022t + 0.024 and
  = 0.0015t + 0.0208 using CTAB-MMT and CPC-MMT respectively wherein the correlation coefficient values (R2 = 0.9906 for MMT 0.9990 and 0.9998 for CTAB-MMT and CPC-MMT respectively) indicate that the adsorption follows the second order reaction model quite well. Hence, the sorption system of Sb (III) onto MMT, CTAB-MMT and CPCMMT during 10 - 180 minutes may be chemisorption involving valence forces through sharing or exchange of electrons between sorbent and sorbate. The correlation coefficient values indicate that the adsorption follows the second order reaction model quite well.
The low correlation coefficient of Sb (III) adsorption using MMT and modified MMT during initial contact time of 10 minutes shows that adsorption on the outer surface of adsorbent is also accompanied with the possibility of transport of adsorbate into the interlayer space of adsorbent, due to attiring on batch process (Intraparticle
 (a)
(a)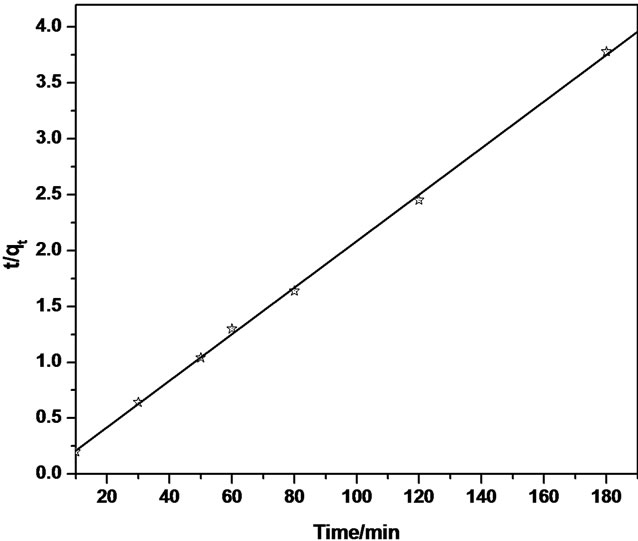 (b)
(b)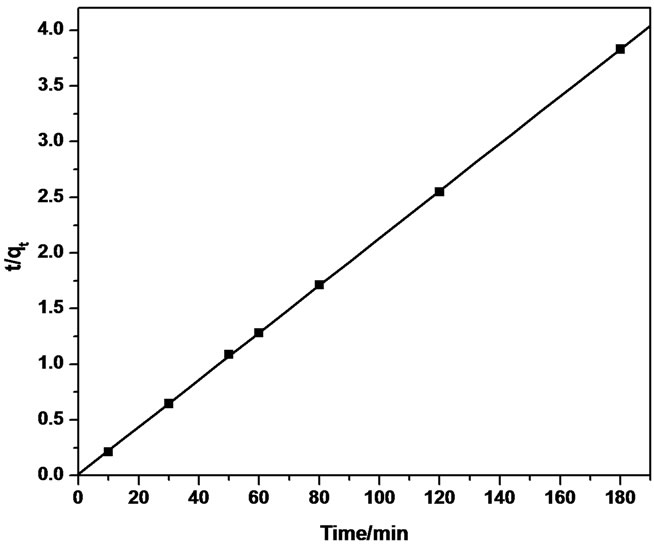 (c)
(c)
Figure 6. Pseudo-second order reaction model of Sb (III) adsorption on (a) MMT (b) CTAB-MMT and (c) CPC-MMT.
 (a)
(a) (b)
(b)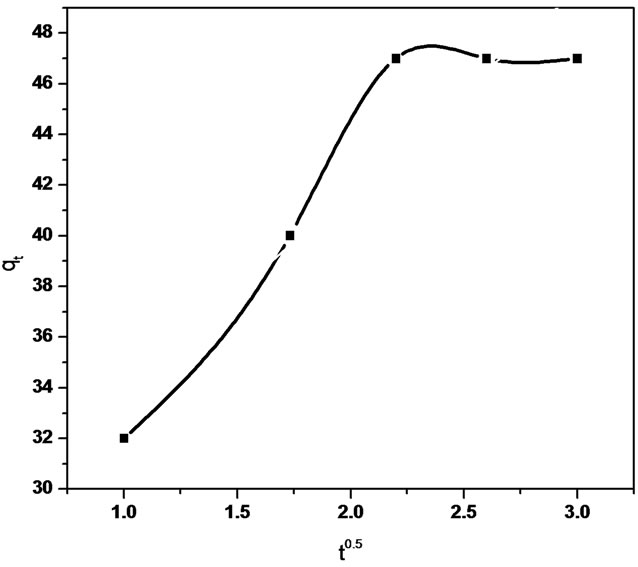 (c)
(c)
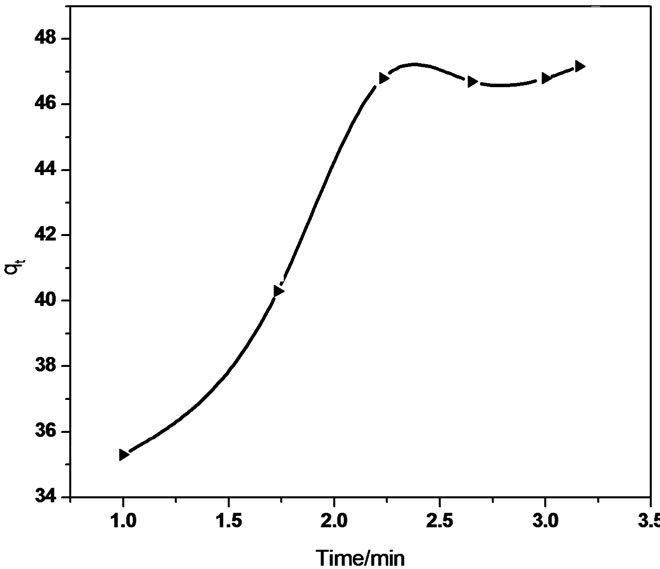
Figure 7. Intraparticle diffusion of Sb (III) in (a) MMT (b) CTAB-MMT and (c) CPC-MMT.
diffusion reaction model). Thus, a graphical relationship between the amount of antimonite adsorbed and square root of time was investigated. The intraparticle diffusion rate equation is given as  kp is the intraparticle diffusion coefficient.
The linear equation obtained for the Sb (III) adsorption using MMT was qt = 0.321 t 0.5 + 37.32 (R2 = 0.958) whereas qt = 5.592 t 0.5 + 31.01 (R2 = 0.940) using CTAB-MMT and qt = 5.479 t 0.5 + 32.723 (R2 = 0.968) using CPC-MMT that signifies an appreciable acceptance of the model.
Figure 7 show smultilinearity for Sb (III) adsorption indicating two or more steps; the first sharper portion imitates the instantaneous adsorption followed by the second, the gradual adsorption stage wherein intraparticle diffusion is rate controlled. The final (equilibrium) stage wherein the intraparticle diffusion starts to slow down due to extremely low Sb (III) concentration in the solution. The slope of the second stage is called the intraparticle diffusion rate constant, kp.
The linear part of the curve does not pass through origin, indicating that the antimonite adsorption mechanism is complex wherein both surface adsorption as well as intraparticle diffusion contributes to the rate determining step.
5. Conclusion
The results obtained indicate that the adsorption capacity of modified MMT for Sb (III) is higher than that of MMT with an efficient extractability and detectibility from as low as 0.006 µg/ml of the analyte. The adsorption of Sb (III) onto the adsorbents used follows the physical adsorption along with the intraparticle diffusion during the initial phase of contact time followed by the chemisorption during the following duration of contact (10 minutes to 180 minutes).
REFERENCES
- C. G. Elinder and L. Friberg, “Antimony,” In: L. Friberg, G. F. Nordberg and V. B. Vouk, Eds., Handbook on the Toxicology of Metals, Vol. II, Specific Metals, Elsevier, Amsterdam, 1986, pp. 26-42.
- T. D. Luckey, B. Venugopal, D. Hutcheson, F. Coulston and F. Korte, “Environmental Quality and Safety, Supplement Vol. I,” Georg Thieme, Stuttgart, 1975.
- T. Norseth, I. Martinsen, T. W. Clarkson, L. Friberg, G. F. Nordberg and P. R. Sager, “Biological Monitoring of Toxic Metals,” Plenum, New York, 1988, pp. 337-367. doi:10.1007/978-1-4613-0961-1_14
- S. C. Wilson, P. V. Lockwood, P. M. Ashley and M. Tighe, “The Chemistry and Behaviour of Antimony in the Soil Environment with Comparisons to Arsenic: A Critical Review,” Environmental Pollution, Vol. 158, No. 5, 2010, pp. 1169-1181. doi:10.1016/j.envpol.2009.10.045
- M. Krachler, W. Shotyk and H. Emons, “Digestion Procedures for the Determination of Antimony and Arsenic in Small Amounts of Peat Samples by Hydride GenerationAtomic Absorption Spectrometry,” Analytica Chimica Acta, Vol. 432, No. 2, 2001, pp. 307-314. doi:10.1016/S0003-2670(00)01364-7
- R. S. Braman and C. C. Foreback, “Methylated Forms of Arsenic in the Environment,” Environment Science, Vol. 182, 1973, pp. 1247-1249.
- W. L. Lindsay, “Chemical Equilibria in Soils,” Wiley, New York, 1979.
- T. Gebel, “Arsenic and Antimony: Comparative Approach on Mechanistic Toxicology,” Chemico-Biological Interactions, Vol. 107, No. 3, 1997, pp. 131-144. doi:10.1016/S0009-2797(97)00087-2
- US Geological Survey, “Mineral Commodity Summaries,” US Geological Survey, Washington DC, 2009.
- R. C. Ragaini, H. R. Ralston and N. Roberts, “Environmental Trace Metal Contamination in Kellogg, Idaho, near a Lead Smelting Complex,” Environmental Science and Technology, Vol. 11, No. 8, 11, 1977, pp. 773-781. doi:10.1021/es60131a004
- R. G. McLaren, R. Naidu, J. Smith and K. G. Tiller, “Fractionation and Distribution of Arsenic in Soils Contaminated by Cattle Dip,” Journal of Environmental Quality, Vol. 27, No. 2, 1998, pp. 348-354. doi:10.2134/jeq1998.00472425002700020015x
- M. Filella, N. Belzile and Y. Chen, “Antimony in the Environment: A Review Focused on Natural Waters: I. Occurrence,” Earth Science Reviews, Vol. 57, No. 1-2, 2002, pp. 125-176. doi:10.1016/S0012-8252(01)00070-8
- N. J. Wilson, D. Craw and K. Hunter, “Antimony Distribution and Environmental Mobility at an Historic Antimony Smelter Site, New Zealand,” Environmental Pollution, Vol. 129, No. 2, 2004, pp. 257-266. doi:10.1016/j.envpol.2003.10.014
- F. Douay, C. Pruvot, H. Roussel, H. Ciesielski, H. Fourrier, N. Proix and C. Waterlot, “Contamination of Urban Soils in an Area of Northern France Polluted by Dust Emissions of Two Smelters, ” Water, Air and Soil Pollution, Vol. 188, No. 1-4, 2008, pp. 247-260. doi:10.1007/s11270-007-9541-7
- K. Telford, W. Maher, F. Krikowa, S. Foster, M. J. Ellwood, P. M. Ashley, P. V. Lockwood and S. C. Wilson, “Bioaccumulation of Antimony and Arsenic in a Highly Contaminated Stream Adjacent to the Hillgrove Mine, NSW, Australia,” Environmental Chemistry, Vol. 6, 2009, pp. 133-143. doi:10.1071/EN08097
- D. Lerda, “Sister-Chromatid Exchange (SCE) among Individuals Chronically Exposed to Arsenic in Drinking Water,” Mutation Research, Vol. 312, No. 2, 1994, pp. 111-120. doi:10.1016/0165-1161(94)90015-9
- N. J. Wilson, D. Craw and K. Hunter, “Antimony Distribution and Environmental Mobility at an Historic Antimony Smelter Site, New Zealand,” Environmental Pollution, Vol. 129, No. 2, 2004, pp. 257-266. doi:10.1016/j.envpol.2003.10.014
- W. P. Tseng, “Effects and Dose-Response Relationships of Skin Cancer and Blackfoot Disease with Arsenic,” Environmental Health Perspectives, Vol. 19, 1977, pp. 109- 119. doi:10.1289/ehp.7719109
- M. N. Bates, A. H. Smith and C. H. Rich, “Arsenic Ingestion and Internal Cancers: A Review,” American Journal of Epidemiology, Vol. 135, No. 5, 1992, pp. 462-476.
- C. J. Chen, T. L. Kuo and M. M. Wu, “Arsenic and Cancers,” The Lancet, Vol. 331, No. 8582, 1988, pp. 414-415. doi:10.1016/S0140-6736(88)91207-X
- W. P. Tseng, H. M. Chu, S. W. How, J. M. Fong, C. S. Lin and S. Yeh, “Prevalence of Skin Cancer in an Endemic Area of Chronic Arsenicism in Taiwan,” Journal of the National Cancer Institute, Vol. 40, No. 3, 1968, pp. 453-463.
- E. A. Deliyanni, E. N. Peleka and K. A. Matis, “Effect of Cationic Surfactant on the Adsorption of Arsenites onto Akaganeite Nanocrystals,” Separation Science and Technology, Vol. 42, No. 5, 2007, pp. 993-1012. doi:10.1080/01496390701206306
- Z. Klika, H. Weissmannova, P. Capkova and M. Pospisil, “The Rhodamine B Intercalation of Montmorillonite,” Journal of Colloid and Interface Science, Vol. 275, No. 1, 2004, pp. 243-250. doi:10.1016/j.jcis.2004.02.040
- J. H. Xia, M. C. Hea and C. Y. Lina, “Adsorption of Antimony (III) and Antimony (V) on Bentonite: Kinetics, Thermodynamics and Anion Competition,” Microchemical Journal, Vol. 97, No. 1, 2011, pp. 85-91.
- H. Khalaf, O. Bouras and V. Perrichon, “Synthesis and Characterization of Al-Pillared and Cationic Surfactant Modified Al-Pillared Algerian Bentonite,” Microporous Materials, Vol. 8, No. 3-4, 1997, pp. 141-150. doi:10.1016/S0927-6513(96)00079-X
- O. Agrawal, G. Sunita and V. K. Gupta, “A Sensitive Colorimetric Method for the Determination of Arsenic in Environmental and Biological Samples,” Journal Chinese Chemical Society, Vol. 46, No. 4, 1999, pp. 641-645.
- A. Anjum, P. Lokeswari, M. Kaur and M. Datta, “Removal of As (III) from Aqueous Solutions Using Montmorillonite,” Journal of Analytical Sciences, Methods and Instrumentation, Vol. 1, No. 2, 2011, pp. 25-30. doi:10.4236/jasmi.2011.12004
- B. Ersoy and M. Çelik, “Effect of Hydrocarbon Chain Length on Adsorption of Cationic Surfactants onto Clinoptilolite,” Clays Clay Minerals, Vol. 51, No. 2, 2003, pp. 172-180. doi:10.1346/CCMN.2003.0510207
- Y. Xi, et al., “Preparation, Characterization of Surfactants Modified Clay Minerals and Nitrate Adsorption,” Applied Clay Science, Vol. 48, No. 1-2, 2010, pp. 92-96. doi:10.1016/j.clay.2009.11.047
- M. Berg, H. C. Tran, T. C. Nguyen, H. V. Pham, R. Schertenleib and W. Giger, “Arsenic Contamination of Groundwater and Drinking Water in Vietnam: A Human Health Threat,” Environmental Science and Technology, Vol. 35, No. 13, 2001, pp. 2621-2626. doi:10.1021/es010027y
- S. S. Tahir and N. Rauf, “Removal of Acationicdye from Aqueoussolutions by Adsorption onto Bentoniteclay,” Chemosphere, Vol. 63, No. 11, 2006, pp. 1842-1848.
NOTES
*Corresponding author.