Materials Sciences and Applications, 2011, 2, 1421-1426
doi:10.4236/msa.2011.210192 Published Online October 2011 (http://www.SciRP.org/journal/msa)
Copyright © 2011 SciRes. MSA
1421
Electric Modulus Analysis of Carbon
Black/Copolymer Composite Materials
Mohamed El Hasnaoui1, Manuel Pedro Fernanades Graça2, Mohammed Essaid Achour1*,
Luís Cadillon Costa2
1Laboratoire LASTID, Département de Physique, Faculté des Sciences, Université Ibn Tofail, Kénitra, Morocco; 2I3N and Physics
Department, University of Aveiro, Aveiro, Portugal.
Email: *sachoum@yahoo.fr, med_elhasnaoui@yahoo.fr
Received January 5th, 2011; revised January 27th, 2011; accepted February 25th, 2011.
ABSTRACT
We have investigated the electrical properties of carbon black (CB) loaded in ethylene butylacrylate copolymer com-
posite (EBA) in the frequency range between 102 and 104 Hz and temperature range between 153 and 353 K. The fre-
quency dependence of electrical data have been analyzed in two frameworks: the electrical modulus formalism with the
Kohlrausch-Williams-Watts stretched exponential function (KWW) and the electrical conductivity by using the Jon-
schers power law in the frequency domain. The stretching exponent βKWW and n are found to be temperature independent
for all CB fractions and decreasing when the CB volume concentrations loaded in copolymer matrix increases. It is found
that the activation energy obtained by the modulus method is in good agreement with that obtained by the DC conductivity
in the power law which is independent on the CB contents that exist in the copolymer matrix, suggesting that these parti-
cles do not interact significantly with the chain segments of the macromolecules in the EBA copolymer.
Keywords: Electrical Modulus, Polymer Matrix, Nanocomposites, Conducting Particles
1. Introduction
The analysis of complex plane is a well-known and pow-
erful technique which has long been used for investigat-
ing dielectric and electrical properties of materials. In
order to analyze and interpret experimental data, it is
essential to have a model equivalent circuit that provides
a realistic representation of the electrical properties. In
recent years, interest has grown in the technological
properties of composites made of a mixture of conduct-
ing and insulating materials. These systems are charac-
terized by their flexibility to develop new materials with
improved properties. The obtained result gives evidence
of a relaxation phenomenon. These two processes are
related to dipolar orientation effects or space charge mi-
gration [1,2]. Along with this, interfacial polarization is
also considered as the genesis of dielectric effects. In a
series of recent papers, the dispersion of carbon black
which is a conducting material into an insulating poly-
meric matrix yields to a composite material that was
studied by several authors [3-9]. For our composite ma-
terials, Costa et al. [10] used the Cole-Cole model to
interpret the complex impedance Z* spectrum as a func-
tion of frequency, at 300 K, for different concentrations
of carbon black loaded in a copolymer.
In the present paper, we report the results of the analy-
sis of experimental data of spectrum modulus, using the
electrical modulus formalism with a Kohlraush Williams
Watt (KWW) distribution of relaxation times and the
Jonscher’s power law with frequency dependence to ex-
tract information about the dielectric relaxation in carbon
black particles filled ethylene butylacrylate copolymer
composite (EBA) regarding carbon concentrations above
the conductivity threshold Φc 12% [10]. This approach
is supported by a wide range of technologically impor-
tant applications which require highly loaded Φ > Φc
carbon black polymer composites, like light emitting
diodes [11] and electromagnetic shielding [12-13]. For
these applications, our understanding of the dielectric
relaxation mechanisms depends sensitively on the carbon
black mesostructure.
2. Theoretical Models
The electrical modulus and the complex impedance for-
malism for the analysis of the dielectric response of ma-
terials have been reported by many authors [14-15]. Im-
Electric Modulus Analysis of Carbon Black/Copolymer Composite Materials
1422
pedance analysis provides a simple method to determine
various contributions to the total conductivity of materi-
als in terms of four possible interrelated complex formu-
lations: impedance (Z*), admittance (Y*), permittivity
(ε*) , and modulus (M*).
The electrical modulus, M*, is defined in terms of the
reciprocal of the complex relative permittivity, ε*(ω), as:
 
1
*'
*( )
MMi"M


(1)
where M'(ω) and M''(ω) are the real and imaginary parts
of the electrical modulus which can be represented by
using the complex dielectric constants with the following
relations:

 
22
'
''"
M

 
(2)


22
"
''' '( )"
M

 
(3)
The non-exponential conductivity relaxation could be
described by using Kohlraush Williams Watt (KWW)
function, Φ(t), which represents the distribution of the
relaxation times in charges conducting materials [16].
The modulus can be represented as:
 
*1exp ddd
KWW o
M
Mit


 
tt
(4)
with


KWW
exp
o
tt
 
 (5)
where M represents the asymptotic value of M'(ω) when
ω→∞, τσ is the conductivity relaxation time and βKWW is
the Kohlrausch exponent with values located in the range
0 < βKWW 1.
Furthermore, the total conductivity at a given tem-
perature over a wide range of frequency can be written as
[17]:
 
,,
totDC AC
TT
 

T (6)
where σDC (T) is the DC conductivity and:


,nT
AC T
 
(7)
This relation represents the electrical conductivity
model of Jonscher’s power law and n(T) represents the
power exponent depending on the temperature 0 n(T)
1.
3. Experimental
For the experiments, we used CB particles obtained from
Columbian Chemicals Co. The average size of the pri-
mary CB particles is about 30 nm [7] and the average
size of the primary aggregate is approximately 150 nm
[18]. The density of the CB particles is 1.89 g·cm3 and
the specific surface area (NSA) is 639 m2·g1. All the
samples of an EBA copolymer filled with acetylene car-
bon black used in this investigation are obtained from
Borealis AB (Sweden). The butylacrylate monomer con-
tains butylester side groups, providing a certain polarity
and a relatively low crystallinity (around 20% in vol-
ume). The density of the EBA copolymer is 0.923 g·cm3.
Nominal CB volume fractions, Φ, between 0% and 22%
were incorporated in the polymer matrix. Six samples
were fabricated by mechanical mixture and have been
studied.
For the electrical measurements, the samples were
prepared as discs of 1 mm thick, with aluminium elec-
trodes of 10 mm diameter on the opposite sites of the
sample. Crosschecking experiments were made by dif-
ferent sizes of electrodes. The electrical contacts were
formed by silver paint. The dielectric measurements were
carried out between 153 to 353 K for frequencies ranging
between 102 and 104 Hz by using a SR850 DSP Lock-In
Amplifier in the typical lock-in configuration.
4. Results and Discussion
4.1. Room Temperature Dielectric Modulus
Properties
Figure 1 shows the variation of real M'(ω) and imaginary
M''(ω) parts of the electric modulus as a function of fre-
quency at room temperature for different volume con-
centrations of CB. M'(ω) shows a dispersion tending to
M at higher frequencies, while the asymmetric M''(ω) is
immediately suggestive of stretched exponential relaxa-
tion behavior.
Figure 1. Real and imaginary parts of the complex modulus
at room temperature for various concentrations of carbon
black.
Copyright © 2011 SciRes. MSA
Electric Modulus Analysis of Carbon Black/Copolymer Composite Materials1423
The parameter βKWW for the studied samples was esti-
mated as a function of volume concentrations of CB by
using the modulus formalism i.e., the M''(ω) spectrum.
The corresponding full width at half height (FWHH) is
wider than the breadth of the Debye Peak (1.14 decades)
and results in a value of βKWW =1.14 per FWHH. The
parameter βKWW is calculated by using the relation βKWW
= 1.14/FWHM. The total conductivity σtot(ω,T) at a
given temperature over a wide range of frequency can be
written as [17] (Equation (6)).
Figure 2 shows the variation of AC conductivity as a
function of frequency for different volume concentra-
tions of CB at room temperature. At low frequencies, the
conductivity does not almost depend on the frequency
and is dominated by a percolative behavior [10]. At high
frequencies, the AC conductivity increases with increas-
ing of frequency, by using the Jonscher’s power law
(Equation (7)) the values of exponent n are calculated.
Figure 3 shows the variation of exponents βKWW and n as
a function of Φ(%) of CB at room temperature.
We observe that both βKWW and n decrease by increas-
ing carbon concentrations. We conclude that the dielec-
tric response results from the prevalence of polarization
by the deformation of the electronic cloud wherein the
movements of the electrons are uncorrelated [8]. Fur-
thermore, the values of exponent n are found to be low
for all samples and the compositional dependence of n
can be linked to the combined effect of distribution of
relaxation path, mechanism on the structure, like the na-
ture of disorder and the degree of interaction. Similarly,
the lower value of n could be attributed to a higher rate
of successful jumps and in turn culminate in high DC
conductivity [19].
Figure 2. AC conductivity as a function of volume concen-
trations of CB loaded in EBA composite, at room tempera-
ture.
Figure 3. Electrical parameters, βKWW (obtained from fit-
ting by KWW function) and n (from the conductivity power
law), as a function of volume concentrations of CB, at room
temperature.
4.2. Temperature Dependence of Dielectric
Modulus
The variation of real M'(ω) and imaginary M''(ω) parts of
the electrical modulus as a function of frequency and
temperature are shown in Figures 4 and 5 respectively at
13.01% of CB fractions. M'(ω) shows a dispersion tend-
ing to M at higher frequencies for several temperatures,
while the asymmetric M''(ω) is suggestive of the
stretched exponential relaxation behavior. By using the
relation βKWW = 1.14/FWHM, the values of βKWW are
calculated.
In the aforementioned Jonsher’s power law, Figure 6
shows the variations of AC conductivity as a function of
frequency at 13.01% of CB concentrations for different
temperature and is used to calculate the values of
exponents n. Figure 7 shows the variations of the expo-
nents βKWW and n as a function of temperature for differ-
ent volume concentrations of CB. From this figure, it
appears that both βKWW and n remain almost constant
with increasing temperature. This behavior which can be
explained by the fact that dielectric response does not sig-
nificantly change, and we are in the presence of uncorre-
lated behavior of the free charge, that is, these materials
retain a rigid structure [20] and (0.73 βKWW 0.93; 0.05
n 0.27). In the present case, we can infer that the ex-
ponent βKWW obeys the Ngai’s relation [21] βKWW = 1 n.
Figures 8 and 9 show the relationship between tem-
peratures and peak frequency ωmax as well as DC con-
ductivity respectively. The straight lines through the data
indicate that the system is in the thermally activated
conduction mechanisms or the so-called Arrhenius be-
havior. This enables us to measure the activation energy
for charges hopping rates, which are inversely propor-
Copyright © 2011 SciRes. MSA
Electric Modulus Analysis of Carbon Black/Copolymer Composite Materials
1424
Figure 4. The variation of real part of the complex electric
modulus, M'(ω), as a function of frequency and tempera-
ture, for 13.04%.
Figure 5. The variation of imaginary part of the complex
electric modulus, M"(ω), as a function of frequency and
temperature, for 13.04%.
Figure 6. AC conductivity as a function of frequency for
different temperature at 13.01% of CB loaded in EBA
composite.
Figure 7. The temperature independence of the stretched
exponent βKWW obtained from fitting by KWW function
and the exponent n from the conductivity power law.
Figure 8. ln(ωmax·T) versus 1000/T for the EBA/CB compos-
ites for different concentrations of CB with the best linear
fittings.
Figure 9. ln(σDC·T) versus 1000/T for the EBA/CB compos-
ites for different concentrations of CB with the best linear
fittings.
Copyright © 2011 SciRes. MSA
Electric Modulus Analysis of Carbon Black/Copolymer Composite Materials1425
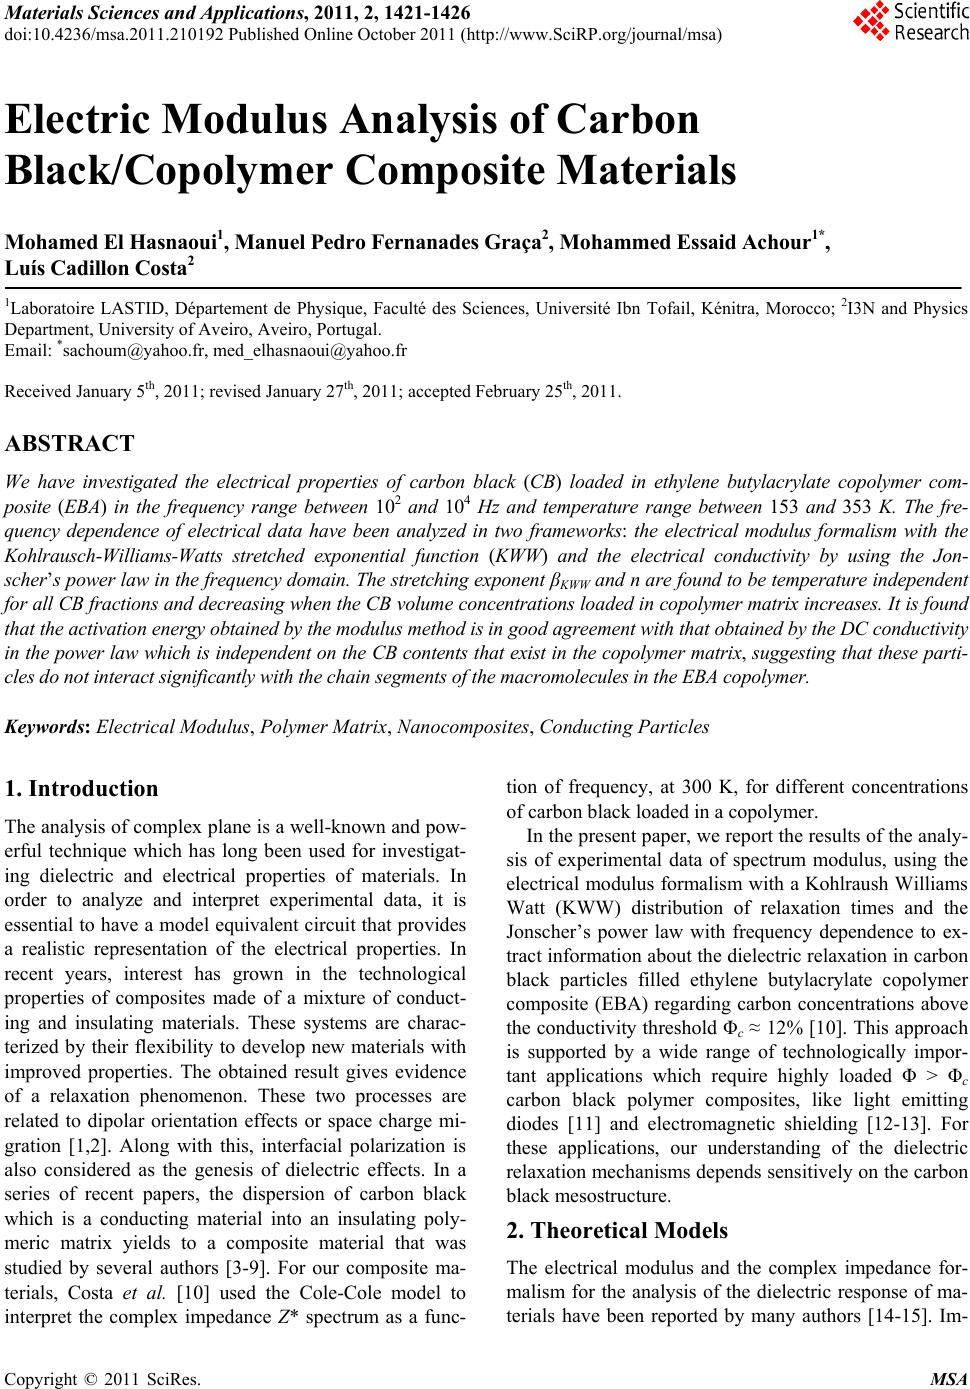
tional to the characteristic relaxation time ωmaxτ = 1
where ωmax= 2πfmax, fmax is the peak frequency corre-
sponding to maximum value of M''(ω). The activation
energy for conduction, which was computed by using
Arrhenius relation ωmax·T (Eam/kbT),was found to be in
the range 10.5 - 14.9 meV when carbon is present inside
the EBA polymer (see Table 1). We suggest that the ab-
sence of difference in the activation energy for the dif-
ferent investigated samples is an indication of the dy-
namically heterogeneous nature of CB aggregates within
the polymer matrix. It is interesting to compare this re-
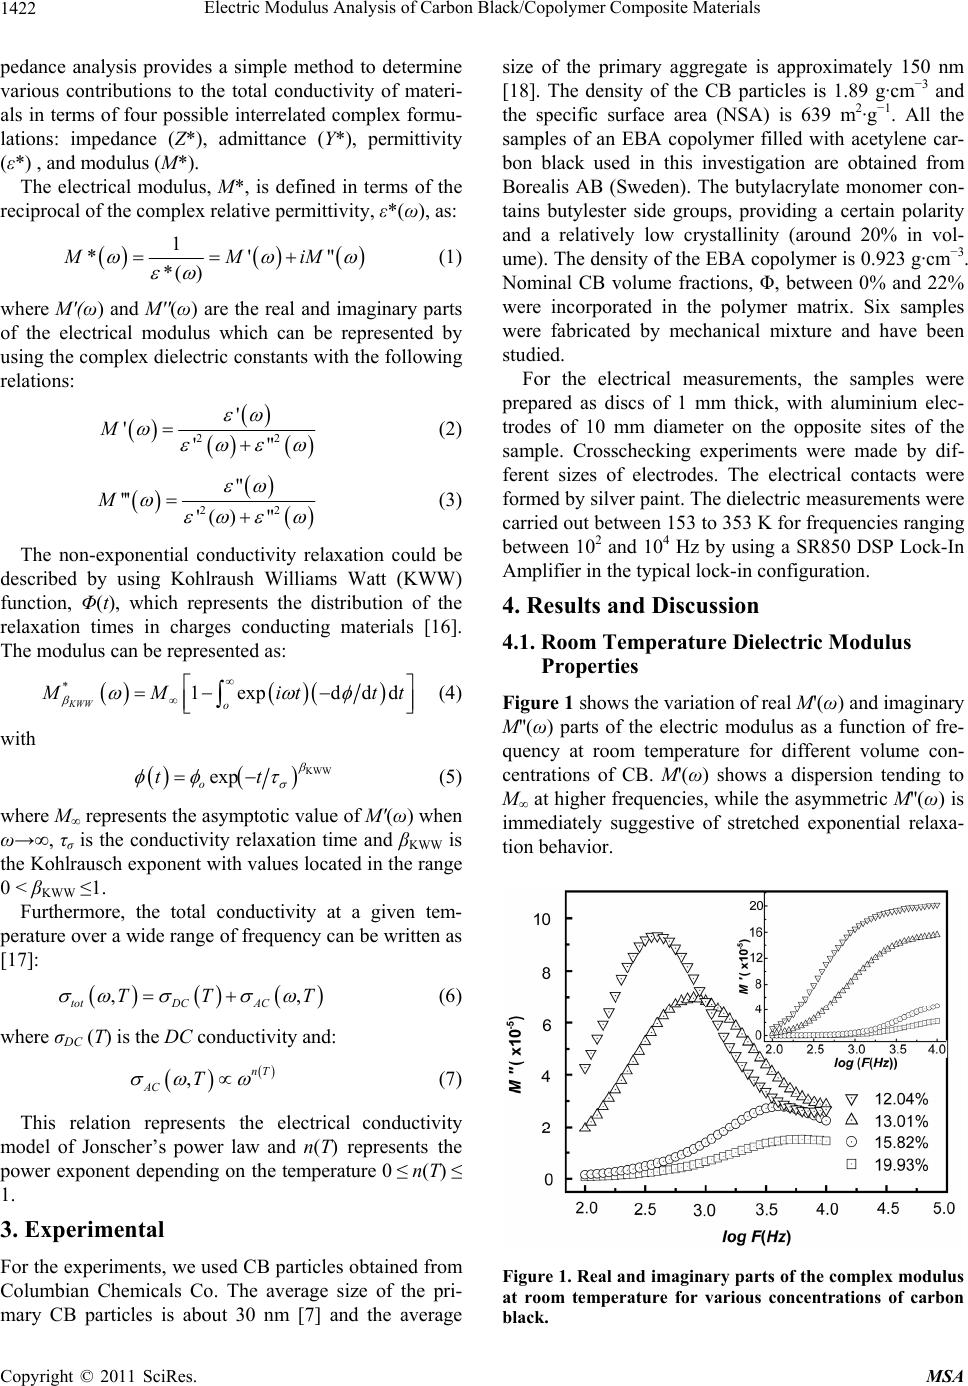
sults of the activation energy with those for the DC con-
ductivity obtained by using the relation σDC·T (Ea/kbT)
from Figure 9, which were found to be in the range 10.3
- 13.1 meV (see Table 1). We observe that the activation
energies calculated by the two methods are almost the
same and are insensitive to carbon black volume fraction,
indicating that both methods are acceptable in manipu-
lating the conduction mechanism. This result means that,
when carbon is present inside the EBA polymer matrix,
the conducting particles do not interact or interact weakly
with the chain segments of the macromolecules in the
copolymer. Furthermore, it helps to understand that there
is a poor bond between the polymer matrix and the car-
bon black particles.
5. Conclusions
The complex electric modulus model and power law
have been used to investigate the electrical conductivity
in the charge conducting materials. The temperature de-
pendencies of the observed modulus M''(ω) peak fre-
quency ωmax and DC conductivity follow the Arrhenius
law. The activation energies of electrical conduction are
nearly the same for both methods and their values do not
change with the increase of CB fraction. The stretching
exponent βKWW representing the degree of interaction is
found to be temperature-independent confirms that ex-
ponent n obtained by Jonscher’s power law. This result
can be explained by the fact the dielectric response does
not significantly change with temperature.
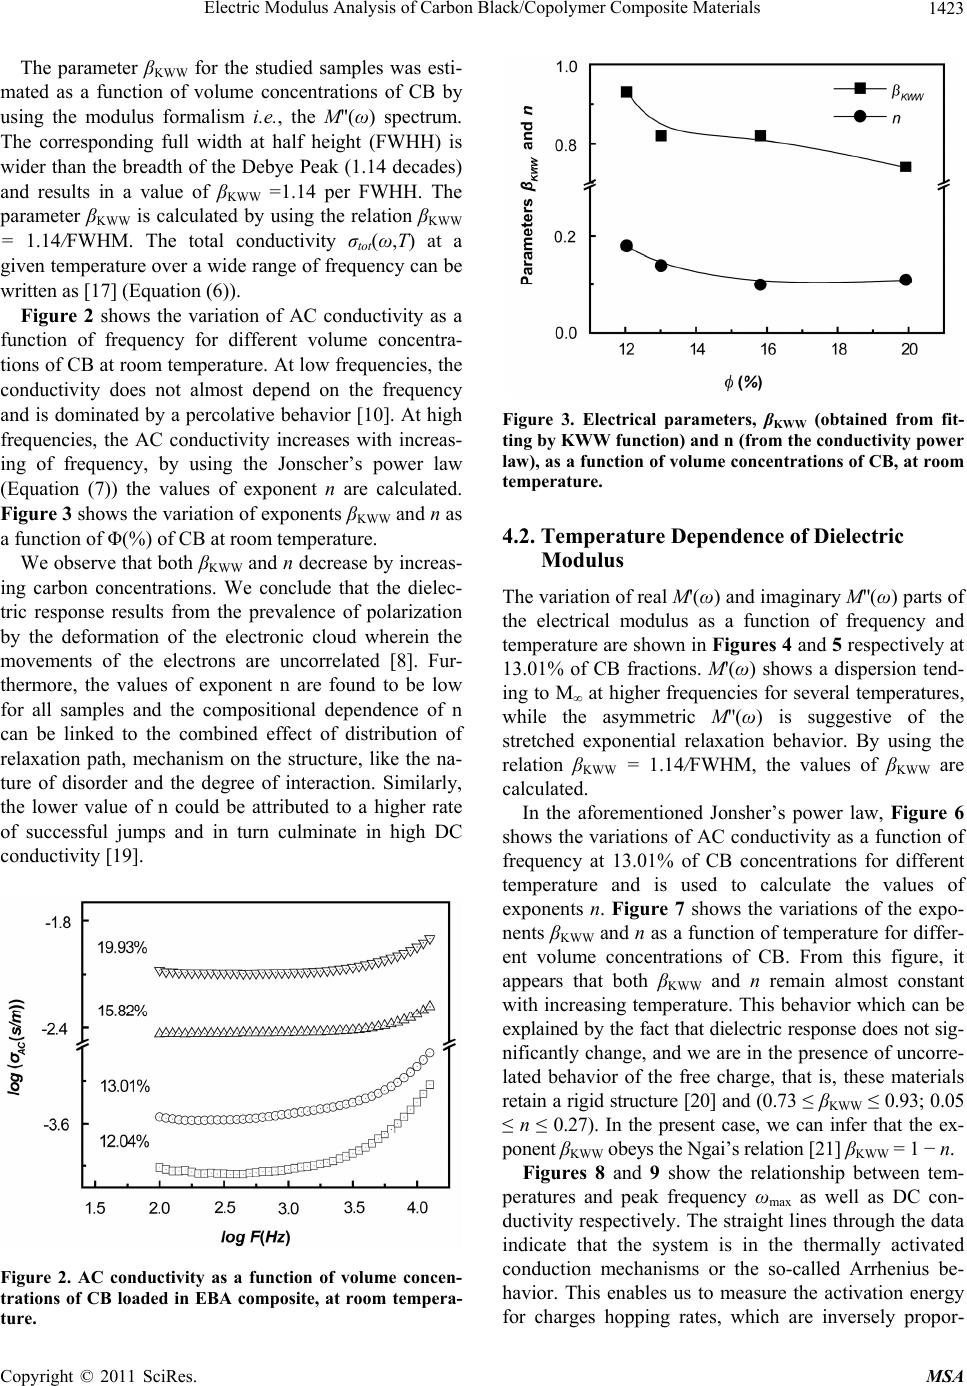
Table 1. Values of the activation energy for different vol-
ume concentrations of CB obtained from the electric mo-
dulus and DC conductivity.
Electrical modulus DC conductivity
Φ (%)
Eam (mev) Rco Eac (mev) Rco
12.04 11.9 ± 2.5 0.90 13.1 ± 0.7 0.98
13.01 10.5 ± 1.4 0.97 12.9 ± 0.6 0.99
15.82 11.7 ± 0.7 0.99 10.3 ± 1.4 0.94
19.93 14.9 ± 1.4 0.99 12.2 ± 0.4 0.99
6. Acknowledgements
The authors are grateful to Prof. F. Carmona (Paul Pascal
Research Center-CNRS & University of Bordeaux I,
France) for supplying the composite materials. This work
is supported by an action integrated (N˚ Physique /04/
08/09) granted by the Portugal-Moroccan committee.
REFERENCES
[1] R. Strumpler and J. Glatz-Reichenbach, “Conducting Poly-
mer Composites,” Journal of Electroceramics, Vol. 3, No.
4, 1999, pp. 329-346. doi:10.1023/A:1009909812823
[2] A. Schonhals, “Dielectric Properties of Amorphous Poly-
mers,” In: J. P. Runt and S. Fitzgerald, Eds., Dielectric
Spectroscopy of Polymeric Materials, American Chemi-
cal Society, Washington DC, 1997, pp. 81-106.
[3] L. C. Costa, F. Henry, M. Valente, S. K. Mendiratta and
A. S. Sombra, “Electrical and Dielectrical Properties of
the Percolating System Polystyrene/Polypyrrole Parti-
cles,” European Polymer Journal, Vol. 38, No. 8, 2002,
pp. 1495-1599. doi:10.1016/S0014-3057(02)00044-7
[4] L. Nuigi and G. Cianfranco, “Metal-Polymer Nanocom-
posites,” John Wiley & Sons, Oxford, 2004.
[5] P. M. Ajayan, P. Braun and L. S. Schadler, “Nanocompo-
site Science and Technology,” Wiley-VCH Verlag GmbH
& Co., Weinham, 2003.
[6] M. E. Achour, “Electromagnetic Properties of Carbon
Black Filled Epoxy Polymer Composites,” In: C. Bros-
seau, Ed., Prospects in Filled Polymers Engineering: Me-
sostructure, Elasticity Network and Macroscopic Pro-
perties, Transworld Research Network, Singapore, 2008,
pp. 129-174.
[7] A. Mdarhri, C. Brosseau and F. Carmona, “Microwave
Dielectric Properties of Carbon Black Filled Polymers
under Uniaxial Tension,” Journal of Applied Physics, Vol.
101, No. 8, 2007, pp. 4111-4122.
doi:10.1063/1.2718867
[8] M. E. Achour, C. Brosseau and F. Carmona, “Dielectric
Relaxation in Carbon Black-Epoxy Composite Materi-
als,” Journal of Applied Physics, Vol. 103, No. 9, 2008,
pp. 4103-4113. doi:10.1063/1.2912985
[9] M. E. Achour, A. Mdarhri, F. Carmona, F. Lahjomri and
A. Oueriagli, “Dielectric Properties of Carbon Black-
Epoxy Resin Composites Studied with Impedance Spec-
troscopy,” Spectroscopy Letters, Vol. 41, No. 2, 2008, pp.
81-86. doi:10.1080/00387010801943848
[10] L. C. Costa, M. E. Achour, M. P. F. Graça, M. El Hasnaoui,
A. Outzourhit and A. Oueriagli, “Dielectric Properties of
the Ethylene Butylacrylate/Carbon Black Nano-Compo-
sites,” Journal of Non-Crystalline Solids, Vol. 356, No. 4-5,
2010, pp. 270-274.
[11] J. Burroughes, D. Bradley, A. Brown, R. Marks, K. Mac-
kay, H. Friend, P. Burns and A. Holmes, “Light-Emitting
Diodes Based on Conjugated Polymers,” Nature, Vol.
347, 1990, pp. 539-541. doi:10.1038/347539a0
[12] Y. Rao, J. Qu, T. Marinis and C. P. Wong, “A Precise
Copyright © 2011 SciRes. MSA
Electric Modulus Analysis of Carbon Black/Copolymer Composite Materials
Copyright © 2011 SciRes. MSA
1426
Numerical Prediction of the Effective Dielectric Constant
for Polymer-Ceramic Composite Based on Effective-Me-
dium Theory,” IEEE Transactions on Components and
Packaging Technologies, Vol. 23, No. 4, 2000, pp. 680-683.
doi:10.1109/6144.888853
[13] A. Priou, “Dielectric Properties of Heterogeneous Materi-
als,” Progress in Electromagnetics Research, Vol. 6, El-
sevier, New York, 1992.
[14] M. S. Tsai and T. Y. Tseng, “Effect of bottom Electrodes
on Dielectric Relaxation and Defect Analysis of (Ba0.47
Sr0.53)TiO3 Thin Film Capacitors,” Materials Chemistry
and Physics, Vol. 57, No. 1, 1998, pp. 47-56.
doi:10.1016/S0254-0584(98)00199-0
[15] P. B. Macedo, C. T. Moynihan and R. Bose, “The Role of
Ionic Diffusion in Polarization in Vitreous Ionic,” Physics
and Chemistry of Glasses, Vol. 13, No. 6, 1972, pp. 171-
179.
[16] R. Zallen, “The Physics of Amorphous Solids,” Wiley,
New York, 1985.
[17] A. K. Jonscher, “Dielectric Relaxation in Solids,” Chelsea
Dielectric Press, London, 1983.
[18] http:/www.columbianchemicals.com/
[19] S. R. Elliott and A. P. Owens “The Diffusion-Ontrolled
Relaxation Model for Ionic Transport in Glasses,” Phi-
losophical Magazine B, Vol. 60, No. 6, 1989, pp. 777-792.
doi:10.1080/13642818908209742
[20] A. K. Jonscher, “Dielectric Relaxation in Solids,” Chelsea
Dielectric Press, London, 1983.
[21] K. L. Ngai, “Universality of Low-Frequency Fluctuation,
Dissipation, and Relaxation Properties of Condensed
Matter, I,” Comments on Solid State Physics, Vol. 9, No.
4, 1979, pp. 127-140.