 Open Journal of Discrete Mathematics, 2011, 1, 153-159 doi:10.4236/ojdm.2011.13019 Published Online October 2011 (http://www.SciRP.org/journal/ojdm) Copyright © 2011 SciRes. OJDM Reliability Analysis of Facility Systems Subject to Edge Failures: Based on the Uncapacitated Fixed-Charge Location Problem Zongtian Wei1,2*, Huayong Xiao1 1Department of Applied Mathematics, Northwestern Polytechnical University, Xi’an, China 2Department of Mat hem at i cs, Xi’an University of Architecture and Technology, Xi’an, China E-mail: *ztwei@xauat.edu.cn, huayongx@nwpu.edu.cn Received August 11, 2011; revised Sepetember 19, 2011; accepted September 30, 2011 Abstract A facility system can be modeled by a connected graph in which the vertices represent entities such as sup- pliers, distribution centers or customers and the edges represent facilities such as the paths of goods or in- formation. The efficiency, and hence the reliability, of a facility system is to a large degree adversely af- fected by the edge failures in the network. Such failures may be caused by various natural disasters or terro r- ist attacks. In this paper, we consider facility systems’ reliability analysis based on the classical uncapaci- tated fixed-charge location problem when subject to edge failures. For an existing facility system, we formu- late two models based on deterministic case and stochastic case to measure the loss in efficiency due to edge failures and give computational results and reliability envelopes for a specific example. Keywords: Facility System, Reliability, Edge Failure, Uncapacitated Fixed-Charge Location Problem 1. Introduction It is well known that facility location decisions are stra- tegic in a supply chain, or more generally speaking, in a facility system design, since facility location decisions are costly and difficult to reverse, and their impact spans a long time horizon. We use the term “facility” here in its broadest sense. That is, it is meant to include facilities such as factories, warehouses, retail outlets, schools, hospitals, and satel- lites, as well as transportation lines, cab les to name but a few that have been analyzed in the research literature. Every facility system in operation maybe faces various disruptions. Such disruptions have begun to receive sig- nificant attention from practitioners and researchers after the terrorist attacks of September 11, 2001. Facility sys- tem disruptions can have significant physical costs (e.g., damage to facilities, inventory, electronic networks, and infrastructure) and subsequent losses due to downtime. A recent study [1] estimates the cost of downtime (in terms of lost revenue) for several online industries that cannot function if their computers are down. We view the structure of a facility system as a con- nected graph in which the vertices represent facilities such as subway stations, distribution centers, etc., and the edges represent facilities such as the paths of goods (e.g., transportation lines) or information (e.g., cables). In this paper, we distinguish two kinds of facilities, e.g., “vertex facilities” and “edge facilities”. For simplicity, we call them “vertices” and “edges”, respectively. It is well known that, regardless of intentional strikes or natural disasters, edges are easily to be damaged. In most cases, facility system disruptions are caused by the failures of edges, e.g., closure of highway because of the inclement weather, traffic jam, road damage caused by earthquak es or debris flo ws. In this paper, adopting the facility location analysis framework, we will mainly consider facility systems’ reliability analysis based on the classical uncapacitated fixed-charge location problem (UFLP) when subject to edge failures, whereby we consider an existing facility system in which the facilities may or may not be located optimally. The edges may be lost due to natural disasters or terrorist attacks. We want to know the efficiency of the remaining system under such circumstances. We will formulate two models based on deterministic case and stochastic case to measure the loss in efficiency due to edge failures and give computation al results and reliabil- 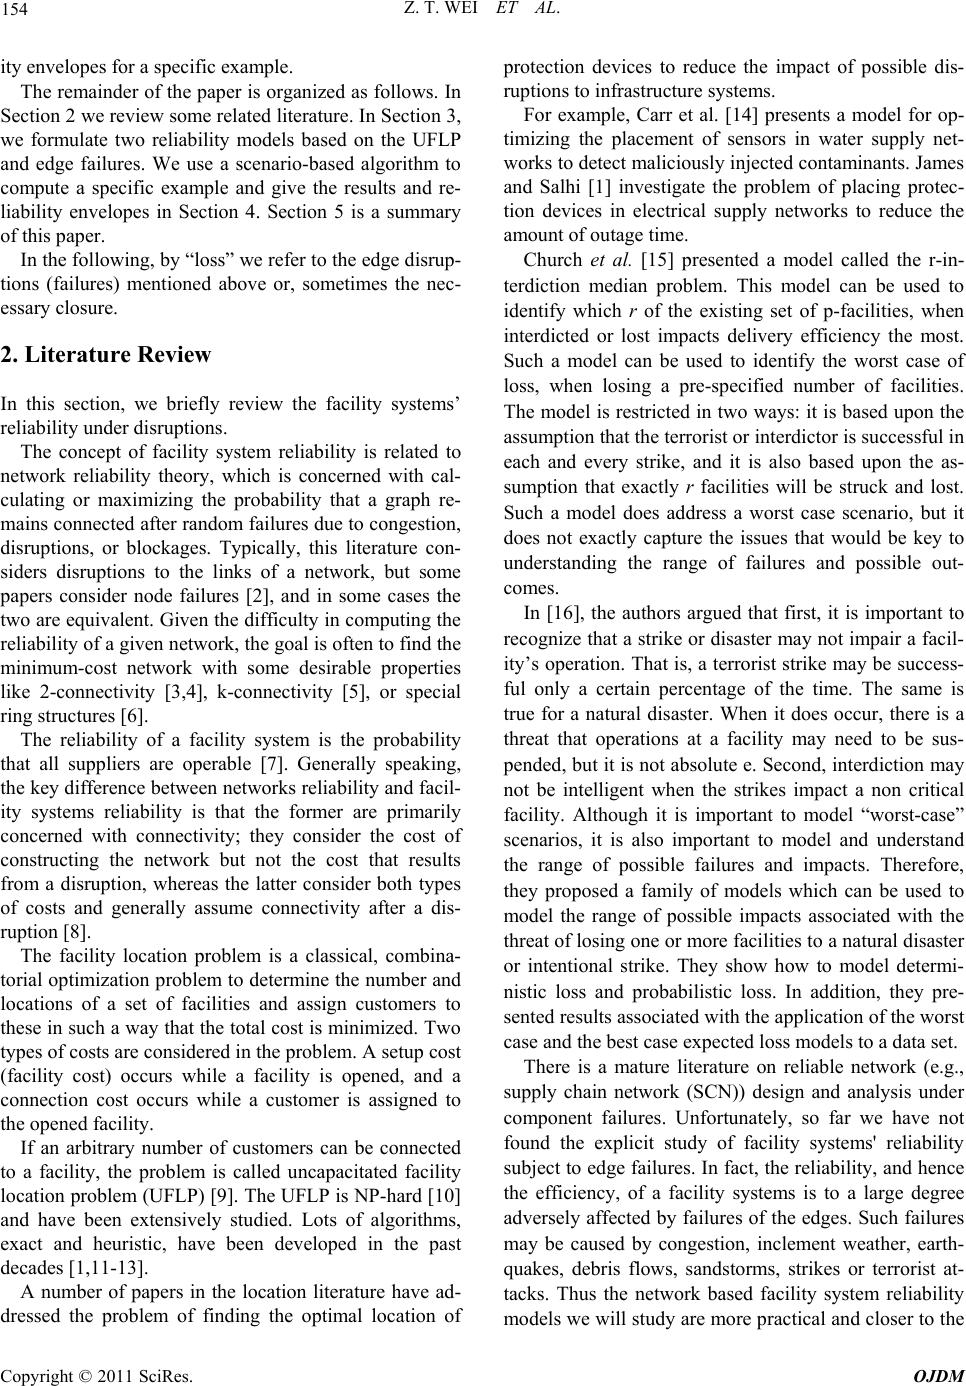 Z. T. WEI ET AL. 154 ity envelopes for a specific example. The remainder of the paper is organized as follows. In Section 2 we review some related literature. In Section 3, we formulate two reliability models based on the UFLP and edge failures. We use a scenario-based algorithm to compute a specific example and give the results and re- liability envelopes in Section 4. Section 5 is a summary of this paper. In the following, by “loss” we refer to the edge disrup- tions (failures) mentioned above or, sometimes the nec- essary closure. 2. Literature Review In this section, we briefly review the facility systems’ reliability under disruptions. The concept of facility system reliability is related to network reliability theory, which is concerned with cal- culating or maximizing the probability that a graph re- mains connected after random failures due to congestion , disruptions, or blockages. Typically, this literature con- siders disruptions to the links of a network, but some papers consider node failures [2], and in some cases the two are equivalent. Given the d ifficulty in computing the reliability of a given network, the g oal is of ten to find the minimum-cost network with some desirable properties like 2-connectivity [3,4], k-connectivity [5], or special ring structures [6]. The reliability of a facility system is the probability that all suppliers are operable [7]. Generally speaking, the key differen ce between ne tworks reliability and facil- ity systems reliability is that the former are primarily concerned with connectivity; they consider the cost of constructing the network but not the cost that results from a disruption, whereas the latter consider both types of costs and generally assume connectivity after a dis- ruption [8]. The facility location problem is a classical, combina- torial optimization problem to determine the number and locations of a set of facilities and assign customers to these in such a way that the total cost is minimized. Two types of costs are considered in the problem. A setup cost (facility cost) occurs while a facility is opened, and a connection cost occurs while a customer is assigned to the opened facility. If an arbitrary number of customers can be connected to a facility, the problem is called uncapacitated facility location problem (UFLP) [9]. The UFLP is NP-hard [10] and have been extensively studied. Lots of algorithms, exact and heuristic, have been developed in the past decades [1,11-13]. A number of papers in the location literature have ad- dressed the problem of finding the optimal location of protection devices to reduce the impact of possible dis- ruptions to infrastructure systems. For example, Carr et al. [14] presents a model for op- timizing the placement of sensors in water supply net- works to detect maliciously injected contaminants. James and Salhi [1] investigate the problem of placing protec- tion devices in electrical supply networks to reduce the amount of out age time. Church et al. [15] presented a model called the r-in- terdiction median problem. This model can be used to identify which r of the existing set of p-facilities, when interdicted or lost impacts delivery efficiency the most. Such a model can be used to identify the worst case of loss, when losing a pre-specified number of facilities. The model is restricted in two ways: it is based upon the assumption that the terrorist or interdictor is successful in each and every strike, and it is also based upon the as- sumption that exactly r facilities will be struck and lost. Such a model does address a worst case scenario, but it does not exactly capture the issues that would be key to understanding the range of failures and possible out- comes. In [16], the authors argued that first, it is important to recognize that a strike or disaster may not impair a facil- ity’s operation. That is, a terrorist strike may be success- ful only a certain percentage of the time. The same is true for a natural disaster. When it does occur, there is a threat that operations at a facility may need to be sus- pended, bu t it is not absolute e. Second, interdiction may not be intelligent when the strikes impact a non critical facility. Although it is important to model “worst-case” scenarios, it is also important to model and understand the range of possible failures and impacts. Therefore, they proposed a family of models which can be used to model the range of possible impacts associated with the threat of losing one or more facilities to a natural disaster or intentional strike. They show how to model determi- nistic loss and probabilistic loss. In addition, they pre- sented results associated with the application of the worst case and the best case expected loss models to a data set. There is a mature literature on reliable network (e.g., supply chain network (SCN)) design and analysis under component failures. Unfortunately, so far we have not found the explicit study of facility systems' reliability subject to edge failures. In fact, the reliability, and hence the efficiency, of a facility systems is to a large degree adversely affected by failures of the edges. Such failures may be caused by congestion, inclement weather, earth- quakes, debris flows, sandstorms, strikes or terrorist at- tacks. Thus the network based facility system reliability models we will study are more practical and closer to the Copyright © 2011 SciRes. OJDM 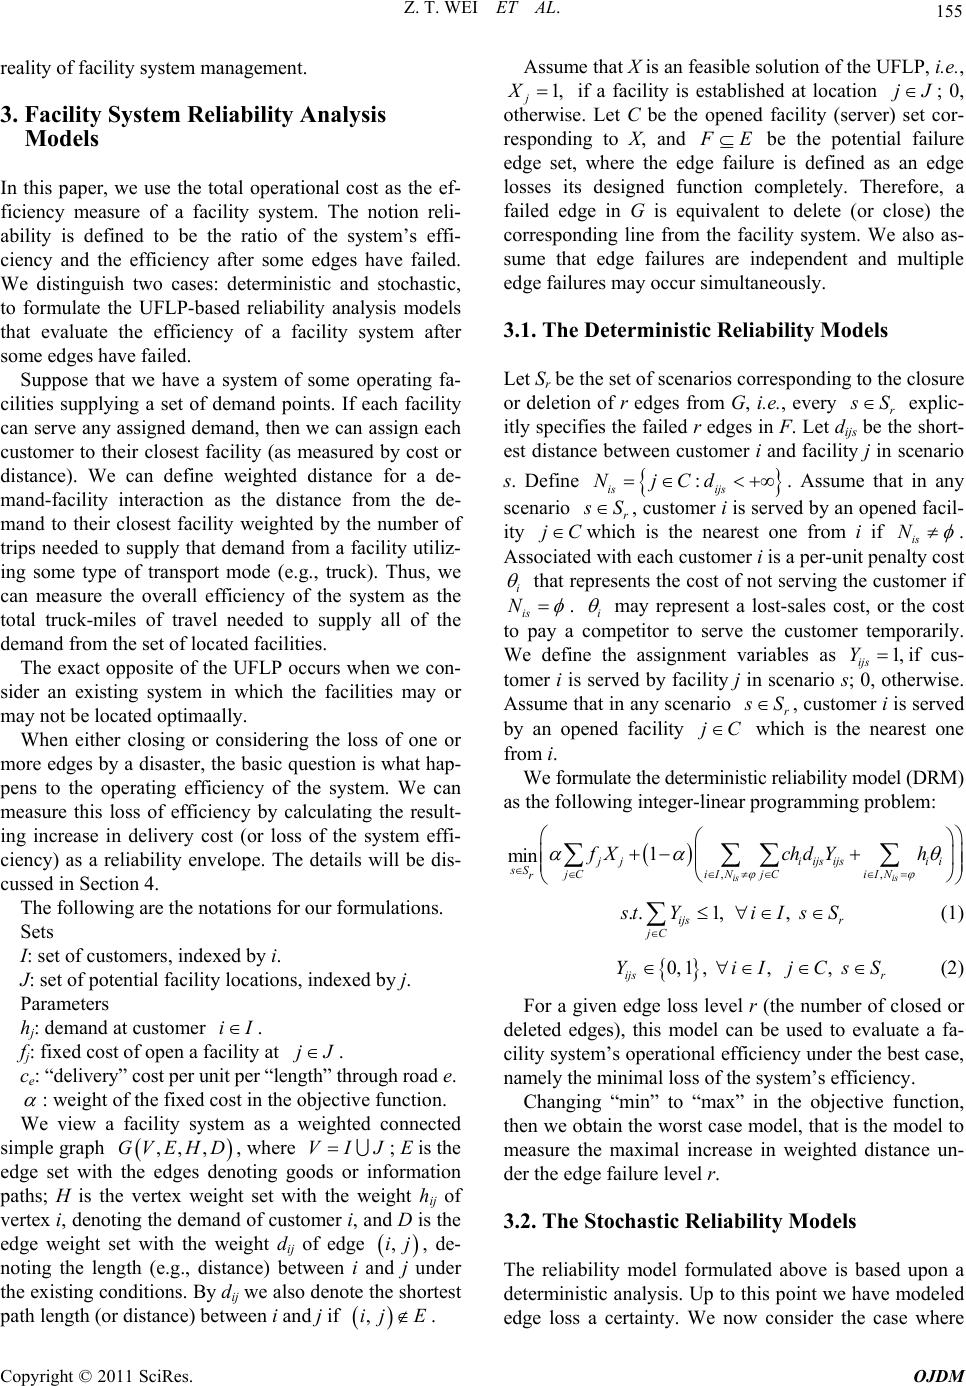 155 Z. T. WEI ET AL. reality of facility system management. 3. Facility System Reliability Analysis Models In this paper, we use the total operational cost as the ef- ficiency measure of a facility system. The notion reli- ability is defined to be the ratio of the system’s effi- ciency and the efficiency after some edges have failed. We distinguish two cases: deterministic and stochastic, to formulate the UFLP-based reliability analysis models that evaluate the efficiency of a facility system after some edges have failed. Suppose that we have a system of some operating fa- cilities supplying a set of demand points. If each facility can serve any assigned demand, then we can assign each customer to their closest facility (as measured by cost or distance). We can define weighted distance for a de- mand-facility interaction as the distance from the de- mand to their closest facility weighted by the number of trips needed to su pply that demand from a facility utiliz- ing some type of transport mode (e.g., truck). Thus, we can measure the overall efficiency of the system as the total truck-miles of travel needed to supply all of the demand from the set of located facilities. The exact opposite of the UFLP occurs when we con- sider an existing system in which the facilities may or may not be located optimaally. When either closing or considering the loss of one or more edges by a disaster, the basic question is what hap- pens to the operating efficiency of the system. We can measure this loss of efficiency by calculating the result- ing increase in delivery cost (or loss of the system effi- ciency) as a reliability envelope. The details will be dis- cussed in Section 4. The following are the notations for our formulations. Sets I: set of customers, indexed by i. J: set of potential facility locations, indexed by j. Parameters hj: demand at customer . iI fj: fixed cost of open a facility at . jJ ce: “delivery ” cost per uni t per “l engt h” t hrough road e. : weight of the fixed cost in the objective function. We view a facility system as a weighted connected simple graph , where ; E is the edge set with the edges denoting goods or information paths; H is the vertex weight set with the weight hij of vertex i, denoting the demand of customer i, and D is the edge weight set with the weight dij of edge , de- noting the length (e.g., distance) between i and j under the existing cond itions. By dij we also denote the shortest path lengt h (or distance) between i and j if ,, ,GVEHD VIJ , ,ij Assume that X is an feasible solution of the UFLP, i. e . , 1, j X if a facility is established at location jJ ; 0, otherwise. Let C be the opened facility (server) set cor- responding to X, and E be the potential failure edge set, where the edge failure is defined as an edge losses its designed function completely. Therefore, a failed edge in G is equivalent to delete (or close) the corresponding line from the facility system. We also as- sume that edge failures are independent and multiple edge failures may occur simultaneou sly. 3.1. The Deterministic Reliability Models Let Sr be the set of scenarios corresponding to the closure or deletion of r edges from G, i.e., every r S explic- itly specifies the failed r edges in F. Let dijs be the short- est distance between customer i and facility j in scenario s. Define : is ijs NjCd . Assume that in any scenario r S , customer i is served by an opened fa cil- ity jC which is the nearest one from i if is N . Associated with each customer i is a per-unit penalty cost i that represents the cost of not serving the customer if is N . i may represent a lost-sales cost, or the cost to pay a competitor to serve the customer temporarily. We define the assignment variables as ijs Y1, if cus- tomer i is served by facility j in scenario s; 0, otherwise. Assume that in any scenar io r S C, customer i is served by an opened facility j which is the nearest one from i. We formulate the deterministic reliability model (DRM) as the following integer-linear programming problem: ,, 1 min is is jjiijsijs ii sS jCiINjCiIN r fXchdYh ..1, , ijs r jC tY iIsS (1) 0,1 ,,, ijs r YiIjCsS (2) For a given edge loss level r (the number of closed or deleted edges), this model can be used to evaluate a fa- cility system’s operational efficiency under the best case, namely the minimal loss of the system’s efficiency. Changing “min” to “max” in the objective function, then we obtain the worst case model, that is the model to measure the maximal increase in weighted distance un- der the edge failure level r. 3.2. The Stochastic Reliability Models ij E . The reliability model formulated above is based upon a deterministic analysis. Up to this point we have modeled edge loss a certainty. We now consider the case where Copyright © 2011 SciRes. OJDM  Z. T. WEI ET AL. 156 loss is not a certainty upon an edge failure. Usually, the chances of losing an edge are based upon some probabil- ity. We wish to derive the maximal or minimal expected efficiencies associated with an existing system. To do this we need to identify both the worst case and the best case expected outcomes. Let E be the target edge (the potential failure edet of a o set when ge) sn attack. Assume that an attacker can hit each edge in F at most once and that the edges in F will be hit simultaneously. Let Sr be the scenari 0rrF edges in F have been attacked. Each r Ss fine hich r edges in F have been attacked. Depecifies w isattackedinsce s EeFe narios, then any s E nario s, can be used to represent a failed edge set in sceso we call the sub-scenario of s. Let j be a nearest opened flity to customer i and aci ijF de the shortest distance between them in scenario efine : s iF NjCd . Assume that in any scenario y an opened facil- ity jC which is the nearest one from i if s iF N b DFs. s ij omer ied b F is servFs, cust . Let he failure probability of edge jF aft attack. It is easy to see that scenario ccurs with probability pj be ter one Fs o \ 1 s sss jj jFjEF pp p Denote the assignment variables as if cus- to e opened facility (server) set of an existing fa 1, s ijF Y n scenarmer i is served by an open facility j iio Fs; 0, otherwise. Let C be th cility system. We formulate the stochastic reliability model (SRM) as following (The penalty cost i are defined in Section 3.1.): ,, 1 min r sss s siFiF s jj sS jC FiijFijFi i FE iIN jCiIN fX pchdYh s ..1, , s ijFss jC tY iIFE (3) E (4) The objective function selects r edges fr m given failure level r, this model can be used to ev . The Reliability Envelopes he models described above can be applied to a given d the SRM to a da F0,1 ,,, s ijs s YiIjCF om F to mini- ize the weighted distance expectation after r edges in F have been attacked. Constraints (3) require that each customer be served by at most one server in any scenario Fs. Constraints (4) require the assignment variables to be binary. For a aluate a facility system’s operational efficiency under the best case. Changing “min” in the objective function to “max”, then we obtain the worst case model, that is the model to measure the maximal increase in expected weighted distance under failure level r. 4 T facility system over a range of edge loss level r. We use the weighted distance to measure the efficiency of a fa- cility system and efficiency is measured at 100% if all edges are operating. If an edge is lost due to a natural disaster, intentional strike or planned closure, then the efficiency is lost and overall efficiency decreases. If many edges exist, then there exist several possible out- comes of losing just one edge. One can easily enumerate each of the possible ways of losing one edge as well as calculate the impact of each possible loss in terms of changes in efficiency. The results of this series of calcu- lations will define a range of losses from the best case (i.e. the least decrease in efficiency) to the worst case (i.e. the greatest decrease in efficiency). We then have a re- gion defined by an upper curve and a lower curve, where the upper and the lower curve represent the solutions of the least or the greatest impact associated with a given loss level, respectively. The region depicted between these two curves can be defined as the operational enve- lope or reliability envelope. For a given edge loss level, this envelope specifies the range of possible system per- formance from the best-case to the worst-case. Actual performance will fall within this range. In this section we apply the DRM an ta set to generate reliability envelopes. Our data set is derived from the 2008 China census data: a 49-node set consisting of the capitals of all the provinces in China plus the two special administrative regions Hong Kong and Macau, as well as other 15 big cities. The demand of city i, hi is settled to be the city’s administrative region population divided by 10000. The transportation links (edges) are set to the recent national highways and the transportation costs per unit per length through different roads are all set to 0.005c . The fixed cost of facilities setup are estimated by considering the factors such as local labor price, facility size, and other natural condi- tions. By using the above data set we optimally solve an UFLP with 0.7 in order to site an existing facility system. Figuows the optimal solution, where the 8 distribution centers are city 4, city 7, city 11, city 20, city 24, city 26, city 28 and city 45, and the edges marked by red color represent the delivery routes from each distri- bution center to its customers. re 1 sh Copyright © 2011 SciRes. OJDM 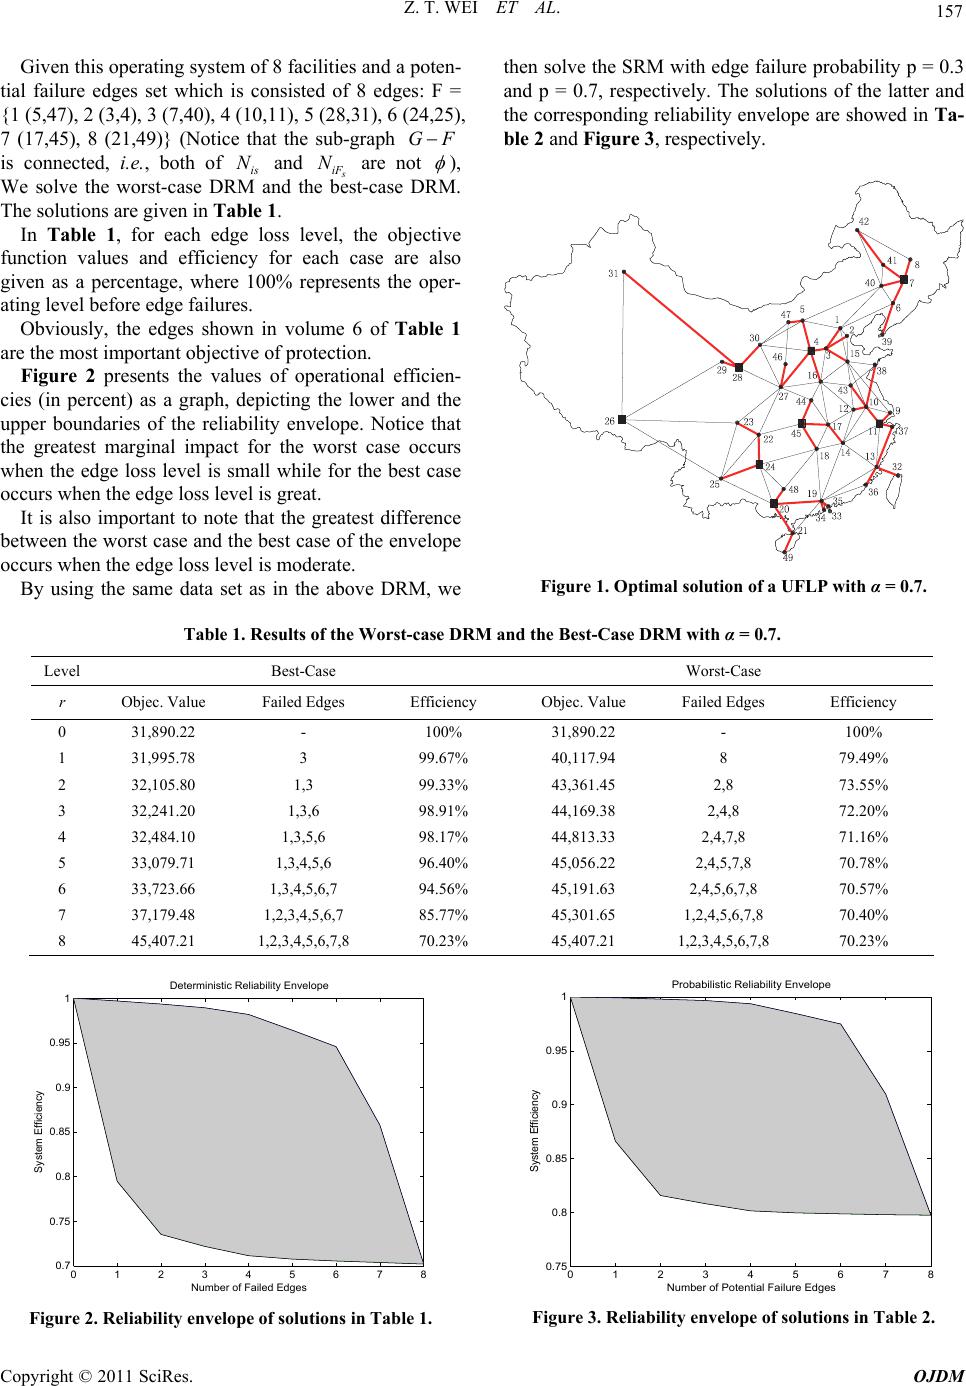 Z. T. WEI ET AL. Copyright © 2011 SciRes. OJDM 157 facilities and a poten- tiaGiven this operating system of 8 then solve the SRM with edge failure probability p = 0.3 and p = 0.7, respectively. The solutions of the latter and the corresponding reliability envelope are showed in Ta- ble 2 and Figure 3, respectively. l failure edges set which is consisted of 8 edges: F = {1 (5,47), 2 (3,4), 3 (7,40), 4 (10,11), 5 (28,31), 6 (24,25), 7 (17,45), 8 (21,49)} (Notice that the sub-graph GF is connected, i.e., both of is N and iF N are not ), We solve the worst-case DRM and the t-case DRM. The solutions are given in Table 1. In Table 1, for each edge loss bes level, the objective fu volume 6 of Table 1 ar l efficien- ci atest difference be e DRM, we nction values and efficiency for each case are also given as a percentage, where 100% represents the oper- ating level before edge failures. Obviously, the edges shown in e the most important objective of protection. Figure 2 presents the values of operationa es (in percent) as a graph, depicting the lower and the upper boundaries of the reliability envelope. Notice that the greatest marginal impact for the worst case occurs when the edge loss level is small while for the best case occurs when the edge loss level is great. It is also important to note that the gre tween the worst case and the best case of the envelope occurs when the edge loss level is moderate. By using the same data set as in the abovFigure 1. Optimal solution of a UFLP with α = 0.7. Table 1. Results of the Worst-case DRM and the Best-Case DRM with α = 0.7. Level Best-Case Worst-Case r Objec. Value Failed Edges Efficiency Objec. Value Efficiency Failed Edges 0 31,890.22 - 100% 31,890.22 - 100% 1 31,995.78 3 99.67% 40,117.94 8 79.49% 2 32,105.80 1,3 99.33% 43,361.45 2,8 73.55% 3 32,241.20 1,3,6 98.91% 44,169.38 2,4,8 72.20% 4 32,484.10 1,3,5,6 98.17% 44,813.33 2,4,7,8 71.16% 5 33,079.71 1,3,4,5,6 96.40% 45,056.22 2,4,5,7,8 70.78% 6 33,723.66 1,3,4,5,6,7 94.56% 45,191.63 2,4,5,6,7,8 70.57% 7 37,179.48 1,2,3,4,5,6,7 85.77% 45,301.65 1,2,4,5,6,7,8 70.40% 8 45,407.21 1,2,3,4,5,6,7,8 70.23% 45,407.21 1,2,3,4,5,6,7,8 70.23% 0 1 2 3 4 5 6 7 0.75 0.8 0.85 0.9 0.95 1Probabilistic Reliability Envelope Number of Potential Failure Edges 01234567 0.7 0.75 0.8 0.85 0.9 0.95 1Deterministic Reliability Envelope Number of Failed Edges System Efficiency Figure 3. Reliability envelope of solutions in Table 2. Figure 2. Reliability envelope of solutions in Table 1. 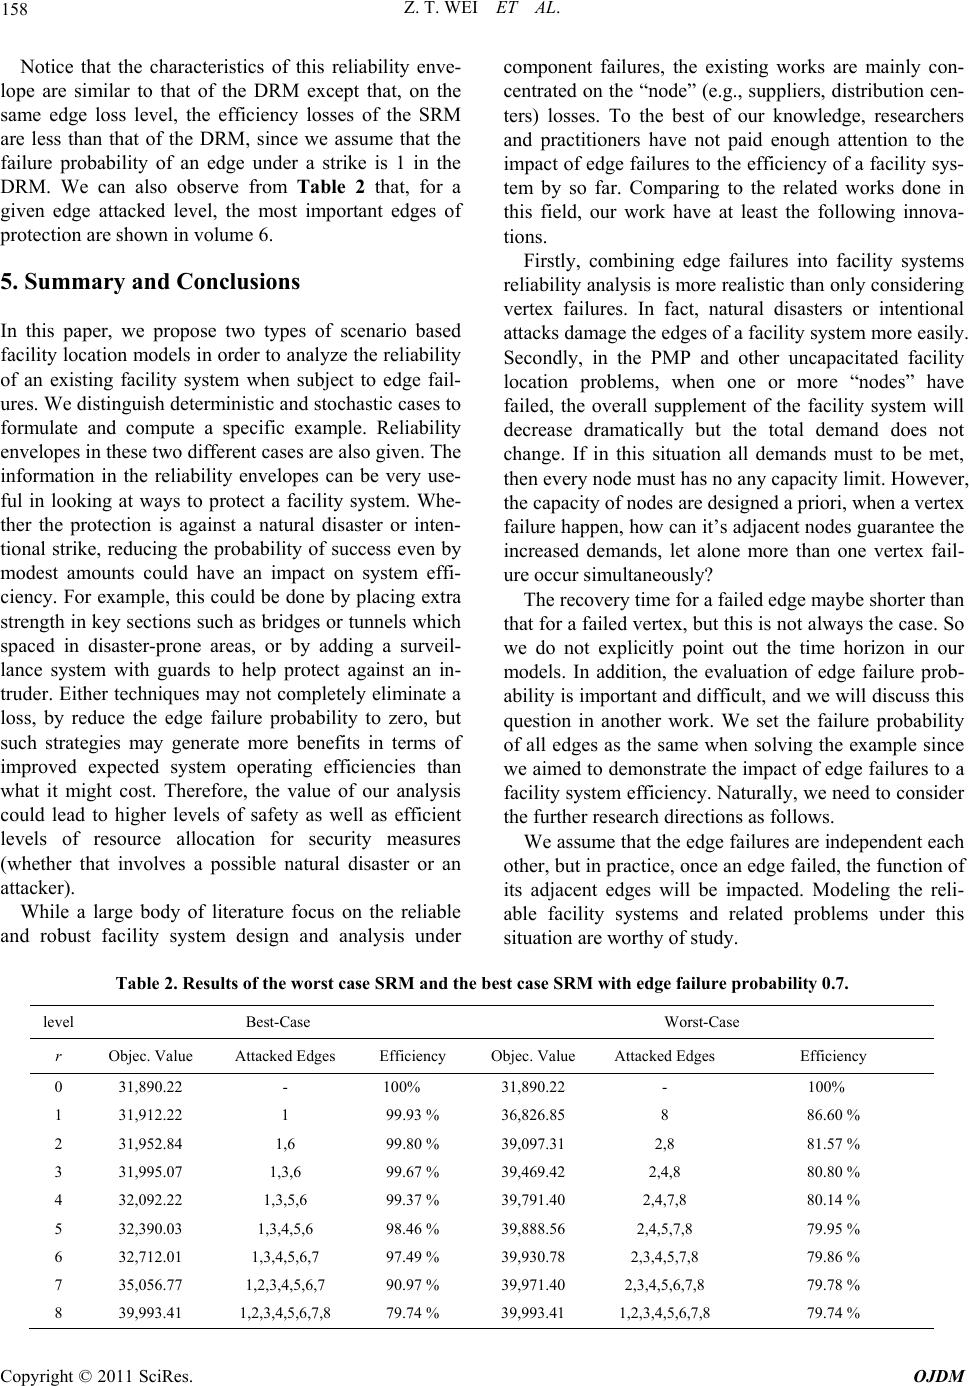 Z. T. WEI ET AL. 158 Notice that the characteristics of this reliability enve- lope are similar to that of the DRM except that, on the same edge loss level, the efficiency losses of the SRM are less than that of the DRM, since we assume that the failure probability of an edge under a strike is 1 in the DRM. We can also observe from Table 2 that, for a given edge attacked level, the most important edges of protection are shown in volume 6. 5. Summary and Conclusions In this paper, we propose two types of scenario based facility location models in order to analyze the reliability of an existing ur done by placing extra s or tunnels which adding a surveil- dge failures to the efficiency of a facility sys- te the overall supplement of the facility system will de en solving the example since w be. facility system when subject to edge fail- es. We distinguish deterministic and stochastic cases to formulate and compute a specific example. Reliability envelopes in these two different cases are also given. The information in the reliability envelopes can be very use- ful in looking at ways to protect a facility system. Whe- ther the protection is against a natural disaster or inten- tional strike, reducing the probability of success even by modest amounts could have an impact on system effi- iency. For example, this could be c strength in key sections such as bridge paced in disaster-prone areas, or bys lance system with guards to help protect against an in- truder. Either techniques may not completely eliminate a loss, by reduce the edge failure probability to zero, but such strategies may generate more benefits in terms of improved expected system operating efficiencies than what it might cost. Therefore, the value of our analysis could lead to higher levels of safety as well as efficient levels of resource allocation for security measures (whether that involves a possible natural disaster or an attacker). While a large body of literature focus on the reliable and robust facility system design and analysis under component failures, the existing works are mainly con- centrated on the “node” (e.g., suppliers, distribution cen- ters) losses. To the best of our knowledge, researchers and practitioners have not paid enough attention to the impact of e Table 2. Results of the worst case SRM and the level Best-Case m by so far. Comparing to the related works done in this field, our work have at least the following innova- tions. Firstly, combining edge failures into facility systems reliability analysis is more realistic than only considering vertex failures. In fact, natural disasters or intentional attacks damage the edges of a facility system more easily. Secondly, in the PMP and other uncapacitated facility location problems, when one or more “nodes” have failed, crease dramatically but the total demand does not change. If in this situation all demands must to be met, then every node must has no any capacity limit. However, the capacity of nodes are designed a priori, when a vertex failure happen, how can it’ s adjacen t nodes guarantee the increased demands, let alone more than one vertex fail- ure occur simultaneously? The recovery time for a failed edge maybe shorter than that for a failed vertex, but this is not always the case. So we do not explicitly point out the time horizon in our models. In addition, the evaluation of edge failure prob- ability is important and difficult, and we will discuss this question in another work. We set the failure probability of all edges as the same wh e aimed to demonstrate the impact of edge failures to a facility system efficiency. Naturally, we need to consider the further research directions as follows. We assume that the edge failures are independent each other, but in practice, once an edge failed, the function of its adjacent edges will be impacted. Modeling the reli- able facility systems and related problems under this situation are worthy of study. st case SRM with edge failure probability 0.7 Worst-Case r Objec. Value Attacked Edges Efficiency Objec. Value Attacked Edges Efficiency 0 31,890.22 - 100% 31,890.22 - 100% 1 31,912.22 1 99.93 % 36,826.85 8 86.60 % 2 31,952.84 1,6 99.80 % 39,097.31 2,8 81.57 % 3 32,092.22 99.37 % 39,791.40 2,4,80.14 % 1,3,,6,7 2,3,47,8 1,2,3,6,7 2,3,4,7,8 8 39,993.41 1,2,3,4,5,6,7,8 79.74 % 39,993.41 1,2,3,4,5,6,7,8 79.74 % 31,995.07 1,3,6 99.67 % 39,469.42 2,4,8 80.80 % 4 1,3,5,6 7,8 5 32,390.03 1,3,4,5,6 98.46 % 39,888.56 2,4,5,7,8 79.95 % 6 32,712.01 4,59 7.49 %39,930.78 ,5,79.86 % 7 35,056.77 4,5,90.97 % 39,971.40 5,6,79.78 % Copyright © 2011 SciRes. OJDM 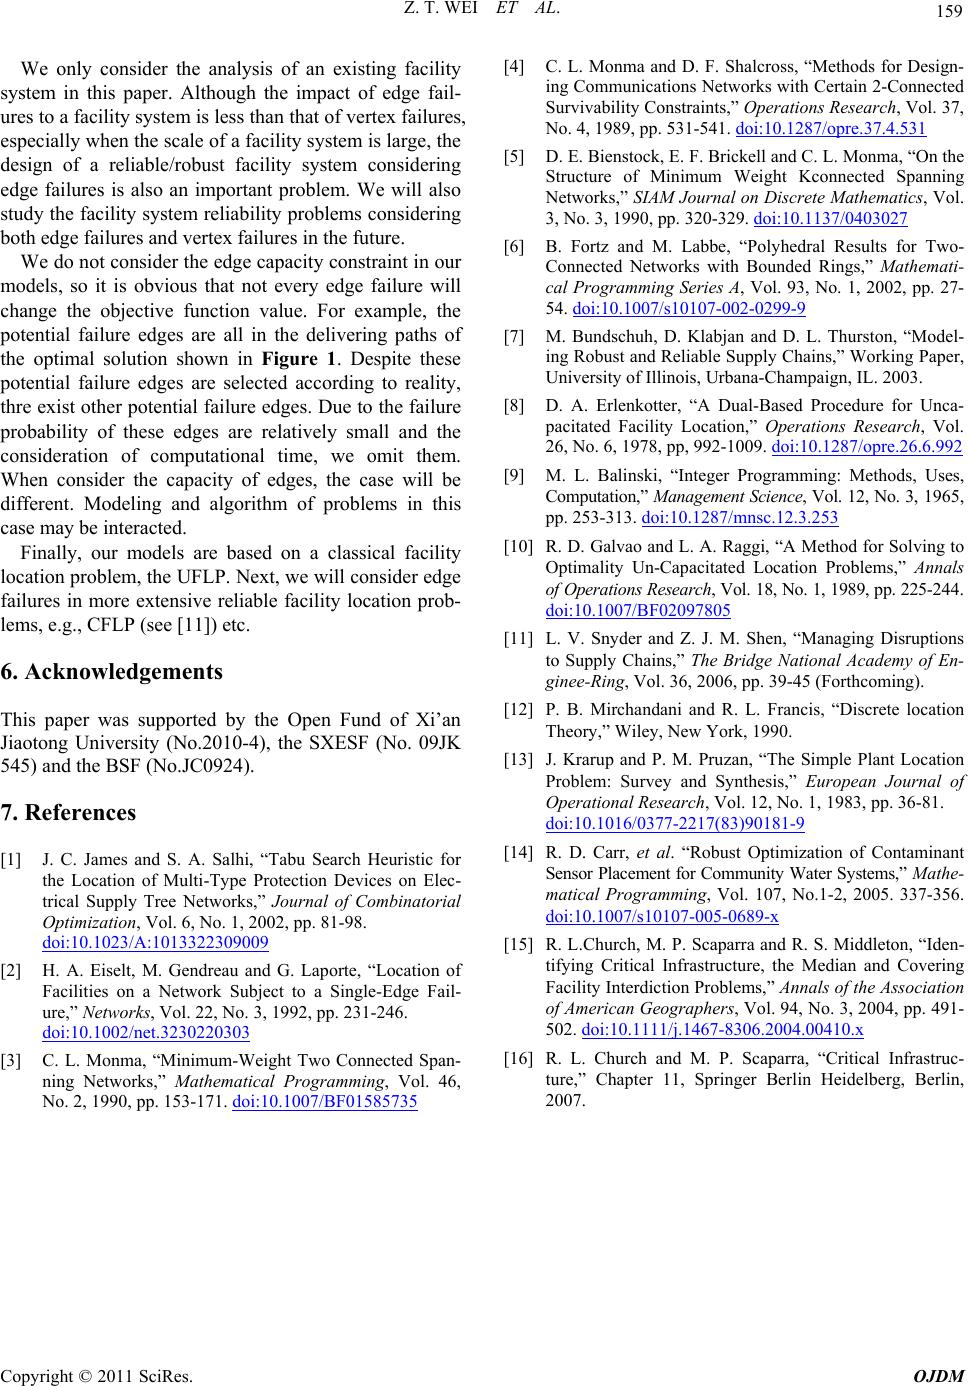 Z. T. WEI ET AL. 159 Wely coe analysis of an existiny systemn thislthough tpact of l- ures tofacili is less than that of vertes, especially when the stem is large, the design of a reliable/robust facility system cog edge failures iimportant problem. Weo study the facil reliams co both ee failuertex futu 54 lhi, “Tabu Search Heuristic Protection Devices on Elec- trical Supply Tree Networks,” Journal of Combinatorial onnsider thg facilit i paper. Ahe imedge fai a ty systemx failure scale of a facility synsiderin s also an will als ity systembility problensidering dgres and vfailures in the re. We do not consider the edge capacity constraint in our models, so it is obvious that not every edge failure will change the objective function value. For example, the potential failure edges are all in the delivering paths of the optimal solution shown in Figure 1. Despite these potential failure edges are selected according to reality, thre exist other potential failure edges. Due to the failure probability of these edges are relatively small and the consideration of computational time, we omit them. When consider the capacity of edges, the case will be different. Modeling and algorithm of problems in this case may be interacted. Finally, our models are based on a classical facility location problem, the UFLP. Next, we will consider edge failures in more extensive reliable facility location prob- lems, e.g., CFLP (see [11]) etc. 6. Acknowledgements This paper was supported by the Open Fund of Xi’an Jiaotong University (No.2010-4), the SXESF (No. 09JK 5) and the BSF (No.JC0924). 7. References [1] J. C. James and S. A. Sa the Location of Multi-Type for Optimization, Vol. 6, No. 1, 2002, pp. 81-98. doi:10.1023/A:1013322309009 [2] H. A. Eiselt, M. Gendreau and Facilities on a Network Subjec G. Laporte, “Location of t to a Single-Edge Fail- , Vol. 22, No. 3, 1992, pp. 231-246. t.3230220303 ure,” Networks doi:10.1002/ne [3] C. L. Monma, “Minimum-Weight Two Connected Span- ning Networks,” Mathematical Programming, Vol. 46, No. 2, 1990, pp. 153-171. doi:10.1007/BF01585735 [4] C. L. Monma D. F. Shalcross, “Methods for Design- Communis Networks with Certain 2-Connected ivability aints,” Operations Research, Vol. 37, 4, 1989,-541. doi:10.1287/opre.37.4.531 and ing Surv cation Constr No. pp. 531 . Bienst. Brickell and C. L. Monma, “On the cture m Weight Ked Spanning , Vol. o. 3, 1-329. doi:10.1137/0403027 [5] D. Eock, E. F Struof Minimuconnect Networks,” 3, NSIAM Journal on Discrete Ma 990, pp. 320thematics ortz e, “Polyhedral Results for Two- [6] B. Fand M. Labb Connected Networks with Bounded Rings,” Mathemati- cal Programming Series A, Vol. 93, No. 1, 2002, pp. 27- 54. doi:10.1007/s10107-002-0299-9 [7] M. Bundschuh, D. Klabjan and D. L. Thurston, “Model- , Vol. ing Robust and Reliable Supply Chains,” Working Paper, University of Illinois, Urbana-Champaign, IL. 2003. [8] D. A. Erlenkotter, “A Dual-Based Procedure for Unca- pacitated Facility Location,” Operations Research 26, No. 6, 1978, pp, 992-1009. doi:10.1287/opre.26.6.992 [9] M. L. Balinski, “Integer Programming: Methods, Uses, Computation,” Mana gement Science, Vol. 12, No. 3, 1965, pp. 253-313. doi:10.1287/mnsc.12.3.253 244. [10] R. D. Galvao and L. A. Raggi, “A Method for Solving to Optimality Un-Capacitated Location Problems,” Annals of Operations Research, Vol. 18, No. 1, 1989, pp. 225- doi:10.1007/BF02097805 [11] L. V. Snyder and Z. J. M. Shen, “Managing Disruptions to Supply Chains,” The Bridge National Academy of En- ginee-Ring, Vol. 36, 2006, pp. 39-45 (Forthcoming). [12] P. B. Mirchandani and R. L. Francis, “Discrete location Theory,” Wiley, New York, 1990. [13] J. Krarup and P. M. Pruzan, “The Simple Plant Location Problem: Survey and Synthesis,” European Journal of Operational Research, Vol. 12, No. 1, 1983, pp. 36-81. doi:10.1016/0377-2217(83)90181-9 56. [14] R. D. Carr, et al. “Robust Optimization of Contaminant Sensor Place ment for Community Water Syste ms,” Mathe- matical Programming, Vol. 107, No.1-2, 2005. 337-3 doi:10.1007/s10107-005-0689-x [15] R. L.Church, M. P. Scaparra and R. S. Middleton, “Iden- - 0410.x tifying Critical Infrastructure, the Median and Covering Facility Inte rdiction Problems, ” Annals of the Association of American Geographers, Vol. 94, No. 3, 2004, pp. 491 502. doi:10.1111/j.1467-8306.2004.0 [16] R. L. Church and M. P. Scaparra, “Critical Infrastruc- ture,” Chapter 11, Springer Berlin Heidelberg, Berlin, 2007. Copyright © 2011 SciRes. OJDM
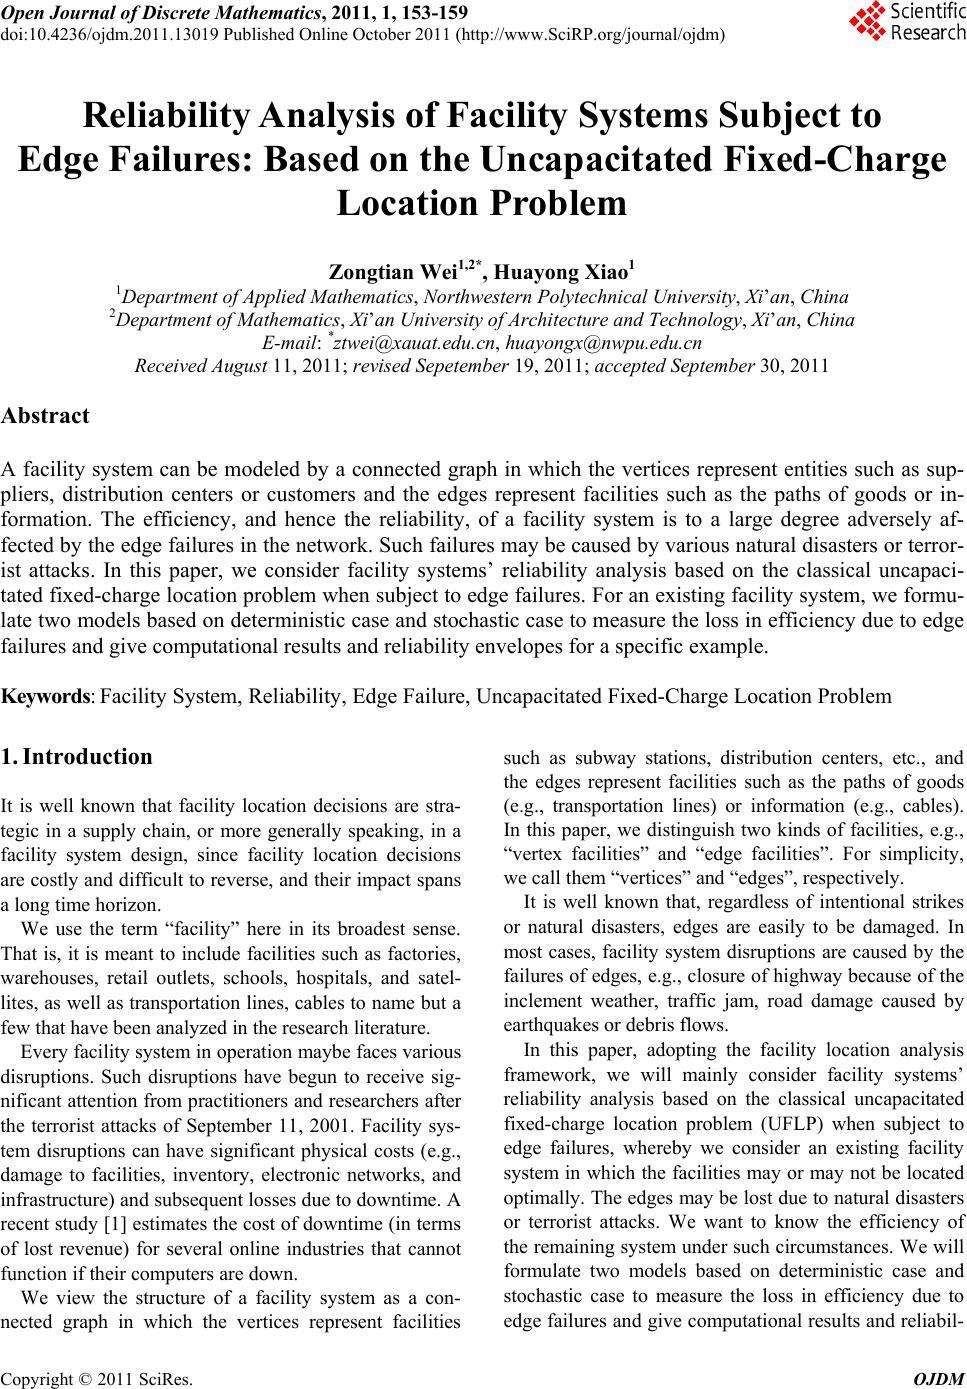
|