Paper Menu >>
Journal Menu >>
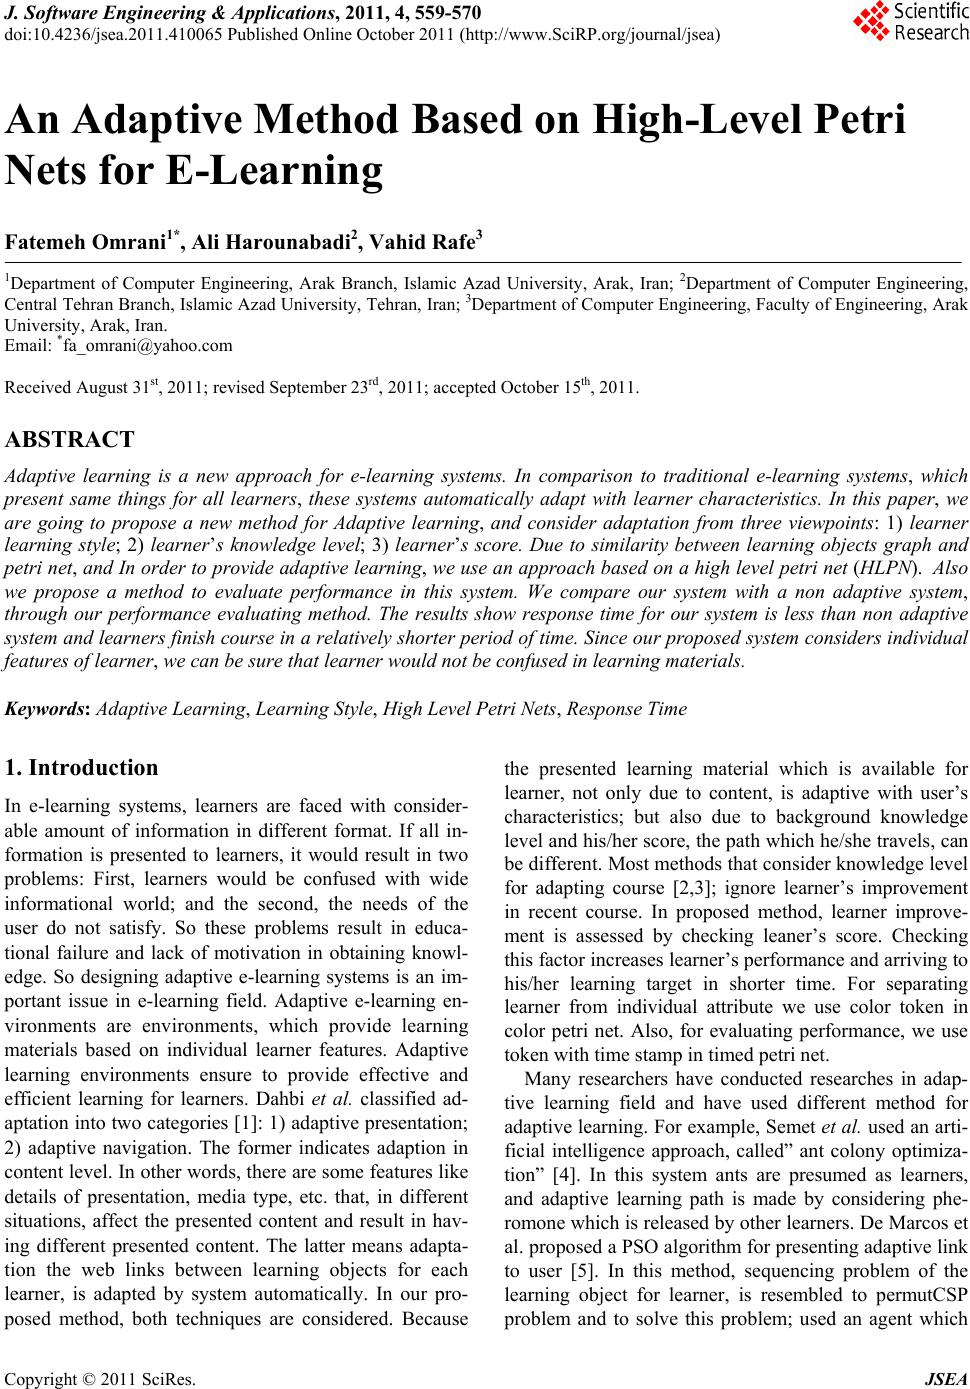 J. Software Engineering & Applications, 2011, 4, 559-570 doi:10.4236/jsea.2011.410065 Published Online October 2011 (http://www.SciRP.org/journal/jsea) Copyright © 2011 SciRes. JSEA 559 An Adaptive Method Based on High-Level Petri Nets for E-Learning Fatemeh Omrani1*, Ali Harounabadi2, Vahid Rafe3 1Department of Computer Engineering, Arak Branch, Islamic Azad University, Arak, Iran; 2Department of Computer Engineering, Central Tehran Branch, Islamic Azad University, Tehran, Iran; 3Department of Computer Engineering, Faculty of Engineering, Arak University, Arak, Iran. Email: *fa_omrani@yahoo.com Received August 31st, 2011; revised September 23rd, 2011; accepted October 15th, 2011. ABSTRACT Adaptive learning is a new approach for e-learning systems. In comparison to traditional e-learning systems, which present same things for all learners, these systems automatically adapt with learner characteristics. In this paper, we are going to propose a new method for Adaptive learning, and consider adaptation from three viewpoints: 1) learner learning style; 2) learner’s knowledge level; 3) learner’s score. Due to similarity between learning objects graph and petri net, and In order to provide adaptive learning, we use an approach based on a high level petri net (HLPN). Also we propose a method to evaluate performance in this system. We compare our system with a non adaptive system, through our performance evaluating method. The results show response time for our system is less than non adaptive system and learners finish course in a relatively shorter period of time. Since our proposed system considers individual features of learner, we can be sure that learner would not be confused in learning materials. Keywords: Adaptive Learning, Learning Style, High Level Petri Nets, Response Time 1. Introduction In e-learning systems, learners are faced with consider- able amount of information in different format. If all in- formation is presented to learners, it would result in two problems: First, learners would be confused with wide informational world; and the second, the needs of the user do not satisfy. So these problems result in educa- tional failure and lack of motivation in obtaining knowl- edge. So designing adaptive e-learning systems is an im- portant issue in e-learning field. Adaptive e-learning en- vironments are environments, which provide learning materials based on individual learner features. Adaptive learning environments ensure to provide effective and efficient learning for learners. Dahbi et al. classified ad- aptation into two categories [1]: 1) adaptive presentation; 2) adaptive navigation. The former indicates adaption in content level. In other words, there are some features like details of presentation, media type, etc. that, in different situations, affect the presented content and result in hav- ing different presented content. The latter means adapta- tion the web links between learning objects for each learner, is adapted by system automatically. In our pro- posed method, both techniques are considered. Because the presented learning material which is available for learner, not only due to content, is adaptive with user’s characteristics; but also due to background knowledge level and his/her score, the path which he/she travels, can be different. Most methods that consider knowledge level for adapting course [2,3]; ignore learner’s improvement in recent course. In proposed method, learner improve- ment is assessed by checking leaner’s score. Checking this factor increases learner’s performance and arriving to his/her learning target in shorter time. For separating learner from individual attribute we use color token in color petri net. Also, for evaluating performance, we use token with time stamp in timed petri net. Many researchers have conducted researches in adap- tive learning field and have used different method for adaptive learning. For example, Semet et al. used an arti- ficial intelligence approach, called” ant colony optimiza- tion” [4]. In this system ants are presumed as learners, and adaptive learning path is made by considering phe- romone which is released by other learners. De Marcos et al. proposed a PSO algorithm for presenting adaptive link to user [5]. In this method, sequencing problem of the learning object for learner, is resembled to permutCSP problem and to solve this problem; used an agent which  An Adaptive Method Based on High-Level Petri Nets for E-Learning 560 works based on PSO. Zhu et al. used a learning activity graph and allocated Boolean expression to every edge of graph [6]. This expression includes required precondition and post condition for traveling through this edge. If this expression is evaluated correctly, corresponding edge is traversed by learner. Chen et al. used “Item response the- ory” for providing individual learning path for each learner [7]. Manouselis et al. used multi-criteria decision making for automatic presentation of learning path in personalized environment [8]. Regarding similarity between learning object graph and petri net, some methods in adaptive learning field use various types of petri net. A dynamic fuzzy petri net (DFPN) was used for increasing flexibility of tutoring agent [9]. Tutoring agent is auxiliary software for helping individual user. Based on individual user behavior, the tutoring agent presents a different structure of learning content. Chang et al. used a Behavioral Browsing model (B2model) based on High level petri net (HLPN) which was made for modeling and generating behavioral pattern of students [10]. Object oriented course modeling based on High level petri net (HLPN) was proposed by Su et al. [11]. And one authoring tool was made based on pro- posed model. Liu et al. proposed an approach based on petri net for controlling learning path among learning activities [12]. Different learners learn in different ways. For example, someone learns by observation, someone learns by listening, someone learns by doing practices, someone learns by concentrating on principle, someone learns by concentrating on application, someone persists on “memorization” and someone prefers understanding. To provide adaptive learning some other researches have focused on learning style [13-15], but these methods are not formal and don’t evaluate performance by executable model. In comparison we use learning style factor for ad- aptation, and propose an executable model by using for- mal method. We use three factors for adaptation: 1) knowledge level; 2) learning style [16]; and 3) score. And we should add that none of the previous methods based on Petri net, such as [2,3], use learning style for adaptation; whereas this is a key factor in learner satisfaction. So we should say that this is an advantage for our method to consider it. In addition, in our system, we proposed a method to evaluate performance and we evaluated our system by it. Results show, by decreasing response time; performance increases. In evaluation section of this paper, we demon- strate in this system, learner with low knowledge level- by considering recent score by system can improve her/ his performance. Also we assert if system doesn’t use this method, decrease learner performance at high knowledge level and this would increase displeasure. The following sections are: Section 2 which explains definitions and primary concepts. In Section 3 we express the proposed method. In Section 4 we describe a case study. And then, we evaluate proposed method in Section 5. Finally, we finish paper with conclusion and future work in Section 6. 1.1. Definition and Primary Concepts Petri net—its primitive idea is presented by Carl Adam Petri in 60 s—is a graphical and mathematical tool that these mentioned characteristics make it easy to use and easy to present [17]. Figure 1 shows a simple example of petri net. A petri net is a 5-tuple [10,17]: 0 (;;; ;),PNPTA WM (1) where 1) 12 ,,, m Ppp p is a finite set of places. A place represents a circle, such as, p1, p2 and p3 in Figure 1. 2) 12 ,, , n Ttt t is a finite set of transitions. A transition represents a bar, such as t1 in Figure 1. The in- tersection of P and T is an empty set, while the union of P and T is not an empty set, i.e., P ∩ T = and T ∩ P = . 3) A PTT P is a set of arcs connecting places and transitions, such as the arrowhead from p1 to t1 depicted in Figure 1. 4) :1,2,3,WA is a weight function, whose weight value is positive integers. Arcs, i.e., arrowheads, are labeled with weights. For example, in Figure 1, the arrowhead from t1 to p3, which is labeled with 2, is de- noted as W (p2, t1) = 2. When the weight is unity and/or 1, the label of arc is usually omitted, e.g., W(p1, t1) = 1 is omitted in Figure 1. 5) 0:0,1,2,3,MP is the initial marking. If there are k tokens inside place pi, it is said that pi is marked with k tokens. For example, in Figure 1(a), p1 is marked with one token, which is denoted as M(p1) = 1. p2 is marked with two tokens, which is denoted as M(p2) = 2. If Figure 1(a) is the initial status, the initial marking is denoted as M0(p1, p2, p3) = 1, 2, 0. A transition t is said to be fired if all its input places pi are marked with at least W(pi, t) tokens, where W(pi, t) is called the firing condition of transition t. For example, in Figure 1, the firing conditions of t1 are W(p1, t1) = 1 and W(p2, t1) = 2. A firing transition t removes W(pi, t) tokens p 1 p 2 p 3 t 1 2 Before firing p 2 p 3 t 1 2 After firing p 1 PlaceTransition Token Arc (a) (b) 22 Figure 1. A petri net example. Copyright © 2011 SciRes. JSEA  An Adaptive Method Based on High-Level Petri Nets for E-Learning561 from each inpns to each e following years later, extensions of petri net su e so called color is allocated to Petri Net any types. In this paper ,we use a m, there is a user interface thod in learning object itial node and ch ut place pi, and adds W(t, pj) toke output place pj. For instance, since M(p1) = 1 and M(p2) = 2 have satisfied the firing conditions of t1 in Figure 1(a), t1 is fired. After t1 is fired as Figure 1(b) depicts, t1 has removed W(p1, t1) = 1 token from input place p1 of t1 and W(p2, t1) = 2 tokens from input place p2 of t1, respectively, and then added W(t1, p3)= 2 tokens to output place p3 of t1. In th ch as Colored petri net and timed petri net are made, which is called High level petri net(HLPN). In following, we describe these petri nets. 1.1.1. Colored Petri Net In colored petri net a valu each token. Transitions use the color of input tokens for determining the color of output tokens. Relation between input tokens and output tokens is presented by color consumption function or arc function that is depicted by E. for example in Figure 2, E functions are Ef (p1, t1) = a, Ef(t1, p2) = b. If a transition is fired, colored tokens re- moved from input places and new color tokens are pro- duced and placed in output places. In Figure 2(a), place p1 is marked with two colored tokens a, b from a color set {a, b, c}, denoted m(p1) = {a, b}. t1 is enabled as its input arc only requires one colored token a which is available in place p1. If fired, token a is removed from p1, two new colored tokens b and c are generated by t1’s output arcs and deposited in p2 and p3, respectively, as shown in Figure 2(b). 1.1.2. Timed Timed Petri nets have m kind of petri net in which each token is corresponded with a realvalued clock that is represented to token age [18,19]. Firing condition of transitions is like regular petri net. In addition, each arc which connects a transition to a place is labeled with real number which presents amount of age growth after transition firing. When a transition is fired, age of each token which has been added to output place of transition should be increased. Figure 3 shows a timed petri net. Each token labeled with a real number representing its age. Figure 3(a) shows the age of token in input place p1, that is 2. As shown in Figure 3(b), after firing t1, age of token which is added to output place p2, changes to 5. 1.2. Four Learning Style In a web based tutoring syste which its properties are similar to teacher’s, who provides learning materials for learner. These materials may have different styles such as audio, video and text or combina- tion of these styles. Drago et al. classify all these styles in four categories and called them (VARK) styles [16]. So, the place which is shown to learner should be appropriate with his/her learning style. By referring to user’s profile, we can extract the specific style that learner prefers it more than the other style. These styles are illustrated in Table 1. In our proposed model, we use colored token for determining learner’s learning style. To summarize im- plementation, we declare a 2 member set: “V” as visual and “RW” as Read/Write style. 2. Proposed Adaptive Me In our method, each learning object graph [20], which can be a chapter, a section or an exam- ple, is mapped to a place in petri net. Colored tokens are learners, and they travel through learning object via tran- sitions. Color of token checked by transitions and if con- dition is true, is allowed to move to the next node. So by this method, adaptive path is constructed. At the beginning of the path, we use in eck the learner’s learning style in this node by guard function of transition which is connected to this node. And according to individual value of learning style, we guide learner to individual path. Then, in each path, ac- cording to background knowledge level and obtained score, we decide the next node. p1a p2 p3 b c p1 p2 p3 t1t1a b c Colored token (a)Before fires(b)After fires t 1 t 1 Figure 2. Colored petrin ne t. (a) Beforefires(b) Afterfires t 1 p 1 2@+3 t 1 p 1 @+3 p 2 p 2 5 t 1 t 1 Figure 3. Timed petri net. Table 1. The vark style [15]. VARK Ley absorbed with the use of Learning arning wa Information is best way Visual Char Learn by ts, graphs, flow charts, symbols, arrows, hierarchies seeing Audio Lectures, verbal tutorials, tapes, Learn by Read/write Any text-based input and Learn by pr Kinesthetic Experience or pry, e.g. role playing by doing group discussion, speaking, talking things through hearing output ocessing text actice activitLearning Copyright © 2011 SciRes. JSEA  An Adaptive Method Based on High-Level Petri Nets for E-Learning 562 In our methoaal- cuonse timneed to cthe br d, we use token with time stmp for c lating respe. Also, we alculate owsing time in which a learner remains in a learning unit, the time that a learner undertakes an assessment and the time that a student remains in queue. Leaner arrives to system according to a Poisson process. So the time LT, at which the next learner will arrive is derived according to Poisson distribution [21] which is e, ! n tt LT n (2) where t refers to the time that a st queue before using system; λ refers t udent has stayed in o the rate of entrance, and since LT is used to determine the time when a learner arrives, we have n = 1. The browsing time that a learner stays in a learning unit is derived according to normal distribution [21], which is 2 1 2 e, B AVG BT (3) 2π where AVGB refers to the average le learner stays in a learning unit; α is th ngth of time that a e variation of time spent in a learning unit among learners; and δ represents the standard deviation of time spent in a learning unit among learners. The time that a learner is involved in answering and completing test question is derived according to normal distribution [21], which is, 2 1A AVG AT 2 e, 2π (4) where AVGA refers to the average test tim tion of time spent in a test node among l e; β is the varia- earners; and ρ represents the standard deviation of time spent in a test node among learners. The score that a learner has earned from a learning unit which has test; derived according to normal distribution [21], which is, 2 1S AVG 2 e Score , 2π (5) where AVGS refers to the average score o which has test; and γ represents the standar so f the fa nse time for each learner and show it in output te ion w ve time of learner, i.e., the tim collector monitor” for computing re- k box and associ- model. In other onse ciate it with final tion functions for f a learning unit d deviation of a learning unit which has test; and μ is the variation of score in a learning unit which has test among learners. We add an integer number to time stamp of new learner who enters to the system which represents her/his arrive time. This integer number is generated with Pois- n distributed function as we express in Equation (2). After that, for each learner who browses a learning unit we add a BT time which is computed via Equation (3). If a learning unit has test, we add a BT time which is com- puted via Equation (3) and an AT time which is com- puted via Equation (4) (AT + BT). At the end of the course for obtaining response time, we subtract arrive time (LT) from resent model time for each learner. In learning units (nodes) which have test we assigned a Score which is computed via Equation (4) to each learner who browses that learning unit. This score is one o ctors which are used for deciding to guide learner to the next unit. We compute response time in two viewpoints of white and black box. In viewpoint of black box, we calculate only respo xt file. Whereas, in viewpoint of white box, in addition to response time, we show traveled path, time spent for each middle learning unit, earned score in each test, learning style and knowledge level for each learner. We need several monitors for computing response time [22]. A monitor is a mechanism in CPN tool [23,24] which is used to observe, check and control simulat ithout changing petri net. In addition to colors, which show user’s features; we need several extra colors for computing response time. These colors are: 1) the arri e at which the learner arrived in the system; 2) the total amount of time that learner remains in system which is initialized to zero; 3) the learner path that represents unit which learner met them and initialized to null value; 4) the detail time that represents time spent in each unit of learning path. 2.1. Response Time in Black Box We use a “Data sponse time from the viewpoint of blac ated it with final transition in course words, the response time for a learner is measured when the token that is representative of the learner, is added to the final place of the model. After the learner finishes conclusion section of course; the observation function for the monitor, measures the total response time for learner. When final transition is fired, the total time for the learner is bound to the one color of token, and arrive time of token is one of token colors too. So the response time for learner is subtraction arrive time from total time. 2.2. Response Time in White Box We use a “write in file monitor” for computing resp time in viewpoint of white box and asso transition in course model. The observa the monitor print of all colors of each token and their response time in output text file. Copyright © 2011 SciRes. JSEA  An Adaptive Method Based on High-Level Petri Nets for E-Learning Copyright © 2011 SciRes. JSEA 563 f our proposed model. ourse, we consider a book as depicted - pl 3. Case study There are many tools for implementation of petri nets. or simulation oWe use CPN tool f For designing c in Figure 4. This book includes 2 chapters (content 1, content 2), 2 sections (content 1.1, content 2.1), 6 exam es, introduction and conclusion sections. The Learning objects graph [25], which is corresponded with this book is shown in Figure 5. We can map this graph to petri net by method which is expressed in [3]. The generated petri net is depicted in Figure 10 and Figure 12. Three basic color sets should be declared for our method in CPN tool: 1) learning style; 2) knowledge level; 3) score. In addi- tion, we need 4 extra color sets: 1) color set, LT, which is represented in arrive time; 2) color set, PATH, which is represented in traveled path by learner; 3) color set, De- tail Time, which is represented time spent in each middle unit in the course; 4) Process Time in which the total amount of time is represented that the learner stays in system. Since the learner includes all of these features (colors), we declare a compound color LEARNER which is the product of all of these colors. Also, we declare a “list color set”, named “Learners” for maintaining learn- ers in a FIFO queue when they are entered in the system. So, declaration of color set in CPN tool, is the one like Figure 6. As it is said in section 3, Leaner arrives to sys- tem according to a Poisson process. So, we use the arri- Introduction………………………………….. Content 1…………………………………….. Exa mp le1 …… ………… …… ………… …… . Example 2…………………………………… Content 1.1……………………………... Content 2……………………………………. Example 3…………………………………… Example 4…………………………………… Example 5….………………………………… Example 6………………………………….. Content 2.1………………………………. Conclusion………………………………….. Figure 4. A sample of book structure. vals subpaers as de- picted in Figure 7. The time stamp of the token on next ge to model the arrivals of new learn place in the Arrivals page determines the time at which the next learner will arrive. The Poisson function is used here to generate Poisson distributed in inter-arrival times with an average inter-arrival time of 120. Figure 5. Learning objects graph. Figure 6. Declaration of color set in CPN tool. Figure 7. Arrival subpage.  An Adaptive Method Based on High-Level Petri Nets for E-Learning 564 When a new learner arrives, the newLearner() function is used to create a token that represents a new learner. The declaration of the newLearner() function is depicted in Figure 8. When called, the newLearner() function re- turns a value from the LEARNER color set, i.e. it will return an 8-tuple as described above. The first component is the kind of the learning style, and using the Learn- g_Style.ran() function; it is chosen randomly n is guided to 2 individual paths. These 2 paths are the same course, but their content, due to its style, are presented with different media. For example if learner is a Vstyle user, the media is flash files, audio and video files. So, the main page of the model as depicts in Figure 9 have 2 substitute transitions: “RWstyle” and “Vstyle” which are associated with 2 subpages with same name. TVstyle uides learner to visual course; and RWstyle in o . The sec-transition g d component is the kind of the knowledge level and using the Knowledge_Level.ran(); it is chosen randomly. The third and fourth components are scores in content 1 and 2 of book, respectively. The fifth component is arrive time and the sixth component is the amount of total time that learner remains in system. The seventh component is learning path and eighth component is detail time that learner remains in each learning unit. The type of queue is FIFO, so the new learners are added to end of queue by “learners^^[learner]” arc inscription as depicts in Figure 7 and enter to system from first of queue by “learner:: learners” arc inscription in main page which is the top- level page in the model as depicts in Figure 9. The learning style of new learner is checked before entering to introduction node and based on its type; he/she he transition guides learners to text course based on their learning styles. fun newLearner()= (Learning_Style.ran(), Knowledge_Level.ran(), 0, 0, IntInf.toInt(time()), IntInf.toInt(time()), "", IntInf.toString(time())); Figure 8. The declaration of the newlearner() function. Figure 9. The main page. Copyright © 2011 SciRes. JSEA  An Adaptive Method Based on High-Level Petri Nets for E-Learning565 In both styles all learners (with any knowledge level) should pass introduction and content 1; based on course tutor’s suggestion. Since the content 1 is the chapter which includes the test, the learners should test, after passing content1 (LO1). After that―based on his/her score and knowledge level―learner are guided to 4 dif- ferent paths (because, in first decision making process based on learning style, after we determine the path, there are 2 factors which remain, so there are 22 paths). These stages are illustrated in Figure 10 which is RWstyle subpage. For determining which paths (from 4 paths) is appropriate to learner; he/she enters to transition “deci- sion making” and through this transition enters to the decision making subpage that is depicted in Figure 11. Figure 10. The Rstyle subpage. W Figure 11. Decision making subpage. Copyright © 2011 SciRes. JSEA  An Adaptive Method Based on High-Level Petri Nets for E-Learning 566 As you can see in the Figure 11, in subpage decision making, first system decides based on knowledge level and next decides based on score of content 1. After that, the learner comes back to RWstyle page. In RWstyle page as depicted in Figure 10, for example if the learner’s knowledge level is low and her/his score in con- tent 1 is equal or less than 10, learner should pass exam- ple1, example 2, content 1.1 (LO1_1), respectively. Whereas, if the learner’s knowledge level is high and her/his score in content 1 is more than 10, learner doesn’t need to pass the example 1 and example 2. After passing LO1-1, all learners (in 4 types) should pass content 2. For this purpose, learners go to subpage LO2 by firing transi- tion LO2. In subpage LO2, at first, based on knowledge level and score in LO1 by decision making11 subpage, which is similar to decision making subpage but does not call any function for assigning score, they divide. Next, learners go to decision making 2 subpage by firing transi- tion with the same name as depicted in Figure 12. In subpage decision making 2—based on their score in LO2 as depicted in Figure 13—learners are guided to 8 indi- vidual paths. Next they come back to LO2 page and based on their situation (one of 8 types) pass different nodes to conclusion node. Figure 12. ThO2 subpage. e L Copyright © 2011 SciRes. JSEA  An Adaptive Method Based on High-Level Petri Nets for E-Learning567 Figure 13. Decision making 2 subpage. 4. Evaluation In the proposed system, to evaluate efficiency of the pro- posed method, as defined in Table 2, we compute re- sponse time for 3 types of users and next compare them with response time for learners in non adaptive system. In non adaptive system, users don’t choose learning unit with awareness. The purposes of considering these 3 types of users are: 1) we want to demonstrate if user has high knowledge level (type 1), does not need to pass some units of the course, and so she/he arrives to end section in shorter time, whereas user may pass unnecessary units in regular system; 2) We want to demonstrate, if user has low know- ledge level but passes the course tests successfully (type 2), some learning units are ignored in his/her learning path and learner finishes course in shorter time whereas user may pass unnecessary units and does not pass nec- essary unit in regular system; 3) we want to demonstrate if learner has low knowledge level and does not pass current course learning tests with success, learner should pass all course units and can finish course in shorter time, whereas she/he may skip some units and spend more time in some units and this increases response time in non adaptive system. For computing response time in non adap we delete guard condition of transitions in adaptive sys- tems and allow learner choose arbitrary paths without con- straints. The simulation output in view of black box for adap- tive system is depicted in Figure 14. Each line of Figure 14 represented a learner. In each line, the first number is response time, the second number is learner number, the third number is step of simulation and fourth number is model time. For example in first line of Figure 14, first learner finished course in time 564 and it occurs in step 79 of simulation and model time has been 564. Since the Figure 14 is output in viewpoint of black box, type of learner, passed path and other details don’t show. For more detailed information, we use output in white box. The Figure 15 shows response time in viewpoint of white box. The information between each 2 lines is rep- resenting a learner. Table 2. User types. User type Learning style Score in content 1 Score in content 2 Type 1H more than 10 more than 10 Type 2L more than 10 more than 10 Type 3L equal or less than 10 equal or less than 10 tive system, Figure 14. Output in viewpoint of black box. Copyright © 2011 SciRes. JSEA  An Adaptive Method Based on High-Level Petri Nets for E-Learning 568 The first parameter is learner’s learning style, the sec- ond parameter is learner’s knowledge level, the third pa- rameter is learner’s score in content 1, the fourth pa- rameter is learner score in content 2, the fifth parameter is learner’s arrive time, the sixth parameter is total time of waiting in queue and remaining in system, the seventh parameter is passed path by learner and eighth parameter is the time spent by learners in each unit. The number after parenthesis is response time. For example first line is representing a learner with RWstyle and high knowl- edge level and his/her score in content 1 is 15 and in content 2 is 14. The arrive time for this user is 0 and total time is 564. The passed path by him/her is : “entersystem/selectRWstyle/Introduction/LO1/LO1 Testing/SelectHigh/selectLO1 Score>10/LO1_1/LO2/LO2 Testing/SelectHigh/LO2 Score>10/Example6/LO2_1/conclusion” And time spent by his/ her in each unit /60/5/5/59/66/67/5/5/46/127/30” nt which is shown in above line, each number represents the time period of corresponding sec- tion in passed path. The number 5s represent thinking times and other number represent time spent in learning units. For example the number 67 is representing the time of LO2 testing. Response time for learner which is sub- traction of arrive time from total time (564-0) is 564. In addition, total time means 564, equal to summation of times that are shown in eighth parameter. We summarize user types (is shown in Figure 14) and response time for adaptive and non adaptive system in Table 3. Table 3. Response time for different users. User type Response time in proposed system Response time in non adaptive system Type 1 564 686 is: “0/5/20/64 In the time spe Type 2 601 636 Type 3 708 759 Figure 15. Output in viewpoint o f white box. Copyright © 2011 SciRes. JSEA  An Adaptive Method Based on High-Level Petri Nets for E-Learning569 0 200 400 600 800 type1type2 ResponseTime Learner t ype3 prop ose dsystem Re gu l ar system ring for usFigure 16. Time com paer types. 0 20 40 60 Ti 80 me 100 120 140 introduction LO1 exa1 exa2 LO1_1 LO2 exa3 exa4 exa5 exa6 LO2_1 type1type2type3 Learner conclusion Figure 17. Detail time comparing for user types. We compare response time for all learners in adaptive system with non adaptive system in Figure 16. As de- picted in Figure 16 response time for all user type in adaptive system is shorter than users in non adaptive sys- tem. The Figure 17 is representing spent time in different course units in adaptive system. Since the time of deci- sion making in all cases is constant, we don’t show them in Figure 17. Some of learners, because of their features, don’t pass some units of course. But all learners pass main sections of course (Introduction, LO1, LO1_1, LO2, LO2_1, and conclusion). Some learners such as learner of type 3 is forced to pass all units of course as depicted in Figure 17. 5. Conclusions and Future Work We proposed an adaptive method for e-learning systems by high level petri net. We use colore entiating among learners with individual features. We use tokens with time stamp for computing time of tasks such as reading a learning unit or time of a test. We implement method for a sample course and analyze results. From 16 learner types in sample course, all of them have response time that was shorter than learner in non adaptive system. So, we can say this method increases performance. This method has many advantages. For example for- mal semantic of petri net provides a formal method for adaptation. Also graphic presentation in petri net, facili- tates understanding of method; even for unfamiliar peo- ple with petri net. As future work, we want to examine proposed method in real course and analyze user’s satisfaction and success. Also in many recommending systems such as search en- gine or electronic shop, in which user’s individual fea- tures are important, this method can be used for adapta- d tokens for differ-tion. Copyright © 2011 SciRes. JSEA  An Adaptive Method Based on High-Level Petri Nets for E-Learning 570 REFERENCES [1] A. Dahbi, N. Elkamoun and A. Berraissoul, “Adaptation and Optimisation of Pedagogical Paths by Ants’s Algo- rithm,” ICTTA’06, 2nd Information and Communication Technologies, Damascus, October 2006, pp. 546-551. [2] S. Gao and R. Dew, “Enhancing Web-Based Adaptive Learning with Colored Timed Petri Net,” Lecture Notes in Computer Science, Vol. 4798, 2007, pp. 177-185. doi:10.1007/978-3-540-76719-0_20 [3] S. Gao, Z. Zhang and I. Hawryszkiewycz, “Supporting Adaptive Learning in Hypertext Env Level Timed Petri Net-Based Approach,” International Journal of Intelligent Systems Technologies and Applica- tions, Vol. 4, No. 3-4, 2008, pp. 341-354. doi:10.1504/IJISTA.2008.017277 ironments: A High [4] Y. Semet, E. Lutton and P. Collet, “Ant Colony Optimisa- tion for E-Learning: Observing the Emergence of Peda- gogic Suggestions,” Proceedings of the 2003 IEEE Swarm Intelligence Symposium, Indianapolis, 24-26 April 2003, pp. 46-52. [5] L. de Marcos, J. J. Martínez and J. A. Gutierrez, “Swarm Intelligence in E-Learning: A Learning Object Sequenc- ing Agent Based on Competencies,” Proceedings of the 10th Annual Conference on Genetic and Evolutionary Computation, Atlanta, 12-16 July 2008, pp. 17-24. [6] F. Zhu and J. Cao, “Learning Activity Sequencing in Per- sonalized Education System,” Wuhan University Journal of Natural Sciences, Vol. 13, No. 4, 2008, pp. 461-465. doi:10.1007/s11859-008-0416-6 [7] C. M. Chen, H. M. Lee and Y. H. Chen, “Personalized E-Learning System Using Item Response Theory,” Com- puters & Education, Vol. 44, No. 3, 2005, pp. 237-255. doi:10.1016/j.compedu.2004.01.006 [8] N. Manouselis and D. Sampson, “Dynamic Knowledge Rou- te Selection for Personalised Learning Environments Using Multiple Criteria,” 20th IASTED In in Applied Informatics, Innsbruck, 1 ternational Conference 8-21 February 2002, pp. 448-453. [9] J.-N. Chen, Y.-M. Huang and W. C.-C. Chu, “Applying Dynamic Fuzzy Petri Net to Web Learning System,” In- teractive Learning Environments, Vol. 13, No. 3, 2005, pp. 159-178. doi:10.1080/10494820500382810 [10] Y. C. Chang, Y. C. Huang and C. P. Chu, “B2 Model: A Browsing Behavior Model Based on High-Level Petri Nets to Generate Behavioral Patterns for E-Learning,” Expert Systems with Applications, Vol. 36, No. 10, 2009, pp. 12423-12440. doi:10.1016/j.eswa.2009.04.044 [11] J. M. Su, S. S. Tseng, C. Y. Chen, J. F. Weng and W. N. Tsai, “Constructing SCORM Compliant Course Based on High-Level Petri Nets,” Computer Standards & Interfaces, Vol. 28, No. 3, 2006, pp. 336-355. doi:10.1016/j.csi.2005.04.001 [12] X. Q. Liu, M. Wu and J. X. Chen, “Knowledge Aggreg tion and Navigation High-Level Petri N a- ets-Based in E- ing and Cybernetics, Vol. 1, 2002, pp. 420-425. [13] R. M. Felder and L. K. Silverman, “Learning and Teach- ing Styles in Engineering Education,” Engineering Edu- cation, Vol. 78, No. 7, 1988, pp. 674-681. [14] P. García, A. Amandi, S. Schiaffino and M. Campo, “Eva- luating Bayesian Networks’ Precision for Detecting Stu- dents’ Learning Styles,” Computers & Education, Vol. 49, No. 3, 2007, pp. 794-808. doi:10.1016/j.compedu.2005.11.017 [15] T. I. Wang, K. T. Wang and Y. M. Huang a Style- ny System for Adaptive Learning,” Expert , Vol. 34, No. 4, 2008, pp. 2449-2464. doi:10.1016/j.eswa.2007.04.014 Learning,” International Conference on Machine Learn- g, “Usin Based Ant Colo Systems with Applications [16] W. A. Drago and R. J. Wagner, “Vark Preferred Learning Styles and Online Education,” Management Research News, Vol. 27, No. 7, 2004, pp. 1-13. doi:10.1108/01409170410784211 [17] T. Murata, “Petri Nets: Properties, Analysis and Applica- tions,” Proceedings of the IEEE, Vol. 77, No. 4, 1989, pp. 541-580. [18] P. Abdulla and A. Nylén, “Timed Petri Nets and BQOs,” Applications and Theory of Petri Nets, Vol. 2075, 2001, pp. 53-70. doi:10.1007/3-540-45740-2_5 [19] S. Christensen, L. Kristensen and T. Mailund, “Con- densed State Spaces for Timed Petri Nets,” Proceedings of the 22nd International Conference on Application and Theory of Petri Nets, Newcastle, 25-29 June 2001, pp. 101-120. [20] R. S. Shaw, “A Study of Learning Performance of E-Learn- ing Materials Design with Knowledge Maps,” Computers & Education, Vol. 54, No. 1, 2010, pp. 253-264. doi:10.1016/j.compedu.2009.08.007 [21] R. E. Walpole, R. H. Myers, S. L. Myers and K. Ye, “Probability and Statistics for Engineers and Scientists,” 7th Edition, Prentice Hall, Upper Saddle R ver, 2002. ance Analysis Using Coloured Petri Nets,” 10th IEEE International Symposium on Modeling, i [22] L. Wells, “Perform Analysis and Simulation of Computer and Telecommunica- tions Systems, Fort Worth, 11-16 October 2002, pp. 217-221. [23] K. Jensen, L. M. Kristensen and L. Wells, “Coloured Petri Nets and CPN Tools for Modelling and Validation of Concurrent Systems,” International Journal on Software Tools for Technology Transfer, Vol. 9, No. 3-4, 2007, pp. 213-254. doi:10.1007/s10009-007-0038-x [24] A. Ratzer, L. Wells, H. Lassen, M. Laursen, J. Qvortrup, M. Stissing, M. Westergaard, S. Christensen and K. Jen- sen, “CPN Tools for Editing, Simulating, and Analysing Coloured Petri Nets,” Proceedings of the 24th Interna- tional Conference on Applications and Theory of Petri Nets, Eindhoven, 23-27 June 2003, pp. 450-462. [25] R. S. Shaw, “A Study of Learning Performance of E- Learning Materials Design with Knowledge Maps,” Com- puters & Education, Vol. 54, No. 1, 2010, pp. 253-264. doi:10.1016/j.compedu.2009.08.007 Copyright © 2011 SciRes. JSEA |