Paper Menu >>
Journal Menu >>
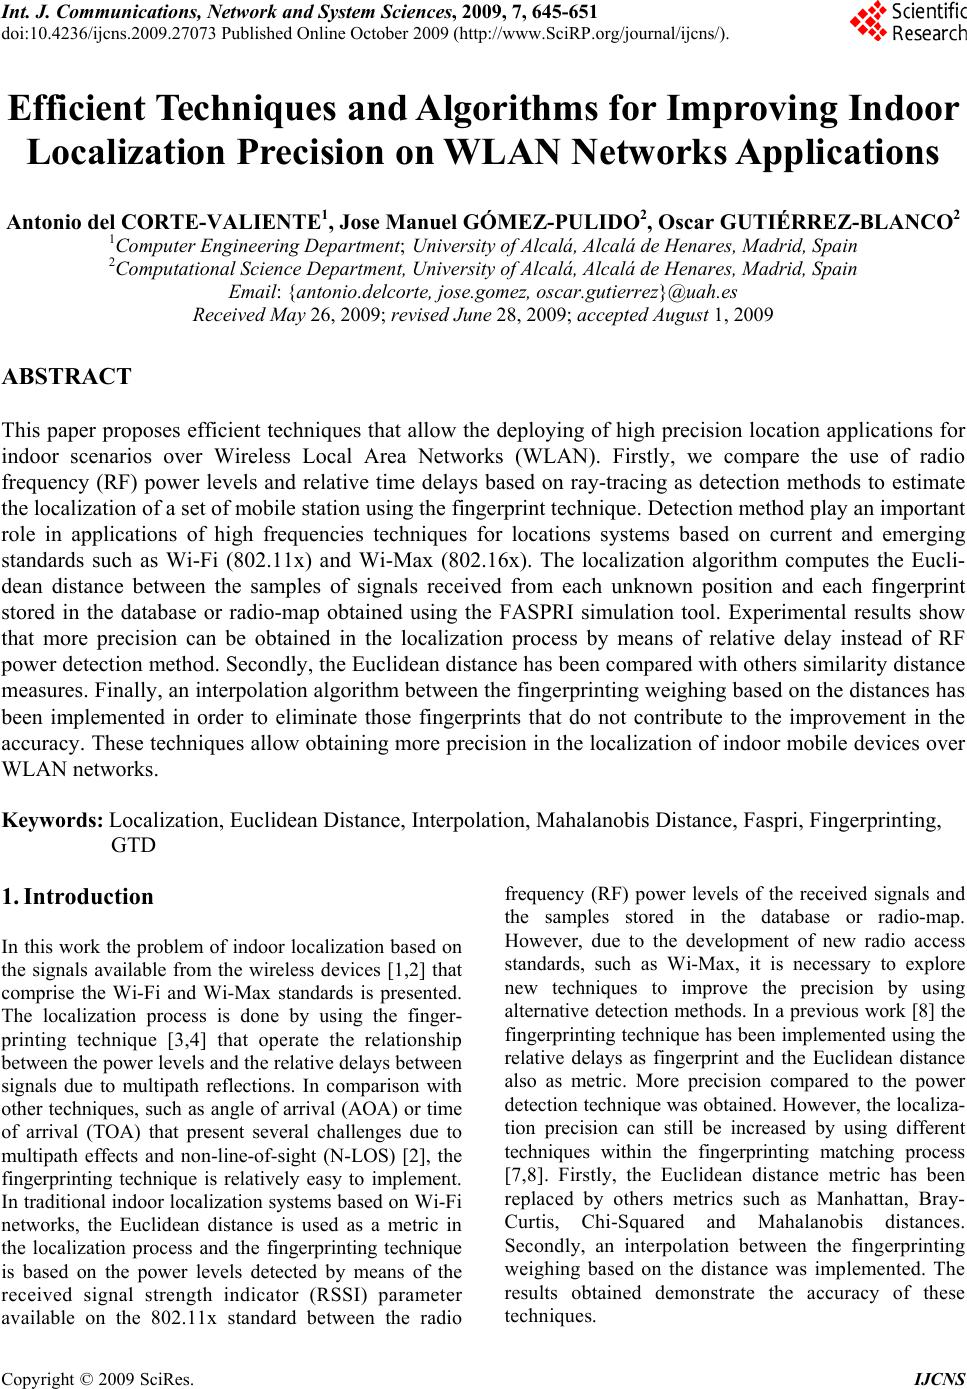 Int. J. Communications, Network and System Sciences, 2009, 7, 645-651 doi:10.4236/ijcns.2009.27073 Published Online October 2009 (http://www.SciRP.org/journal/ijcns/). Copyright © 2009 SciRes. IJCNS Efficient Techniques and Algori thms for Improving Indoor Localization Precision on WLAN Networks Applications Antonio del CORTE-VALIENTE1, Jose Manuel GÓMEZ-PULIDO2, Oscar GUTIÉRREZ-BLANCO2 1Computer Engineering Department; University of Alcalá, Alcalá de Henares, Madrid, Spain 2Computational Science Department, University of Alcalá, Alcalá de Henares, Madrid, Spain Email: {antonio.delcorte, jose.gomez, oscar.gutierrez}@uah.es Received May 26, 200 9; revised June 28, 2009; accepted August 1, 2009 ABSTRACT This paper proposes efficient techniques that allow the deploying of high precision location applications for indoor scenarios over Wireless Local Area Networks (WLAN). Firstly, we compare the use of radio frequency (RF) power levels and relative time delays based on ray-tracing as detection methods to estimate the localization of a set of mobile station using the fingerprint technique. Detection method play an important role in applications of high frequencies techniques for locations systems based on current and emerging standards such as Wi-Fi (802.11x) and Wi-Max (802.16x). The localization algorithm computes the Eucli- dean distance between the samples of signals received from each unknown position and each fingerprint stored in the database or radio-map obtained using the FASPRI simulation tool. Experimental results show that more precision can be obtained in the localization process by means of relative delay instead of RF power detection method. Secondly, the Euclidean distance has been compared with others similarity distance measures. Finally, an interpolation algorithm between the fingerprinting weighing based on the distances has been implemented in order to eliminate those fingerprints that do not contribute to the improvement in the accuracy. These techniques allow obtaining more precision in the localization of indoor mobile devices over WLAN networks. Keywords: Localization, Euclidean Distance, Interpolation, Mahalanobis Distance, Faspri, Fingerprinting, GTD 1. Introduction In this work the problem of indoor localization based on the signals available from the wireless devices [1,2] that comprise the Wi-Fi and Wi-Max standards is presented. The localization process is done by using the finger- printing technique [3,4] that operate the relationship between the power lev els and the relativ e delays between signals due to multipath reflections. In comparison with other techniques, such as angle of arrival (AOA) or time of arrival (TOA) that present several challenges due to multipath effects and non-line-of-sight (N-LOS) [2], the fingerprinting technique is relatively easy to implement. In traditional indoor localization systems based on Wi-Fi networks, the Euclidean distance is used as a metric in the localization process and the fingerprinting technique is based on the power levels detected by means of the received signal strength indicator (RSSI) parameter available on the 802.11x standard between the radio frequency (RF) power levels of the received signals and the samples stored in the database or radio-map. However, due to the development of new radio access standards, such as Wi-Max, it is necessary to explore new techniques to improve the precision by using alternative detection methods. In a previous work [8] the fingerprinting technique has been implemented using the relative delays as fingerprint and the Euclidean distance also as metric. More precision compared to the power detection technique was obtained. However, the localiza- tion precision can still be increased by using different techniques within the fingerprinting matching process [7,8]. Firstly, the Euclidean distance metric has been replaced by others metrics such as Manhattan, Bray- Curtis, Chi-Squared and Mahalanobis distances. Secondly, an interpolation between the fingerprinting weighing based on the distance was implemented. The results obtained demonstrate the accuracy of these techniques. 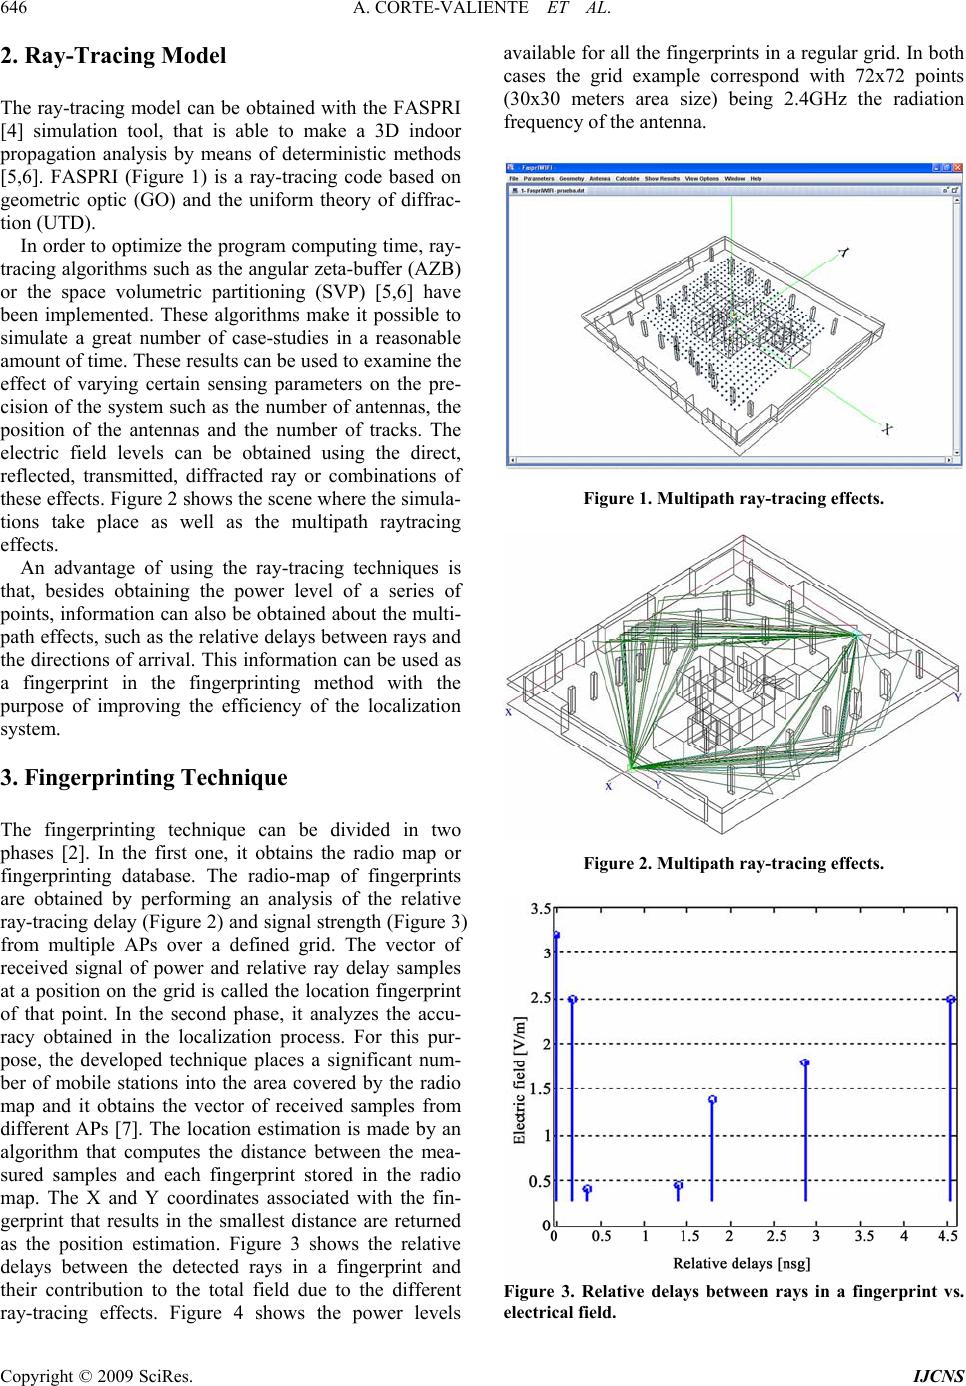 A. CORTE-VALIENTE ET AL. Copyright © 2009 SciRes. IJCNS 646 2. Ray-Tracing Model The ray-tracing model can be obtained with the FASPRI [4] simulation tool, that is able to make a 3D indoor propagation analysis by means of deterministic methods [5,6]. FASPRI (Figure 1) is a ray-tracing code based on geometric optic (GO) and the uniform theory of diffrac- tion (UTD). In order to optimize the program computing time, ray- tracing algorithms such as the angular zeta-buffer (AZB) or the space volumetric partitioning (SVP) [5,6] have been implemented. These algorithms make it possible to simulate a great number of case-studies in a reasonable amount of time. These results can be used to examine the effect of varying certain sensing parameters on the pre- cision of the system such as the number of antennas, the position of the antennas and the number of tracks. The electric field levels can be obtained using the direct, reflected, transmitted, diffracted ray or combinations of these effects. Figure 2 shows the scene where the simula- tions take place as well as the multipath raytracing effects. An advantage of using the ray-tracing techniques is that, besides obtaining the power level of a series of points, information can also be obtained about the multi- path effects, such as the relative delays between rays and the directions of arrival. This information can be used as a fingerprint in the fingerprinting method with the purpose of improving the efficiency of the localization system. 3. Fingerprinting Technique The fingerprinting technique can be divided in two phases [2]. In the first one, it obtains the radio map or fingerprinting database. The radio-map of fingerprints are obtained by performing an analysis of the relative ray-tracing d elay (Figu re 2) and signal strength (Figure 3) from multiple APs over a defined grid. The vector of received signal of power and relative ray delay samples at a position on the grid is called the location fingerprint of that point. In the second phase, it analyzes the accu- racy obtained in the localization process. For this pur- pose, the developed technique places a significant num- ber of mobile stations into the area covered by the radio map and it obtains the vector of received samples from different APs [7]. The location estimation is made by an algorithm that computes the distance between the mea- sured samples and each fingerprint stored in the radio map. The X and Y coordinates associated with the fin- gerprint that results in the smallest distance are returned as the position estimation. Figure 3 shows the relative delays between the detected rays in a fingerprint and their contribution to the total field due to the different ray-tracing effects. Figure 4 shows the power levels available for all the fingerprints in a regular grid. In both cases the grid example correspond with 72x72 points (30x30 meters area size) being 2.4GHz the radiation frequency of the antenna. Figure 1. Multipath ray-tracing effects. Figure 2. Multipath ray-tracing effects. Figure 3. Relative delays between rays in a fingerprint vs. electrical field. 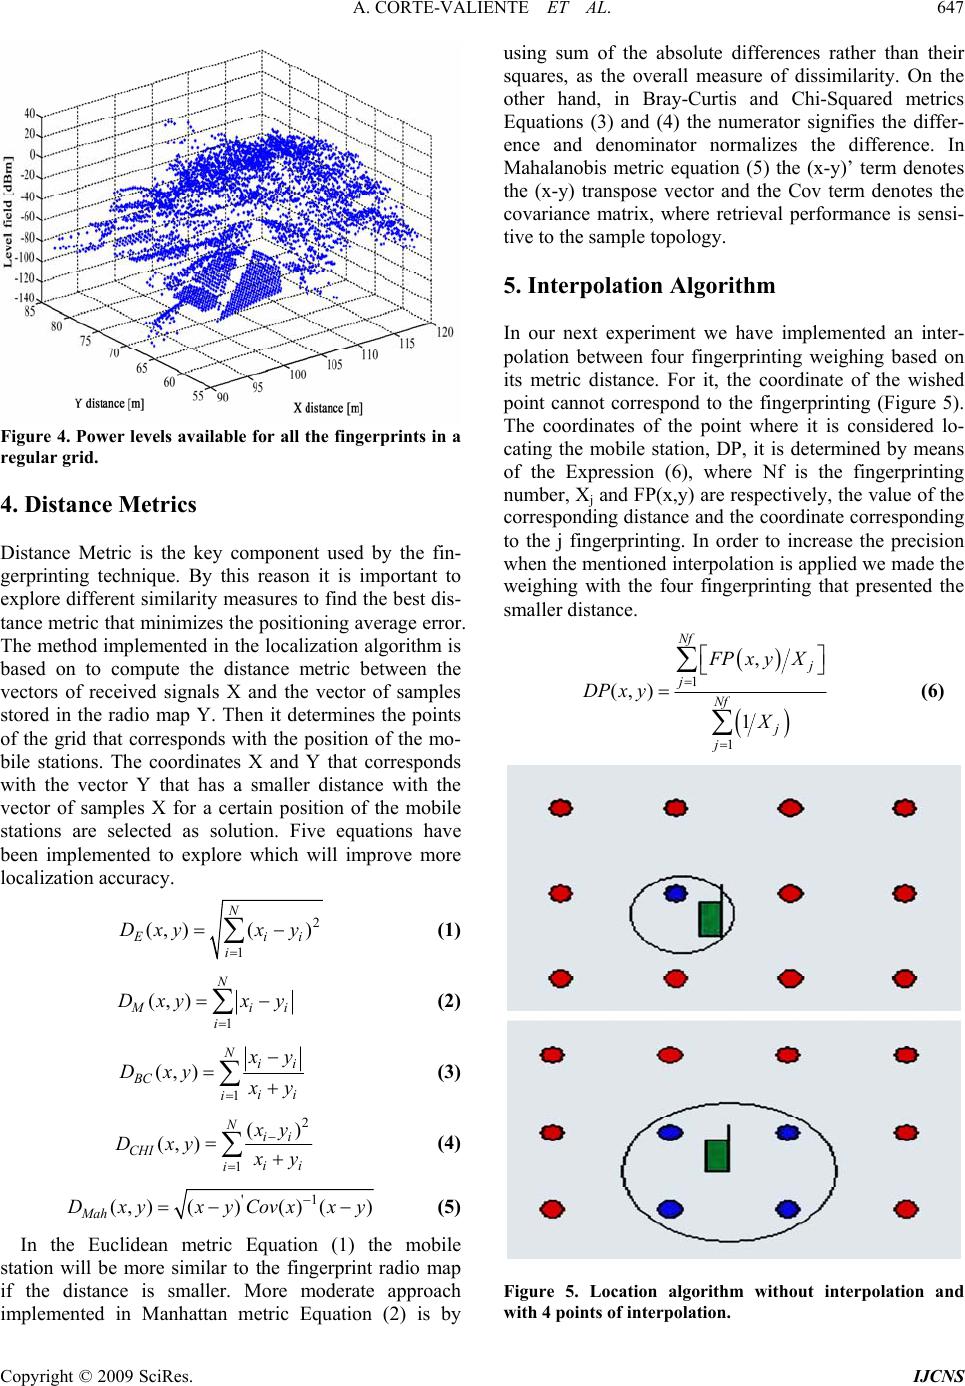 A. CORTE-VALIENTE ET AL. Copyright © 2009 SciRes. IJCNS 647 Figure 4. Power levels available for all the fingerprints in a regular grid. 4. Distance Metrics Distance Metric is the key component used by the fin- gerprinting technique. By this reason it is important to explore different similarity measures to find the best dis- tance metric that minimizes the po sitioning average error. The method implemented in the localization algorithm is based on to compute the distance metric between the vectors of received signals X and the vector of samples stored in the radio map Y. Then it determines the points of the grid that corresponds with the position of the mo- bile stations. The coordinates X and Y that corresponds with the vector Y that has a smaller distance with the vector of samples X for a certain position of the mobile stations are selected as solution. Five equations have been implemented to explore which will improve more localization accuracy. 2 1 (, )() N Eii i Dxyx y (1) 1 (, )N M ii i Dxy xy (2) 1 (,) Nii BC ii i x y Dxy x y (3) 2 1 () (, )Nii CHI ii i x y Dxy x y (4) '1 (,)( )()( ) Mah DxyxyCovxxy (5) In the Euclidean metric Equation (1) the mobile station will be more similar to the fingerprint radio map if the distance is smaller. More moderate approach implemented in Manhattan metric Equation (2) is by using sum of the absolute differences rather than their squares, as the overall measure of dissimilarity. On the other hand, in Bray-Curtis and Chi-Squared metrics Equations (3) and (4) the numerator signifies the differ- ence and denominator normalizes the difference. In Mahalanobis metric equation (5) the (x-y)’ term denotes the (x-y) transpose vector and the Cov term denotes the covariance matrix, where retrieval performance is sensi- tive to the sample topology. 5. Interpolation Algorithm In our next experiment we have implemented an inter- polation between four fingerprinting weighing based on its metric distance. For it, the coordinate of the wished point cannot correspond to the fingerprinting (Figure 5). The coordinates of the point where it is considered lo- cating the mobile station, DP, it is determined by means of the Expression (6), where Nf is the fingerprinting number, Xj and FP(x,y) are respectively, the value of the corresponding distance and the coordinate corresponding to the j fingerprinting. In order to increase the precision when the mentioned interpolation is applied we made the weighing with the four fingerprinting that presented the smaller distance. 1 1 , (, ) 1 Nf j j Nf j j F Pxy X DP x y X (6) Figure 5. Location algorithm without interpolation and with 4 points of interpolation.  A. CORTE-VALIENTE ET AL. Copyright © 2009 SciRes. IJCNS 648 In this way we will eliminate those fingerprints that, due to the great distance to the objective point, present a higher distance and therefore do not contribute to the improvement in the accuracy. 6. RF Power vs. Relative Delay Detection Method In this case we compare the use of radio frequency (RF) power levels and relative time delays based on ray-trac- ing as detection methods to estimate the localization of set of mobile stations using the fingerprint technique. The metric considered was the Euclidean distance. The information provided by the simulation tool is stored in four vectors. Two of them, Ph and Th, correspond to the information at every fingerprint. The first vector contains the power level from the N access points at the finger- print h and the second one contains the relative delay at the same point. The Pm and Tm vectors contain the same information at the mobile station m (Expressions 7 to 10). 123 ,,,..., N PhPh PhPhPh (7) 123 ,,,..., N ThThThThTh (8) 123 ,,,..., N PmPm PmPmPm (9) 123 ,,,..., N TmTmTmTmTm (10) These vectors are calculated at the beginning of the process and are stored in a database. The Euclidian dis- tance between each mobile station and every finger- printing is calculated using the Expression (11) where the parameter v is a weighting factor that indicates the correlation ratio between the powers and delays. This factor is set to 0 to find the distance by using the power levels, set to 1 to find the distance by using the relative delays and set to 0.25 to find the distance with a hybrid method of the power and delays. The position of the mo- bile corresponds with the fingerprint whose Euclidean distance is smaller. 22 1 ,(1)()() N ii ii i DxyPmPhTm Th (11) The number of fingerprints and the frequency are pa- rameters that would affect the precision of the results. For this reason the experiment considers two grids: one consisting of 72x72 fingerprints and another composed of 36x36, as well as two different frequencies: 2.4GHz and 5.2GHz. The distance between the fingerprints in the first and second grids are 40cm and 80cm, respectively. The simulation also placed 9 AP’s at the above-men- tioned frequencies and 99 mobile stations randomly dis- tributed over the grids. Figure 6 shows the area of 28.8x28.8 meters where the simulations have been done. In order to evaluate the benefits of the detection method Figure 6. Regular grid example. Figure 7. Detection methods comparison – Frequency of 2.4GHz. two statistical indicators have been used. These indica- tors are the total mean error and the total mean d eviation (standard deviation). Data obtained after the FASPRI simulations have been analyzed under MATLAB. Figure 7 shows the results obtained at 2,4GHz and Figure 8 the results obtained at 5,2GHz. In both graphs the three de- tection methods analyzed are compared by means of the statistical indicators. With these results, we can confirm that the relative delay detection method provides better results than the power detection method for any grid size and frequency. The hybrid detection, although it provides worse results than using delays, can reduce the detection ambiguity at the cost of increasing the mean error. However, it should be noted that the mean error is re- duced when the number of fingerprints is increased for the same frequency, independent of the detection method used. In addition, as far as the impact of the frequency used with the detection method is concerned, we can  A. CORTE-VALIENTE ET AL. Copyright © 2009 SciRes. IJCNS 649 observe that, the mean error is lower at 2,4GHz using power detection; however, it stays constant when using delay and hybrid detections. Therefore, the grid density is a more critical factor than the frequency. Table 1 shows the mean error and standard deviation values ob- tained when comparing the three detection methods. The two last columns of the table present the percentage of the mean error that is possible to improve when using either hybrid versus power detection and delay versus power detection. Finally, the results obtained have been analyzed with a statistical point of view. The probability error was calculated by using the position error of the 99 mobiles. Figures 9, 10 and 11 shows the probability error distribution for the three methods analyzed in the case of 72x72 grid size for 2.4GHz. It should be noted that the error distribution function reduces extremely by using delay detection compared with power or hybrid detection methods. 7. Distance Metric Comparison and Interpolation Algorithm Effect Distance Metric is the key component used by the fin- gerprinting technique. By this reason, it is important to Table 1. Mean error and typical deviation detection meth- ods comparison. Power Detection Hybrid Detection Delay Detection Hybrid vs. Power Delay vs. Power Grid size and Fre- quency Mean error [m] Typical deviation [m] Mean error Improvement (%) 72x72 2.4GHz 1,9554 0,1871 0,5621 0,0821 0,2504 0,0366 71.28 87.17 72x72 5.2GHz 2,0844 0,1843 0,5207 0,0841 0,2504 0,0366 75.00 87.98 36x36 2.4GHz 1,9801 0,2029 1,1337 0,1610 0,5155 0,0572 32.82 74.24 36x36 5.2GHz 2,5275 0,2548 0,9497 0,1142 0,5155 0,0572 62.69 75.48 Figure 8. Detection methods comparison–frequency of 5.2GHz. Figure 9. Probability error distribution – power detection. Figure 10. Probability error distribution – hybrid detection. Figure 11. Probability error distribution – relative delay detection. explore different similarity measures to find the best distance metric. Five equations have been implemented to explore which will improve more localization accu- racy: Euclidean, Manhattan, Bray-Curtis, Chi-Squared and Mahalanobis distance. In this case the relative delay detection method was been implemented in the finger- printing algorithm. Finally an interpolation of the four best distances has been added. An irregular geometry of 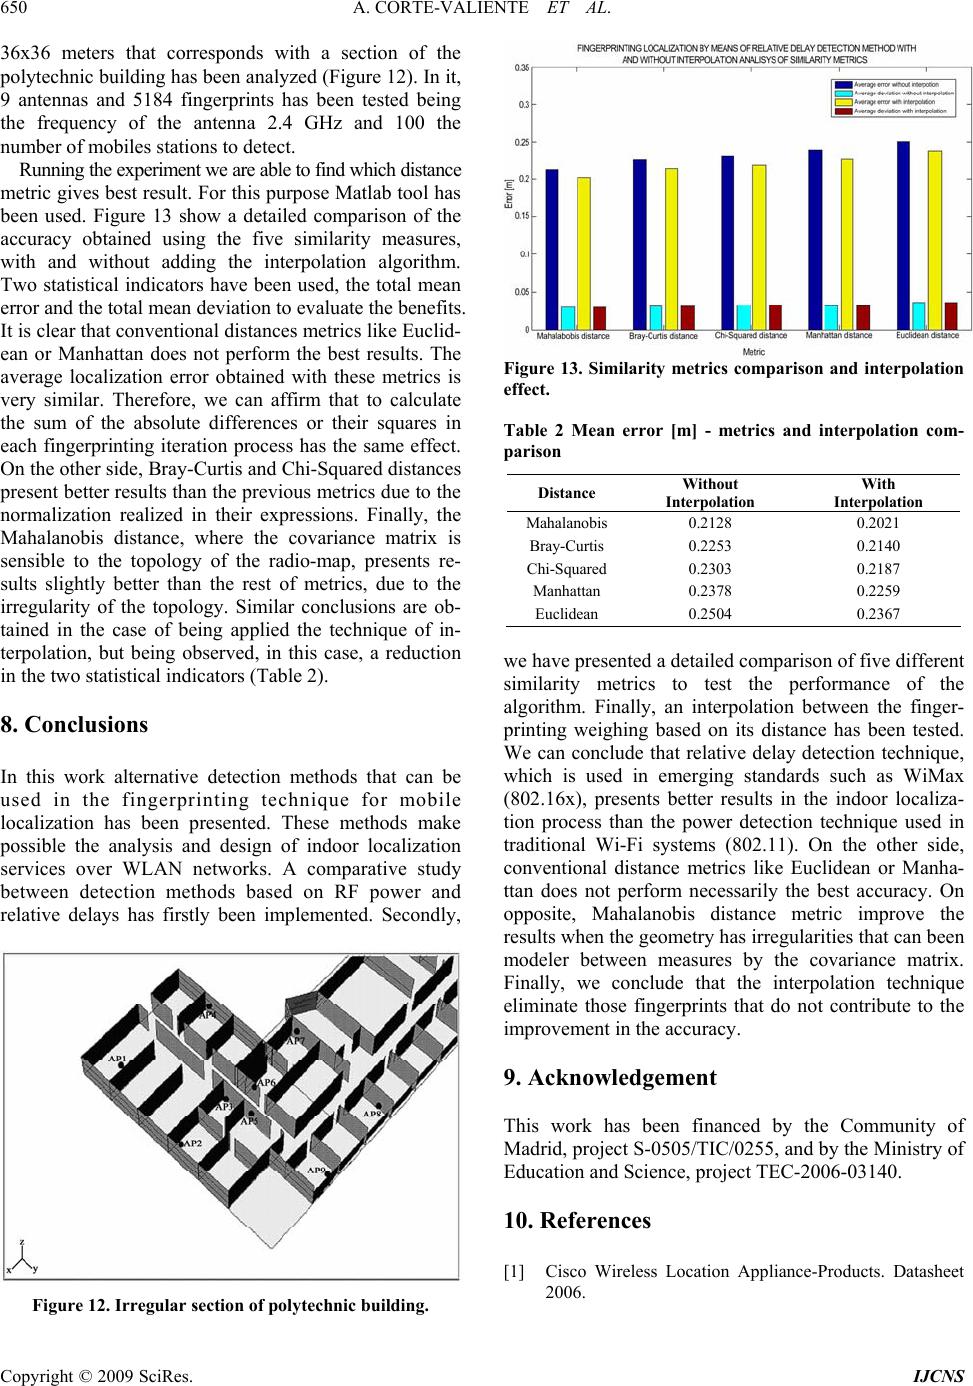 A. CORTE-VALIENTE ET AL. Copyright © 2009 SciRes. IJCNS 650 36x36 meters that corresponds with a section of the polytechnic building has been analyzed (Figure 12). In it, 9 antennas and 5184 fingerprints has been tested being the frequency of the antenna 2.4 GHz and 100 the number of mobiles stations to detect. Running the experiment we are able to find which distance metric gives best result. For this purpose Matlab tool has been used. Figure 13 show a detailed comparison of the accuracy obtained using the five similarity measures, with and without adding the interpolation algorithm. Two statistical indicators have been used, the total mean error and the total mean deviation to evaluate the benefits. It is clear that conventional distances metrics like Euclid- ean or Manhattan does not perform the best results. The average localization error obtained with these metrics is very similar. Therefore, we can affirm that to calculate the sum of the absolute differences or their squares in each fingerprinting iteration process has the same effect. On the other side, Bray-Curtis and Chi-Squared distances present better results than the previous metrics du e to the normalization realized in their expressions. Finally, the Mahalanobis distance, where the covariance matrix is sensible to the topology of the radio-map, presents re- sults slightly better than the rest of metrics, due to the irregularity of the topology. Similar conclusions are ob- tained in the case of being applied the technique of in- terpolation, but being observed, in this case, a reduction in the two statistical indicators (Table 2). 8. Conclusions In this work alternative detection methods that can be used in the fingerprinting technique for mobile localization has been presented. These methods make possible the analysis and design of indoor localization services over WLAN networks. A comparative study between detection methods based on RF power and relative delays has firstly been implemented. Secondly, Figure 12. Irregular section of polytechnic building. Figure 13. Similarity metrics comparison and interpolation effect. Table 2 Mean error [m] - metrics and interpolation com- parison Distance Without Interpolation With Interpolation Mahalanobis 0.2128 0.2021 Bray-Curtis 0.2253 0.2140 Chi-Squared 0.2303 0.2187 Manhattan 0.2378 0.2259 Euclidean 0.2504 0.2367 we have presented a detailed comparison of five different similarity metrics to test the performance of the algorithm. Finally, an interpolation between the finger- printing weighing based on its distance has been tested. We can conclude that relative delay detection technique, which is used in emerging standards such as WiMax (802.16x), presents better results in the indoor localiza- tion process than the power detection technique used in traditional Wi-Fi systems (802.11). On the other side, conventional distance metrics like Euclidean or Manha- ttan does not perform necessarily the best accuracy. On opposite, Mahalanobis distance metric improve the results when the geometry has irregularities that can been modeler between measures by the covariance matrix. Finally, we conclude that the interpolation technique eliminate those fingerprints that do not contribute to the improvement in the accuracy. 9. Acknowledgement This work has been financed by the Community of Madrid, project S-0505 /TIC/0255, and by the Ministr y of Education and Science, project TEC-2006-03140. 10. References [1] Cisco Wireless Location Appliance-Products. Datasheet 2006.  A. CORTE-VALIENTE ET AL. Copyright © 2009 SciRes. IJCNS 651 [2] P. Bahl, et al, “Enhancements of the radar user location and tracking system,” Microsoft Research Technology, February 2000. [3] K. Kaemarungsi and P. Krishnamurthy, “Properties of indoor received signal strength for WLAN location fin- gerprinting,” Proc. First Annual International Conf. on Mobile and Ubiquitous Systems: Networking and Ser- vices, pp. 14–23, August 2004. [4] F. Sáez de Adana, et al. “Propagation model based on ray tracing for the design of personal communication systems in indoor environments,” IEEE Trans. on Vehicular Technology, Vol. 49, pp. 2105–2112, November 2000. [5] M. F. Cátedra and J. Pérez-Arriaga, “Cell planning for wireless communications,” Artech House Publishers, Boston, 1999. [6] K. Kaemarungsi, “Distribution of WLAN received signal strength indication for indoor location determination,” Proc. First International Symposium on Wireless Perva- sive Computing, CD-ROM, pp. 6, January 2006. [7] A. del Corte-Valiente, J. M. Gómez-Pulido, O. Gutiérrez -Blanco, and M. F. Cátedra-Pérez, “Algoritmos eficientes de localización en interiores basados en técnicas de trazado de rayos,” XXIII Simposium Nacional de la Unión Científica Internacional de Radio (URSI). Madrid (Spain), September 2008. [8] A. del Corte-Valiente, J. M. Gómez-Pulido, O. Gutiérrez- Blanco, and M. F. Cátedra-Pérez, “Efficient Techniques for indoor localization based on WLAN networks,” Second International Workshop on User-Centric Techno- logies and Applications (MADRINET), Salamanca (Spain), October 2008. |