 American Journal of Oper ations Research, 2011, 1, 180-184 doi:10.4236/ajor.2011.13020 Published Online September 2011 (http://www.SciRP.org/journal/ajor) Copyright © 2011 SciRes. AJOR Measuring the Performance of Teams in the Indian Premier League Sanjeet Singh Operations Management Gr o up, Indian Institute of Management Calcu tta, Kolkata, India E-mail: sanjeet@iimcal.ac.in Received July 2, 2011; revised July 26, 2011; accepted August 17, 2011 Abstract In this paper, using the Data Envelopment Analysis (DEA), we have measured the technical efficiency of cricket teams in the Indian Premier League. Taking the data for the 2009 season, the input used by the teams is approached by the total expenses which include players’ wage bill and wage of the support staff and other miscellaneous expenses. Output is measured by the points awarded, net run rate, profit and revenues. Effi- iency scores are highly correlated with the performance in the league with a few exception, and when de- composing inefficiency into technical inefficiency and scale inefficiency it can be shown that the largest part of inefficiency can be explained by suboptimal scale of production and ineffficient transformation of inputs into outputs. Keywords: DEA, Linear Programming, Technical Efficiency, Cricket, Indian Premier League, Sports Management 1. Introduction After the very successful inaugural Twenty20 world cup cricket in South Africa in 2007, the popularity and eco- nomic relevance of Twenty20 cricket has once more in- creased in 2008 by the cr eatio n of In dian Pre mier Leagu e (IPL), a professional league for Twenty20 cricket com- petition in India. The IPL was created by the Board of Control for Cricket in India (BCCI) and sanctioned by the International Cricket Council (ICC). IPL is consid- ered to be one of the finest Twenty20 competition in the world of cricket based on the lines of English Premier League (EPL) and the National Basketball League (NBA). It is a very valuable product and has taken Indian cricket to a very high level where billions of dollars are being transacted in this event and lots of money is in- volved in IPL with big corporates and celebraties are investing in this product. Its brand value was estimated to be around $3.67 billion for the recently concluded fourth season [1,2]. IPL is a franchise based competition where these franchises own their teams. Therefore, 8 franchises have been issued for the first three seasons (i.e., for the year 2008, 2009, 2010) of the competition and an expansion to 10 teams took place for the fourth season in 2011. Here, it may be worth noted that aim of BCCI, behind the launch of IPL, is not only to promote Twenty20 cricket in India but also to create a profitable cricket league with players and teams that are competi- tive on an international level and to provide affordable family entertainment. To achieve this aim, investors are entitled to hold shares of a particular team. We are, therefore, dealing with entities that can be analyzed and studied from the point of view of economics and are us- ing the tools of analysis that are provided by this disci- pline. Four years after the launch of the IPL Twenty20 com- petition, time has come to evaluate the teams regarding their efficiency in terms of winning matches and pro- ducing the value to their owners. Sports is not new to the mathematical analysis [3,4]. The efficiency of sports teams has been measured, making use of a variety of approaches and techniques (for an overview, see [5]) mainly focusing on the popular U.S. team sports like baseball, hockey, and basketball. Most of these studies make use of stochastic productivity and efficiency meas- urement methods. Such methods are based on specific assumptions concerning the functional form of the un- derlying production function, assumptions on the distri- bution of the error term, and a priori weighting of factors of production. The multitude of assumptions necessary in the context of parametric and stochastic methods in- creases the risk of misidentification, which in turn can  S. SINGH 181 negatively affect the reliability of measurement results. In DEA no specific functional form is required and no prior weighings of inputs and outputs is necessary and hence offers an interesting approach for efficiency evalua- tion. In the context of sports, DEA has been used by Anderson & Sharp [6] to evaluate individual batting and running efficiency, Jahangir et al. [7] to evaluate the performance of teams in Iranian premier football league, and by Fizl & D’Itri [8] to measure individual managers efficiency. In this paper, we attempt to use DEA to measure tech- nical efficiency of teams in IPL. Taking the data for the 2009 season, single input is taken as the total expenses which include players’ wage bill, wage of the support staff, and other miscellaneous expenses. Output is meas- ured by points awarded, net run rate, profit, and revenues. Efficiency scores are highly correlated with the per- formance in the league with a few exceptions, and when decomposing inefficiency into technical inefficiency and scale inefficiency it can be shown that the largest part of inefficiency can be explained by suboptimal scale of production and inefficient transformation of inputs and outputs. This paper is organized as follows. Brief description about the concepts and DEA models is given in Section 2. Details about the data used are presented in Section 3. Section 4, we present our analysis and results. The last section, i.e. Section 5, contains summary, some conclu- sions and suggestions for further research. 2. DEA Data Envelopment Analysis (DEA) is a widely applied non-parametric mathematical programming approach for analyzing the productive efficiency of Decision Making Units (DMUs) or firms (in this paper, 8 cricket teams in IPL 2009 season) with the same multiple input and mul- tiple outputs. Measurement of efficiency of business firms is important to shareholders, managers, and inves- tors for any future course of action. Based on Farrel’s [9] study DEA was first introduced by Charnes et al. [10]. In recent years DEA has been applied to a wide spectrum of practical problems. For example, bank failure prediction [11], electric utilities evaluation [12], commercial banks profitability [13], portfolio evaluation [14]. See Gattoufi et al. [15,16] for a collection of more DEA applications. Note that the DEA approach has proved especially valu- able in the evaluation of production processes with non- marketable inputs or outputs and/or where correct weight- ing of inputs and outputs is unknown or cannot be de- rived [17]. As both is supposed to hold true for (at least) some of the variables taken into account in this article, DEA is regarded superior to econometric methods of efficiency measurement. Additionally, the sample is rather small as the IPL 2009 consists of 8 teams, and in such a situation a non parametric analysis tool is superior to parametric ones where more observations would be required. The objective of the input-oriented DEA model (also known as CCR models) is to minimize inputs while sat- isfying at least the given output levels. These linear pro- gramming models compare a test DMU (a team here) to its peers. The model searches the data set to determine if some linear combination of the peer DMUs uses lower levels of inputs to produce at least the level of output of the observing DMU. For each IPL team (DMU), the efficiency is measured given the 2009 season data and an optimization will be proposed according to the below indicated linear pro- gram. In DEA, the evaluated DMU is assigned the most favorable weighting of the inputs/outputs given the con- straints. The DMUs are denoted by Each DMU employs m inputs 1,2,, .jn ,m1, 2,i to produce s different outputs , ,1, 2rs. Specifically, DMUj consumes amount ij of input i and produced amount rj of output r. It is assumed that and and that each DMU has at least one positive input and one positive output value. In DEA optimization models observed input and output values for all DMUs are given, y0 ij xy0 rj and a composite unit is formed with inputs 1 n ij j j w and outputs for evaluated DMU0 seeking values 1 n rj j j yw of w according to following linear programming prob- lem (see [17]): 011 minimize ,,ms ir ir sss s Subject to 0101,2,, n iijji j xw sim (1) 0 11, 2,, n rj jrr j ywsy rs (2) 01,2,, j wjn (3) 01,2,, i i m (4) 01,2,, r r s (5) w denotes the weights on DMUj i , and r are the input and output slacks and is an infinitesimal con- stant. The constraint (2) implies that even after reduction of all inputs, inputs of the evaluated DMU0 can not be lower than the inputs of the composite unit. Constraint (3) Copyright © 2011 SciRes. AJOR 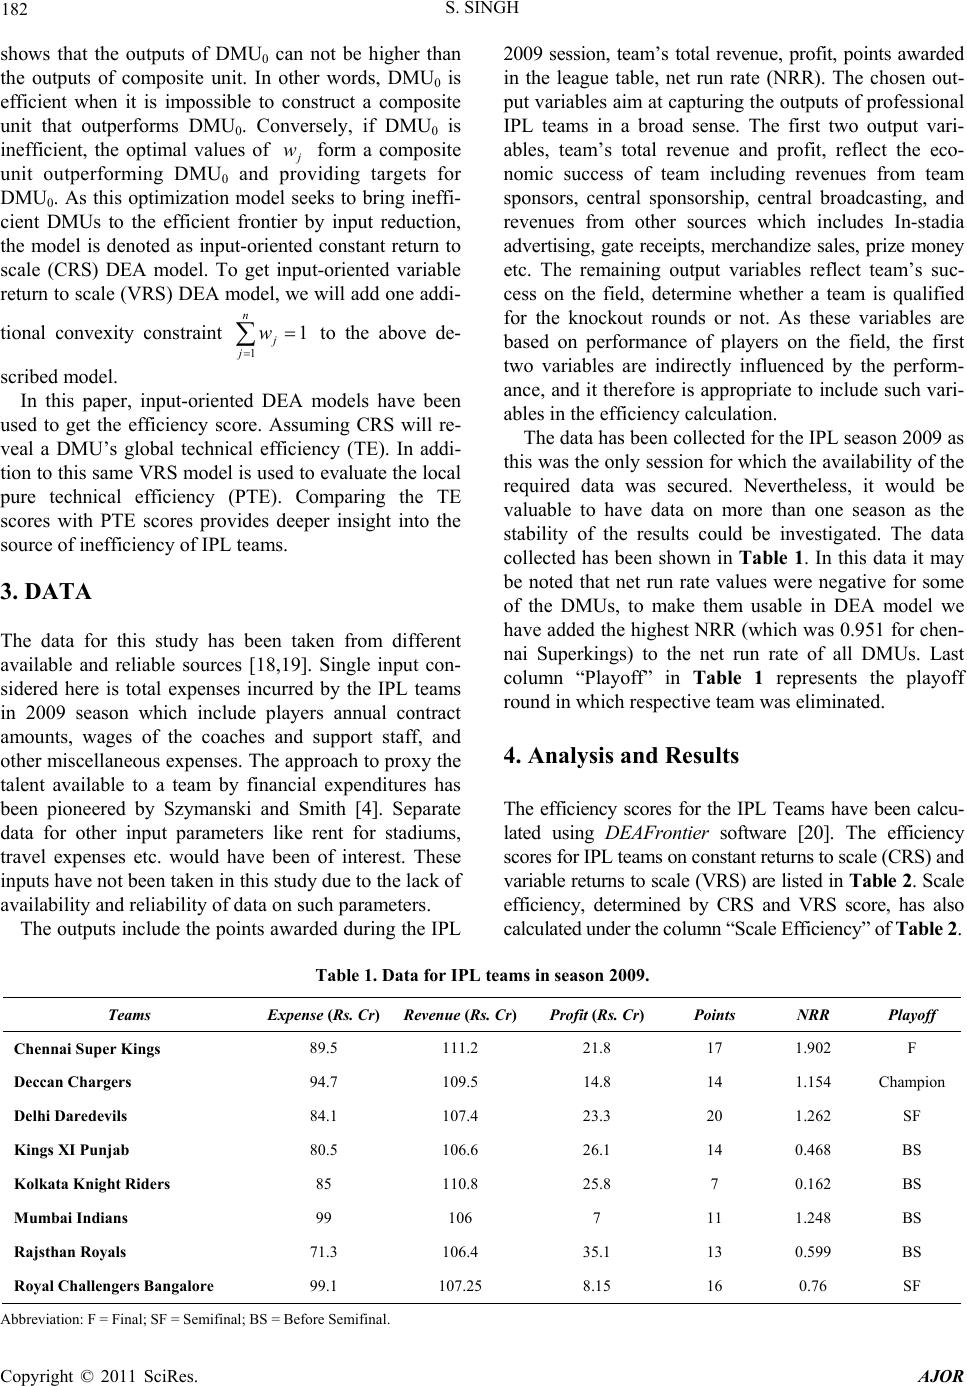 S. SINGH Copyright © 2011 SciRes. AJOR 182 shows that the outputs of DMU0 can not be higher than the outputs of composite unit. In other words, DMU0 is efficient when it is impossible to construct a composite unit that outperforms DMU0. Conversely, if DMU0 is inefficient, the optimal values of w 1 j form a composite unit outperforming DMU0 and providing targets for DMU0. As this optimization model seeks to bring ineffi- cient DMUs to the efficient frontier by input reduction, the model is denoted as input-oriented constant return to scale (CRS) DEA model. To get input-oriented variable return to scale (VRS) DEA model, we will add one addi- tional convexity constraint to the above de- scribed model. 1 n j w In this paper, input-oriented DEA models have been used to get the efficiency score. Assuming CRS will re- veal a DMU’s global technical efficiency (TE). In addi- tion to this same VRS model is used to evalu ate the local pure technical efficiency (PTE). Comparing the TE scores with PTE scores provides deeper insight into the source of inefficiency of IPL teams. 3. DATA The data for this study has been taken from different available and reliable sources [18,19]. Single input con- sidered here is total expenses incurred by the IPL teams in 2009 season which include players annual contract amounts, wages of the coaches and support staff, and other miscellaneous expenses. The approach to proxy the talent available to a team by financial expenditures has been pioneered by Szymanski and Smith [4]. Separate data for other input parameters like rent for stadiums, travel expenses etc. would have been of interest. These inputs have not been taken in this study due to the lack of availability and reliability of data on such parame ters. The outputs include the points awarded during the IPL 2009 session, team’s total revenue, profit, points awarded in the league table, net run rate (NRR). The chosen out- put variables aim at capturing the outputs of professional IPL teams in a broad sense. The first two output vari- ables, team’s total revenue and profit, reflect the eco- nomic success of team including revenues from team sponsors, central sponsorship, central broadcasting, and revenues from other sources which includes In-stadia advertising, gate receipts, merchandize sales, prize money etc. The remaining output variables reflect team’s suc- cess on the field, determine whether a team is qualified for the knockout rounds or not. As these variables are based on performance of players on the field, the first two variables are indirectly influenced by the perform- ance, and it therefore is appropriate to include such vari- ables in the efficiency calculation. The data has been collected for the IPL season 2009 as this was the only session for which the availability of the required data was secured. Nevertheless, it would be valuable to have data on more than one season as the stability of the results could be investigated. The data collected has been shown in Table 1. In this data it may be noted that net run rate values were negative for some of the DMUs, to make them usable in DEA model we have added the highest NRR (which was 0.951 for chen- nai Superkings) to the net run rate of all DMUs. Last column “Playoff” in Table 1 represents the playoff round in which respective team was eliminated. 4. Analysis and Results The efficiency scores for the IPL Teams have been calcu- lated using DEAFrontier software [20]. The efficiency scores for IPL teams on constant returns to scale (CRS) and variable returns to scale (VRS) are listed in Table 2. Scale efficiency, determined by CRS and VRS score, has also calculated under the column “Scale Efficiency” of Table 2. Table 1. Data for IPL teams in season 2009. Teams Expense (Rs. Cr)Revenue (Rs. Cr)Profit (Rs. Cr) Points NRR Playoff Chennai Super Kings 89.5 111.2 21.8 17 1.902 F Deccan Chargers 94.7 109.5 14.8 14 1.154 Champion Delhi Daredevils 84.1 107.4 23.3 20 1.262 SF Kings XI Punjab 80.5 106.6 26.1 14 0.468 BS Kolkata Knight Riders 85 110.8 25.8 7 0.162 BS Mumbai Indians 99 106 7 11 1.248 BS Rajsthan Royals 71.3 106.4 35.1 13 0.599 BS Royal Challengers Bangalore 99.1 107.25 8.15 16 0.76 SF Abbreviation: F = Final; SF = Semifinal; BS = Before Semifinal. 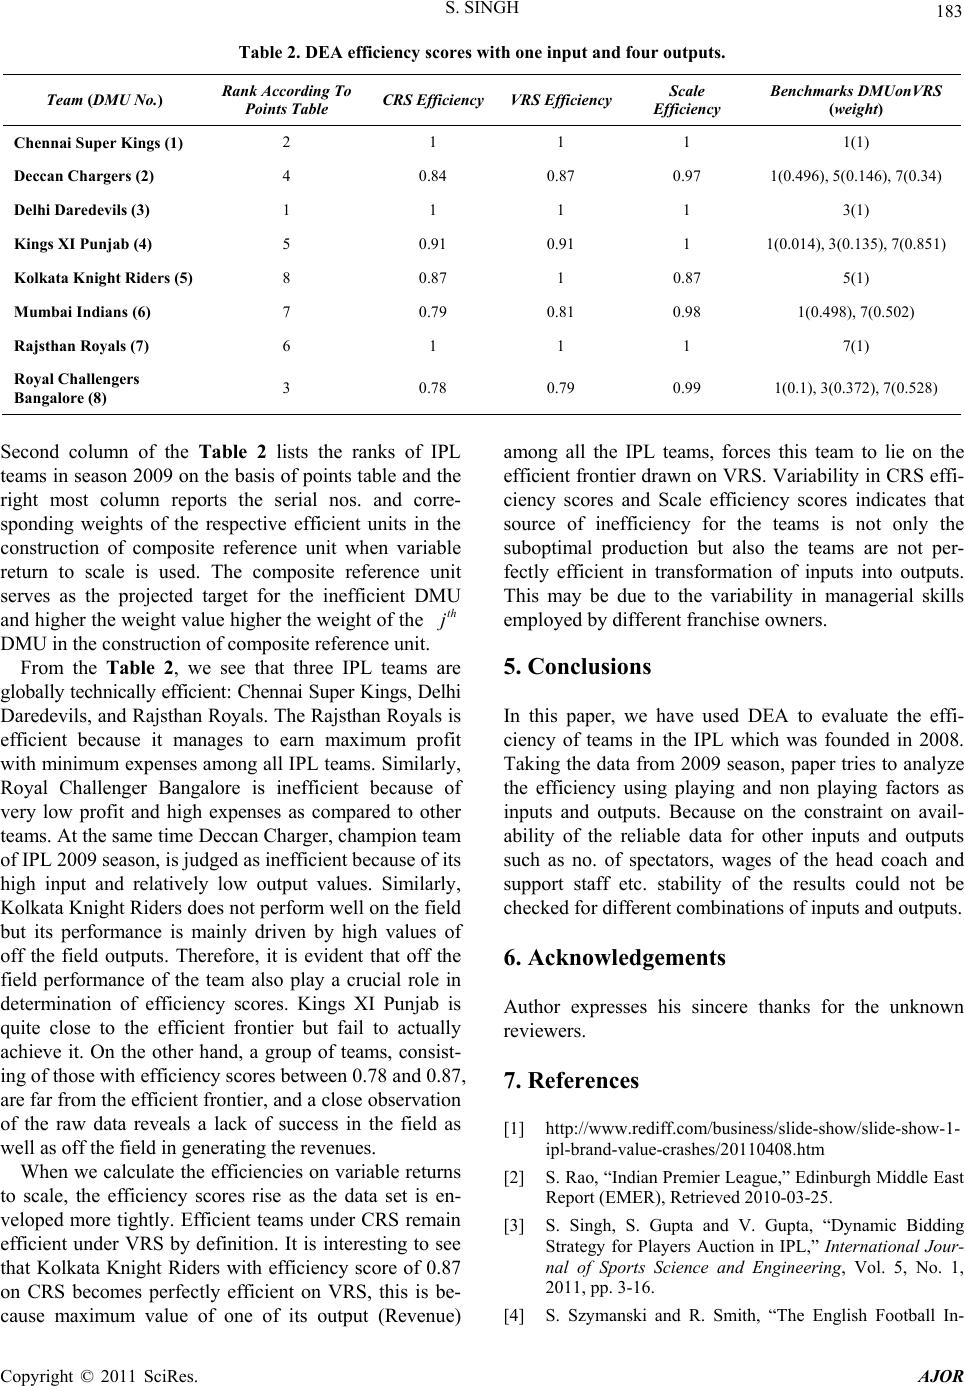 S. SINGH 183 Table 2. DEA efficiency score s with one input and four outputs. Team (DMU No.) Rank According To Points Table CRS EfficiencyVRS EfficiencyScale Efficiency Benchmarks DMUonVRS (weight) Chennai Super Kings (1) 2 1 1 1 1(1) Deccan Chargers (2) 4 0.84 0.87 0.97 1(0.496), 5(0.146), 7(0.34) Delhi Daredevils (3) 1 1 1 1 3(1) Kings XI Punjab (4) 5 0.91 0.91 1 1(0.014), 3(0.135), 7(0.851) Kolkata Knight Riders (5) 8 0.87 1 0.87 5(1) Mumbai Indians (6) 7 0.79 0.81 0.98 1(0.498), 7(0.502) Rajsthan Royals (7) 6 1 1 1 7(1) Royal Challengers Bangalore (8) 3 0.78 0.79 0.99 1(0.1), 3(0.372), 7(0.528) Second column of the Table 2 lists the ranks of IPL teams in season 2009 on the basis of points table and the right most column reports the serial nos. and corre- sponding weights of the respective efficient units in the construction of composite reference unit when variable return to scale is used. The composite reference unit serves as the projected target for the inefficient DMU and higher the weight value higher the weight of the DMU in the construction of composite reference unit. th j From the Table 2, we see that three IPL teams are globally technically efficient: Chennai Super Kings, Delhi Daredevils, and Rajsthan Royals. The Rajsthan Royals is efficient because it manages to earn maximum profit with minimum expenses among all IPL teams. Similarly, Royal Challenger Bangalore is inefficient because of very low profit and high expenses as compared to other teams. At the same time Deccan Charger, champion team of IPL 2009 season, is judged as inefficient because of its high input and relatively low output values. Similarly, Kolkata Knight Riders does not perform well on the field but its performance is mainly driven by high values of off the field outputs. Therefore, it is evident that off the field performance of the team also play a crucial role in determination of efficiency scores. Kings XI Punjab is quite close to the efficient frontier but fail to actually achieve it. On the other hand, a group of teams, consist- ing of those with efficiency scores between 0.78 and 0.87, are far from the efficient frontier, and a close observation of the raw data reveals a lack of success in the field as well as off the field in generating the revenues. When we calculate the efficiencies on variable returns to scale, the efficiency scores rise as the data set is en- veloped more tightly. Efficient teams under CRS remain efficient under VRS by definition. It is interesting to see that Kolkata Knight Riders with efficiency score of 0.87 on CRS becomes perfectly efficient on VRS, this is be- cause maximum value of one of its output (Revenue) among all the IPL teams, forces this team to lie on the efficient frontier drawn on VRS. Variability in CRS effi- ciency scores and Scale efficiency scores indicates that source of inefficiency for the teams is not only the suboptimal production but also the teams are not per- fectly efficient in transformation of inputs into outputs. This may be due to the variability in managerial skills employed by different franchise owners. 5. Conclusions In this paper, we have used DEA to evaluate the effi- ciency of teams in the IPL which was founded in 2008. Taking the data from 2009 season, paper tries to analyze the efficiency using playing and non playing factors as inputs and outputs. Because on the constraint on avail- ability of the reliable data for other inputs and outputs such as no. of spectators, wages of the head coach and support staff etc. stability of the results could not be checked for different combina tions of inputs and outputs. 6. Acknowledgements Author expresses his sincere thanks for the unknown reviewers. 7. References [1] http://www.rediff.com/business/slide-show/slide-show-1- ipl-brand-value-crashes/20110408.htm [2] S. Rao, “Indian Premier League,” Edinburgh Middle East Report (EMER), Retrieved 2010-03-25. [3] S. Singh, S. Gupta and V. Gupta, “Dynamic Bidding Strategy for Players Auction in IPL,” International Jour- nal of Sports Science and Engineering, Vol. 5, No. 1, 2011, pp. 3-16. [4] S. Szymanski and R. Smith, “The English Football In- Copyright © 2011 SciRes. AJOR  184 S. SINGH dustry: Profit, Performance and Industrial Structure,” In- ter national Review of Applied Economics, Vol. 11, No. 1, 1997, pp. 135-153. doi:10.1080/02692179700000008 [5] S. Dobson and J. Goddard, “The Economics of Football,” Cambridge University Press, Cambridge, 2001. doi:10.1017/CBO9780511493225 [6] T. Anderson and G. Sharp, “A New Measure of Baseball Batters Using DEA,” Annals of Operations Research, Vol. 73, No. 1, 1997, pp. 141-155. doi:10.1023/A:1018921026476 [7] S. D. Jahangir, H. Mehrzad and H. Sajadi, “Evaluating the Performance of Iranian Football Teams Utilizing Linear Programming,” American Journal of Operations Research, Vol. 1, No. 3, 2011, pp. 65-72. [8] J. L. Fizel and M. D’Itri, “Estimating Managerial Effi- ciency: The Case of College Basketball Coaches,” Jour- nal of Sport Management, Vol. 10, No. 4, 1996, pp. 435- 445. [9] M. J. Farrell, “The Measurement of Productive Effi- ciency,” Journal of the Royal Statistical Society, Vol. 120, No. 3, 1957, pp. 253-290. doi:10.2307/2343100 [10] A. Charnes, W. Cooper and E. Rhodes, “Measuring the Efficiency of Decision Making Units,” European Journal of Operational Research, Vol. 2, No. 6, 1978, pp. 429-444. doi:10.1016/0377-2217(78)90138-8 [11] R. S. Barr and T. F. Siems, “Bank Failure Prediction Using DEA to Measure Management Quality,” In: R. S. Barr, R. V. Helgason and J. L. Kennington, Eds., Ad- vances in Metaheuristics, Optimization, and Stochastic Modeling Techniques, Kluwer Academic Publishers, Boston, 1997, pp. 341-365. [12] R. Fare, S. Grosskopf, J. Logan and C. A. K. Lovell, “Measuring Efficiency in Production: With an Applica- tion to Electric Utilities,” In: R. Fare, G. Grosskopf and C. A. K. Lovell, Eds., The Measurement of Efficiency of Production, Kluwer-Nijhoff Publishing, Kluwer Acade- mic Publishers, Boston, 1985, pp. 185-214. [13] L. M. Seiford and J. Zhu, “Profitability and Marketability of the Top 55 US Commercial Banks,” Management Sci- ence, Vol. 45, No. 9, 199, pp. 1270-1288. [14] K. Wilkens and J. Z hu, “Portfolio E valuation and B ench- mark Selection: A Mathematical Programming Approach,” Journal of Business and Economic Statistics, Vol. 11, No. 3, 2001, pp. 319-323. [15] S. Gattoufi, M. Oral and A. Reisman, “A Taxonomy for Data Envelopment Analysis,” Socio-Economic Planning Sciences, Vol. 38, No. 2-3, 2004, pp. 141-158. doi:10.1016/S0038-0121(03)00022-3 [16] S. Gattoufi, M. Oral, A. Kumar and A. Reisman, “Epis- temology of Data Envelopment Analysis and Comparison with Other Fields of OR/MS for Relevance to Applica- tions,” Socio-Economic Planning Sciences, Vol. 38, No. 2-3, 2004, pp. 123-140. doi:10.1016/S0038-0121(03)00021-1 [17] W. W. Cooper, L. M. Seiford and K. Tone, “Data Envel- opment Analysis: A Comprehensive Text with Models, Applications, References, and DEA-Solver Software,” Kluwer Academic Publishers, Dordrecht, 2007. [18] http://www.espncricinfo.com/ipl2009/content/current/seri es/374163.html [19] http://www.iiflcap.com [20] J. Zhu, “Quantitative Models for Performance Evaluation and Benchmarking: DEA with Spreadsheets,” 2nd Edi- tion, Springer, Boston, 2009. Copyright © 2011 SciRes. AJOR
|