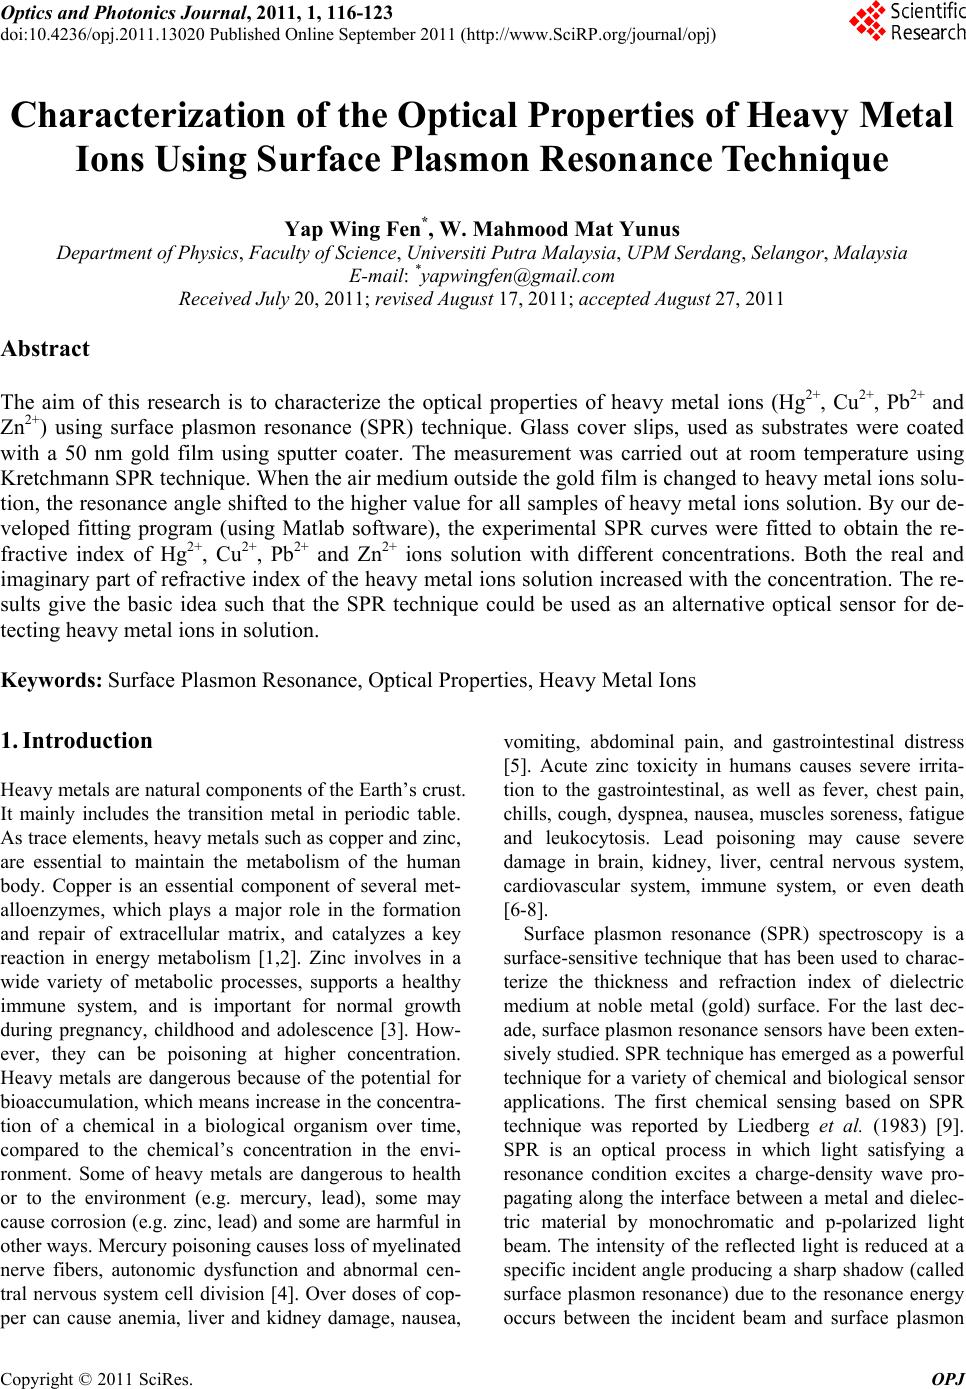
 Optics and Photonics Journal, 2011, 1, 116-123 doi:10.4236/opj.2011.13020 Published Online September 2011 (http://www.SciRP.org/journal/opj) Copyright © 2011 SciRes. OPJ Characterization of the Optical Properties of Heavy Metal Ions Using Surface Plasmon Resonance Technique Yap Wing Fen*, W. Mahmood Mat Yunus Department of Physi c s , Faculty of Science, Universiti Putra Malaysia, UPM Serdang, Selangor, Malaysia E-mail: *yapwingfen@gmail.com Received July 20, 2011; revised August 17, 2011; accepted August 27, 2011 Abstract The aim of this research is to characterize the optical properties of heavy metal ions (Hg2+, Cu2+, Pb2+ and Zn2+) using surface plasmon resonance (SPR) technique. Glass cover slips, used as substrates were coated with a 50 nm gold film using sputter coater. The measurement was carried out at room temperature using Kretchmann SPR technique. When the air medium outside the gold film is changed to heavy metal ions solu- tion, the resonance angle shifted to the higher value for all samples of heavy metal ions solution. By our de- veloped fitting program (using Matlab software), the experimental SPR curves were fitted to obtain the re- fractive index of Hg2+, Cu2+, Pb2+ and Zn2+ ions solution with different concentrations. Both the real and imaginary part of refractive index of the heavy metal ions solution increased with the concentration. The re- sults give the basic idea such that the SPR technique could be used as an alternative optical sensor for de- tecting heavy metal ions in solution. Keywords: Surface Plasmon Resonance, Optical Properties, Heavy Metal Ions 1. Introduction Heavy metals are natural components of the Earth’s crust. It mainly includes the transition metal in periodic table. As trace elements, heavy metals such as copper and zinc, are essential to maintain the metabolism of the human body. Copper is an essential component of several met- alloenzymes, which plays a major role in the formation and repair of extracellular matrix, and catalyzes a key reaction in energy metabolism [1,2]. Zinc involves in a wide variety of metabolic processes, supports a healthy immune system, and is important for normal growth during pregnancy, childhood and adolescence [3]. How- ever, they can be poisoning at higher concentration. Heavy metals are dangerous because of the potential for bioaccumulation, which means increase in the concentra- tion of a chemical in a biological organism over time, compared to the chemical’s concentration in the envi- ronment. Some of heavy metals are dangerous to health or to the environment (e.g. mercury, lead), some may cause corrosion (e.g. zinc, lead) and some are harmful in other ways. Mercury poisoning causes loss of myelinated nerve fibers, autonomic dysfunction and abnormal cen- tral nervous system cell division [4]. Over doses of cop- per can cause anemia, liver and kidney damage, nausea, vomiting, abdominal pain, and gastrointestinal distress [5]. Acute zinc toxicity in humans causes severe irrita- tion to the gastrointestinal, as well as fever, chest pain, chills, cough, dyspnea, nausea, muscles soreness, fatigue and leukocytosis. Lead poisoning may cause severe damage in brain, kidney, liver, central nervous system, cardiovascular system, immune system, or even death [6-8]. Surface plasmon resonance (SPR) spectroscopy is a surface-sensitive technique that has been used to charac- terize the thickness and refraction index of dielectric medium at noble metal (gold) surface. For the last dec- ade, surface plasmon resonance sensors have been exten- sively studied. SPR technique has emerged as a powerful technique for a variety of chemical and biological sensor applications. The first chemical sensing based on SPR technique was reported by Liedberg et al. (1983) [9]. SPR is an optical process in which light satisfying a resonance condition excites a charge-density wave pro- pagating along the interface between a metal and dielec- tric material by monochromatic and p-polarized light beam. The intensity of the reflected light is reduced at a specific incident angle producing a sharp shadow (called surface plasmon resonance) due to the resonance energy occurs between the incident beam and surface plasmon 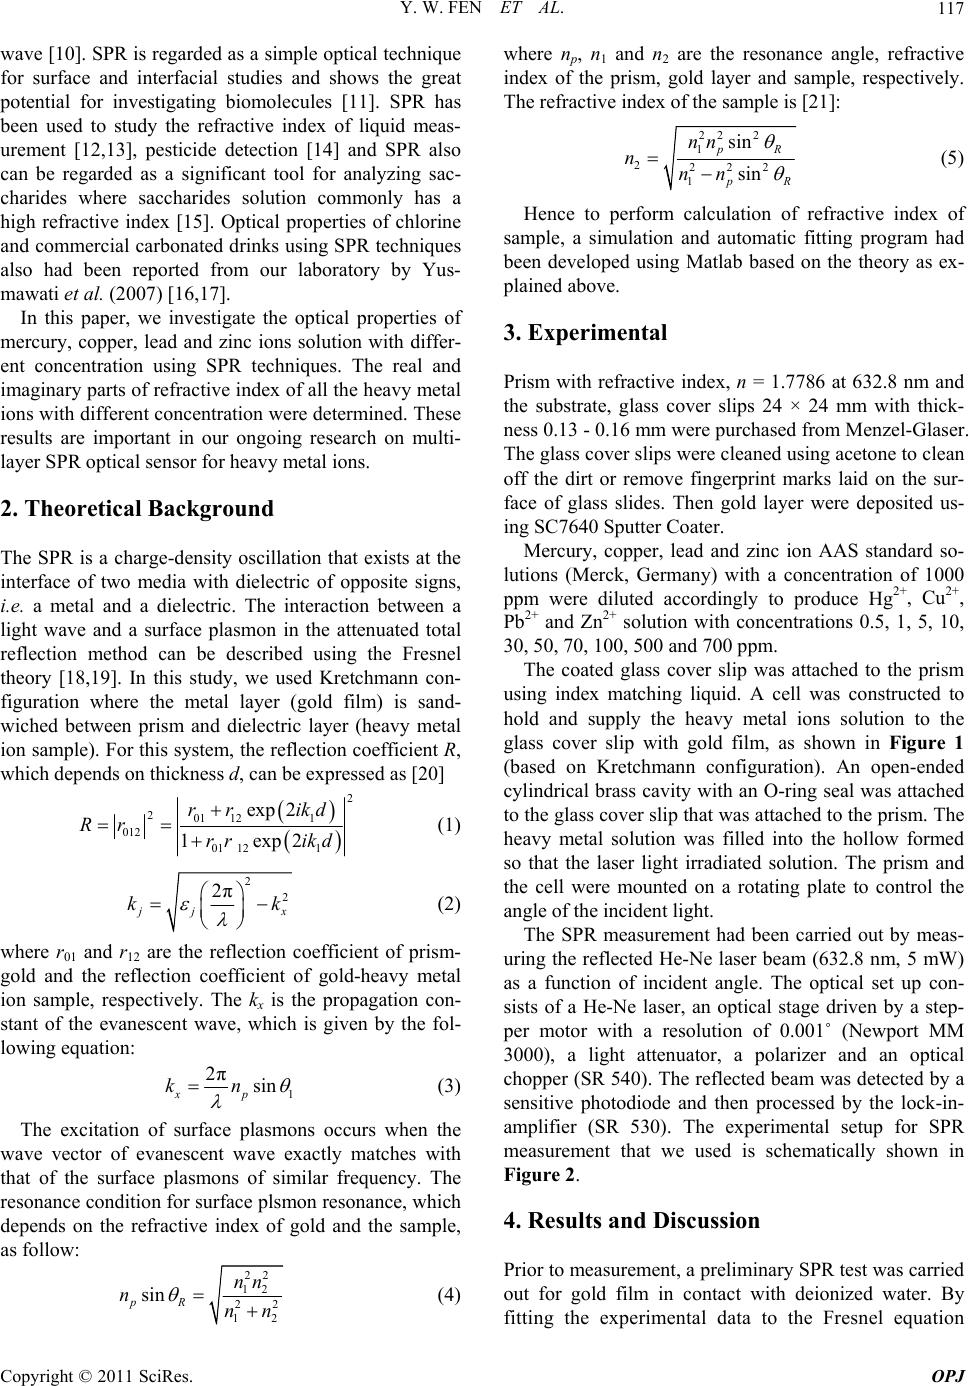 Y. W. FEN ET AL.117 wave [10]. SPR is regarded as a simple optical technique for surface and interfacial studies and shows the great potential for investigating biomolecules [11]. SPR has been used to study the refractive index of liquid meas- urement [12,13], pesticide detection [14] and SPR also can be regarded as a significant tool for analyzing sac- charides where saccharides solution commonly has a high refractive index [15]. Optical properties of chlorine and commercial carbonated drinks using SPR techniques also had been reported from our laboratory by Yus- mawati et al. (2007) [16,17]. In this paper, we investigate the optical properties of mercury, copper, lead and zinc ions solution with differ- ent concentration using SPR techniques. The real and imaginary parts of refractive index of all the heavy metal ions with different concentration were determined. These results are important in our ongoing research on multi- layer SPR optical sensor for heavy metal ions. 2. Theoretical Background The SPR is a charge-density oscillation that exists at the interface of two media with dielectric of opposite signs, i.e. a metal and a dielectric. The interaction between a light wave and a surface plasmon in the attenuated total reflection method can be described using the Fresnel theory [18,19]. In this study, we used Kretchmann con- figuration where the metal layer (gold film) is sand- wiched between prism and dielectric layer (heavy metal ion sample). For this system, the reflection coefficient R, which depends on thickness d, can be expressed as [20] 2 201 121 012 01 121 exp 2 1exp2 rr ikd Rr rr ikd (1) 2 2 2π j k x k (2) where r01 and r12 are the reflection coefficient of prism- gold and the reflection coefficient of gold-heavy metal ion sample, respectively. The kx is the propagation con- stant of the evanescent wave, which is given by the fol- lowing equation: 1 2πsin xp kn (3) The excitation of surface plasmons occurs when the wave vector of evanescent wave exactly matches with that of the surface plasmons of similar frequency. The resonance condition for surface plsmon resonance, which depends on the refractive index of gold and the sample, as follow: 22 12 22 12 sin pR nn nnn (4) where np, n1 and n2 are the resonance angle, refractive index of the prism, gold layer and sample, respectively. The refractive index of the sample is [21]: 22 2 1 2222 1 sin sin pR R nn nnn (5) Hence to perform calculation of refractive index of sample, a simulation and automatic fitting program had been developed using Matlab based on the theory as ex- plained above. 3. Experimental Prism with refractive index, n = 1.7786 at 632.8 nm and the substrate, glass cover slips 24 × 24 mm with thick- ness 0.13 - 0.16 mm were purchased from Menzel-Glaser. The glass cover slips were cleaned using acetone to clean off the dirt or remove fingerprint marks laid on the sur- face of glass slides. Then gold layer were deposited us- ing SC7640 Sputter Coater. Mercury, copper, lead and zinc ion AAS standard so- lutions (Merck, Germany) with a concentration of 1000 ppm were diluted accordingly to produce Hg2+, Cu2+, Pb2+ and Zn2+ solution with concentrations 0.5, 1, 5, 10, 30, 50, 70, 100, 500 and 700 ppm. The coated glass cover slip was attached to the prism using index matching liquid. A cell was constructed to hold and supply the heavy metal ions solution to the glass cover slip with gold film, as shown in Figure 1 (based on Kretchmann configuration). An open-ended cylindrical brass cavity with an O-ring seal was attached to the glass cover slip that was attached to the prism. The heavy metal solution was filled into the hollow formed so that the laser light irradiated solution. The prism and the cell were mounted on a rotating plate to control the angle of the incident light. The SPR measurement had been carried out by meas- uring the reflected He-Ne laser beam (632.8 nm, 5 mW) as a function of incident angle. The optical set up con- sists of a He-Ne laser, an optical stage driven by a step- per motor with a resolution of 0.001˚ (Newport MM 3000), a light attenuator, a polarizer and an optical chopper (SR 540). The reflected beam was detected by a sensitive photodiode and then processed by the lock-in- amplifier (SR 530). The experimental setup for SPR measurement that we used is schematically shown in Figure 2. 4. Results and Discussion Prior to measurement, a preliminary SPR test was carried out for gold film in contact with deionized water. By fitting the experimental data to the Fresnel equation Copyright © 2011 SciRes. OPJ  Y. W. FEN ET AL. 118 Figure 1. Structure of the cell for SPR measurement. Figure 2. Experimental setups for angle scan surface plas- mon resonance technique. [18,19] using our self developed fitting program (matrix method), the refractive index of deionized water was obtained. Figure 3 shows that the fitting line is in good agreement with the experimental data as compared to the theoretical result for deionized water. The value of re- fractive index for this fitting line is 1.3317, and the reso- nance angle was obtained as 55.043˚. The fitting result for refractive index of deionized wa- ter, i.e. 1.3317, shows a good agreement with other pub- lished values as reported by Weast et al. (1978), Webb et al. (1989) and Ma et al. (2000) [22-24]. Thus, it shows that the SPR measurement can be used to determine the optical properties of the liquid sample. Then the SPR experiment was carried out for Hg2+ so- lutions (concentration range between 0.5 to 1000 ppm), which was injected one after another into the cell to con- tact with the gold film. It was observed that the reso- nance angles determined were 55.071˚, 55.350˚, 55.467˚, 55.601˚ for Hg2+ at concentrations of 100, 500, 700 and 1000 ppm, respectively. The resonance angles remain unchanged (same as deionized water) for the concentra- tions less than 100 ppm. The SPR curves were shown in Figure 4. The values of real and imaginary parts of re- fractive index for Hg2+ solutions obtained by fitting were notified and tabulated in Table 1. Similarly, the above processes were applied to other heavy metal ions solutions, Cu2+, Pb2+ and Zn2+. The re- sonance angles obtained were 55.071˚, 55.267˚, 55.378˚, Figure 3. Fitting experimental data to theoretical data for gold layer in contact with deionized water. The solid line represents the theoretical curve. Table 1. The real and imaginary part of refractive index for different concentration of mercury ion solutions from fit- ting. Concentration of Hg (ppm) Real Part of Refractive Index, n (±0.0005) Imaginary Part of Refractive Index, k (±0.0002) 0.5 1.3317 0.0002 1 1.3317 0.0002 5 1.3317 0.0003 10 1.3317 0.0005 30 1.3318 0.0010 50 1.3318 0.0014 70 1.3318 0.0021 100 1.3321 0.0029 500 1.3359 0.0061 700 1.3374 0.0071 1000 1.3392 0.0089 55.490˚ for Cu2+ at concentrations of 100, 500, 700 and 1000 ppm, respectively. For Pb2+, we determined that the resonance angles were 55.071˚, 55.326˚, 55.431˚, 55.569˚ at concentrations of 100, 500, 700 and 1000 ppm, re- spectively. While for Zn2+, the resonance angles obtained were 55.071˚, 55.278˚, 55.388˚, 55.501˚ at concentra- tions of 100, 500, 700 and 1000 ppm, respectively. Also, same as Hg2+, the resonance angles, for all Cu2+, Pb2+ and Zn2+ with concentrations less than 100 ppm, were same as deionized water, i.e. 55.043˚. The SPR curves for Cu2+, Pb2+, Zn2+ were shown in Figures 5-7, respectively. Copyright © 2011 SciRes. OPJ 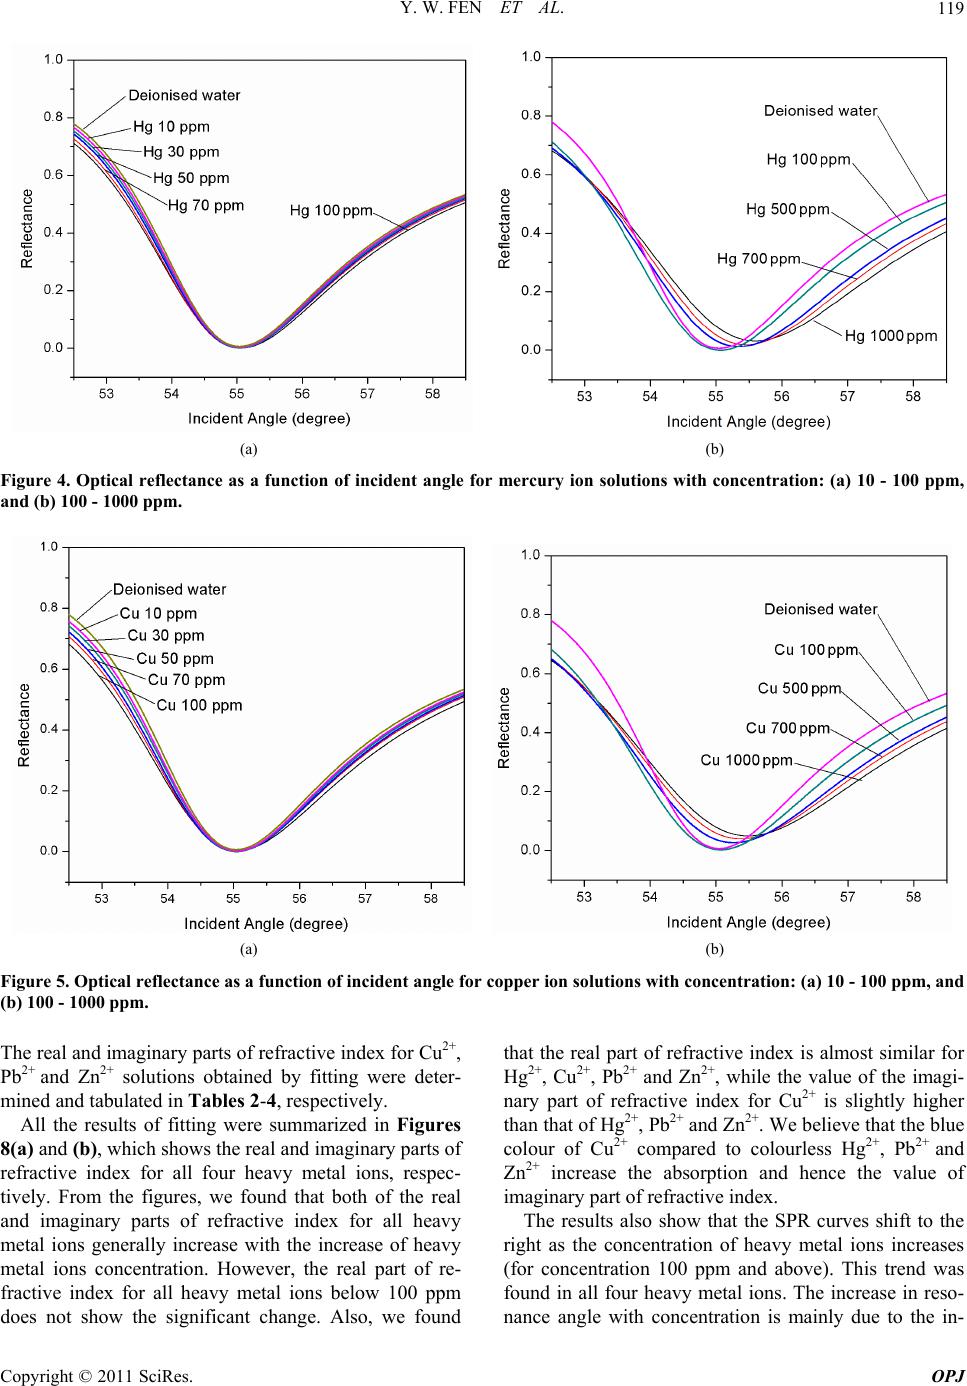 Y. W. FEN ET AL. Copyright © 2011 SciRes. OPJ 119 (a) (b) Figure 4. Optical reflectance as a function of incident angle for mercury ion solutions with concentration: (a) 10 - 100 ppm, and (b) 100 - 1000 ppm. (a) (b) Figure 5. Optical reflectance as a function of incident angle for copper ion solutions with concentration: (a) 10 - 100 ppm, and (b) 100 - 1000 ppm. The real and imaginary parts of refractive index for Cu2+, Pb2+ and Zn2+ solutions obtained by fitting were deter- mined and tabulated in Tables 2-4, respectively. All the results of fitting were summarized in Figures 8(a) and (b), which shows the real and imaginary parts of refractive index for all four heavy metal ions, respec- tively. From the figures, we found that both of the real and imaginary parts of refractive index for all heavy metal ions generally increase with the increase of heavy metal ions concentration. However, the real part of re- fractive index for all heavy metal ions below 100 ppm does not show the significant change. Also, we found that the real part of refractive index is almost similar for Hg2+, Cu2+, Pb2+ and Zn2+, while the value of the imagi- nary part of refractive index for Cu2+ is slightly higher than that of Hg2+, Pb2+ and Zn2+. We believe that the blue colour of Cu2+ compared to colourless Hg2+, Pb2+ and Zn2+ increase the absorption and hence the value of imaginary part of refractive index. The results also show that the SPR curves shift to the right as the concentration of heavy metal ions increases (for concentration 100 ppm and above). This trend was found in all four heavy metal ions. The increase in reso- nance angle with concentration is mainly due to the in- 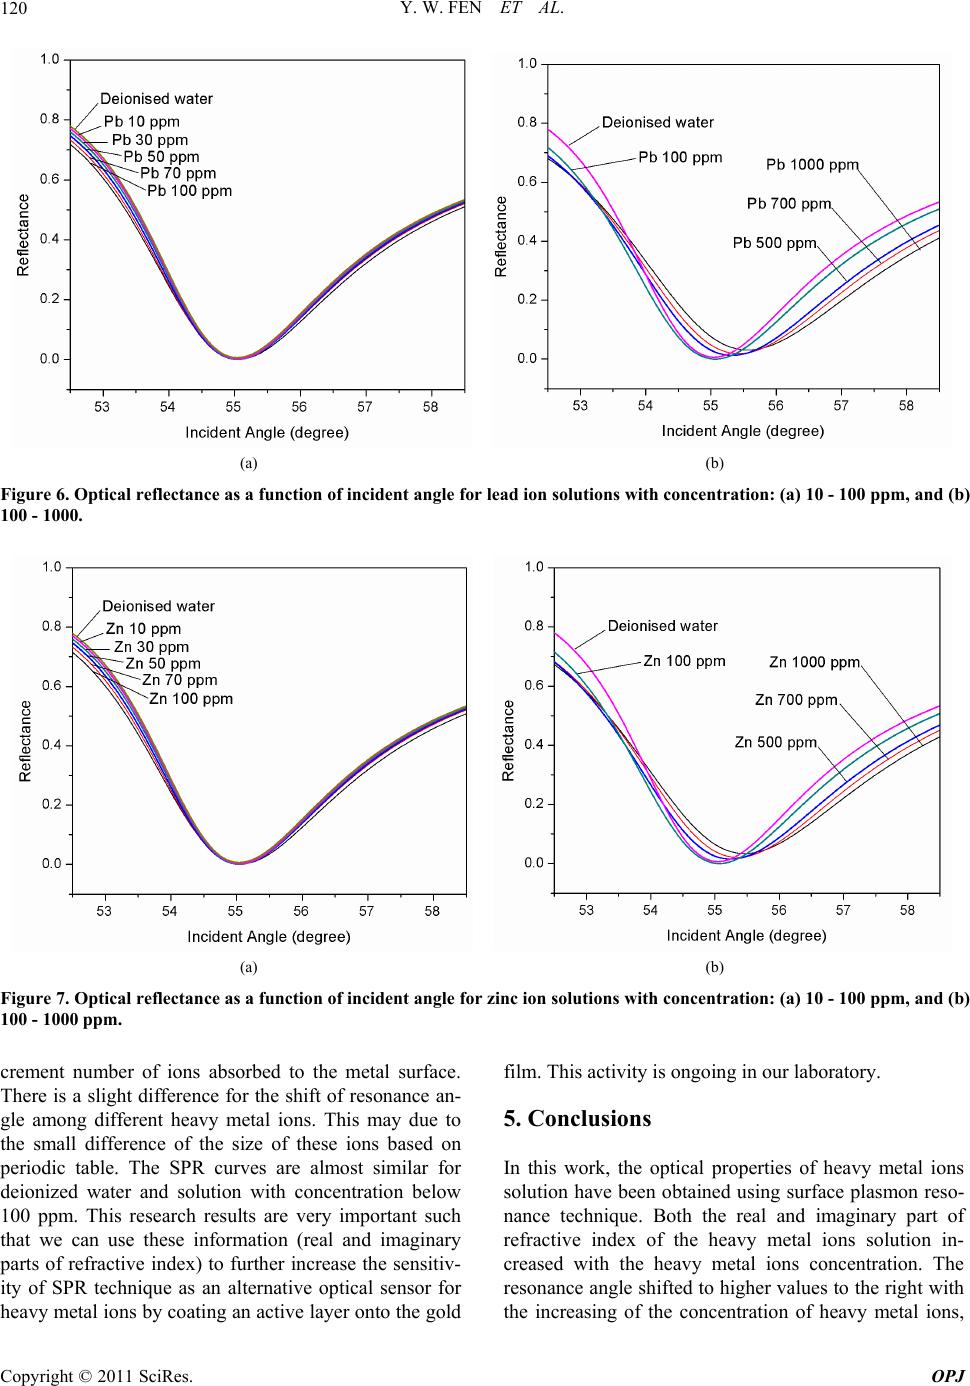 Y. W. FEN ET AL. 120 (a) (b) Figure 6. Optical reflectance as a function of incident angle for lead ion solutions with concentration: (a) 10 - 100 ppm, and (b) 100 - 1000. (a) (b) Figure 7. Optical reflectance as a function of incident angle for zinc ion solutions with concentration: (a) 10 - 100 ppm, and (b) 100 - 1000 ppm. crement number of ions absorbed to the metal surface. There is a slight difference for the shift of resonance an- gle among different heavy metal ions. This may due to the small difference of the size of these ions based on periodic table. The SPR curves are almost similar for deionized water and solution with concentration below 100 ppm. This research results are very important such that we can use these information (real and imaginary parts of refractive index) to further increase the sensitiv- ity of SPR technique as an alternative optical sensor for heavy metal ions by coating an active layer onto the gold film. This activity is ongoing in our laboratory. 5. Conclusions In this work, the optical properties of heavy metal ions solution have been obtained using surface plasmon reso- nance technique. Both the real and imaginary part of refractive index of the heavy metal ions solution in- creased with the heavy metal ions concentration. The resonance angle shifted to higher values to the right with the increasing of the concenration of heavy metal ions, t Copyright © 2011 SciRes. OPJ 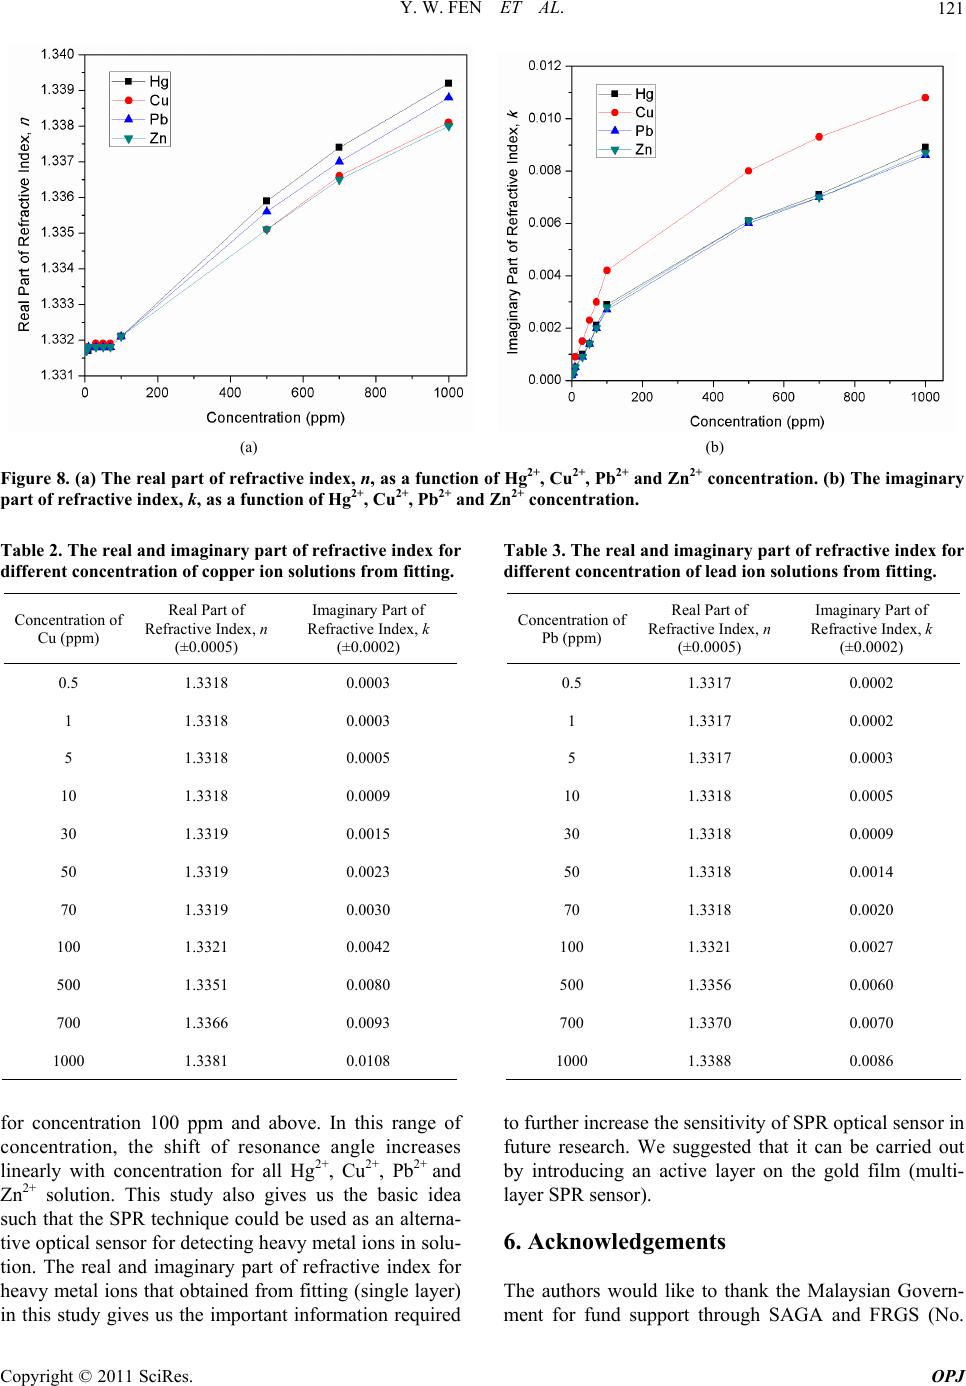 Y. W. FEN ET AL.121 (a) (b) Figure 8. (a) The real part of refractive index, n, as a function of Hg2+, Cu2+, Pb2+ and Zn2+ concentration. (b) The imaginary part of refractive index, k, as a function of Hg2+, Cu2+, Pb2+ and Zn2+ concentration. Table 2. The real and imaginary part of refractive index for different concentration of copper ion solutions from fitting. Concentration of Cu (ppm) Real Part of Refractive Index, n (±0.0005) Imaginary Part of Refractive Index, k (±0.0002) 0.5 1.3318 0.0003 1 1.3318 0.0003 5 1.3318 0.0005 10 1.3318 0.0009 30 1.3319 0.0015 50 1.3319 0.0023 70 1.3319 0.0030 100 1.3321 0.0042 500 1.3351 0.0080 700 1.3366 0.0093 1000 1.3381 0.0108 for concentration 100 ppm and above. In this range of concentration, the shift of resonance angle increases linearly with concentration for all Hg2+, Cu2+, Pb2+ and Zn2+ solution. This study also gives us the basic idea such that the SPR technique could be used as an alterna- tive optical sensor for detecting heavy metal ions in solu- tion. The real and imaginary part of refractive index for heavy metal ions that obtained from fitting (single layer) in this study gives us the important information required Table 3. The real and imaginary part of refractive index for different concentration of lead ion solutions from fitting. Concentration of Pb (ppm) Real Part of Refractive Index, n (±0.0005) Imaginary Part of Refractive Index, k (±0.0002) 0.5 1.3317 0.0002 1 1.3317 0.0002 5 1.3317 0.0003 10 1.3318 0.0005 30 1.3318 0.0009 50 1.3318 0.0014 70 1.3318 0.0020 100 1.3321 0.0027 500 1.3356 0.0060 700 1.3370 0.0070 1000 1.3388 0.0086 to further increase the sensitivity of SPR optical sensor in future research. We suggested that it can be carried out by introducing an active layer on the gold film (multi- layer SPR sensor). 6. Acknowledgements The authors would like to thank the Malaysian Govern- ment for fund support through SAGA and FRGS (No. Copyright © 2011 SciRes. OPJ  Y. W. FEN ET AL. 122 Table 4. The real and imaginary part of refractive index for different concentration of zinc ion solutions from fitting. Concentration of Zn (ppm) Real Part of Refractive Index, n (±0.0005) Imaginary Part of Refractive Index, k (±0.0002) 0.5 1.3317 0.0002 1 1.3317 0.0002 5 1.3317 0.0003 10 1.3318 0.0005 30 1.3318 0.0009 50 1.3318 0.0014 70 1.3318 0.0020 100 1.3321 0.0028 500 1.3351 0.0061 700 1.3365 0.0070 1000 1.3380 0.0087 5523901) research grants. The laboratory facilities pro- vided by the Department of Physics, Faculty of Science, Universiti Putra Malaysia, are also acknowledged. 7. References [1] H. M. Kagan and W. Li, “Lysyl Oxidase: Properties, Specificity, and Biological Roles Inside and Outside of the Cell,” Journal of Cellular Biocheistry, Vol. 88, No. 4, 2003, pp. 660-672. doi:10.1002/jcb.10413 [2] I. Hamza and J. D. Gitlin, “Copper Chaperones for Cyto- chrome c Oxidase and Human Disease,” Journal of Bio- energetics and Biomembranes, Vol. 34, No. 5, 2002, pp. 381-388. doi:10.1023/A:1021254104012 [3] L. Cai, X. K. Li, Y. Song and M. G. Cherian, “Essential- ity, Toxicology, and Chelation Therapy of Zinc and Copper,” Current Medicinal Chemistry, Vol. 12, No. 23, 2005, pp. 2753-2763. doi:10.2174/092986705774462950 [4] T. W. Clarkson, L. Magos and G. J. Myers, “The Toxi- cology of Mercury—Current Exposures and Clinical Manifestations,” The New England Journal of Medicine, Vol. 349, No. 18, 2003, pp. 1731-1737. doi:10.1056/NEJMra022471 [5] F. Pizarro, M. Olivares, V. Gidi and M. Araya, “The Gastrointestinal Tract and Acute Affects of Copper in Drinking Water and Beverages,” Reviews on Environ- mental Health, Vol. 14, No. 4, 1999, pp. 231-238. doi:10.1515/REVEH.1999.14.4.231 [6] H. C. Gonick and J. R. Behari, “Is Lead Exposure the Principle Cause of Essential Hypertension?” Medical Hypotheses, Vol. 59, No. 3, 2002, pp. 239-246. doi:10.1016/S0306-9877(02)00207-4 [7] R. R. Dietert, J. E. Lee and I. Hussain and M. Piepen- brink, “Developmental Immunotoxicology of Lead,” Toxicology Applied Pharmacology, Vol. 198, No. 2, 2004, pp. 86-94. doi:10.1016/j.taap.2003.08.020 [8] R. A. Goyer, “Results of Lead Research: Prenatal Expo- sure and Neurological Consequences,” Environmental Health Perspectives, Vol. 104, No. 10, 1996, pp. 1050- 1054. doi:10.1289/ehp.961041050 [9] B. Liedberg, C. Nylander and I. Lundstrom, “Surface Plasmon Resonance for Gas Detection and Biosensing,” Sensors and Actuators B: Chemical, Vol. 4, 1983, pp. 299-304. doi:10.1016/0250-6874(83)85036-7 [10] J. Homola, S. S. Yee and G. Gauglitz, “Surface Plasmon Resonance Sensors: Review,” Sensors and Actuators B: Chemical, Vol. 54, No. 1-2, 1999, pp. 3-15. doi:10.1016/S0925-4005(98)00321-9 [11] Z. Salamon, H. A. Macleod and G. Tollin, “Surface Plasmon Resonance Spectroscopy as a Tool for Investi- gating the Biological and Biophysical Properties of Membrane Protein System I: Theoretical Principles,” Biochimica et Biophyica Acta, Vol. 1331, No. 2, 1997, pp. 117-129. doi:10.1016/S0304-4157(97)00004-X [12] K. Matsubara, S. Kawata and S. Minami, “Optical Che- mical Sensor Based on Surface Plasmon Measurement,” Applied Optics, Vol. 27, No. 6, 1988, pp. 1160-1163. doi:10.1364/AO.27.001160 [13] H. Kano and S. Kawata, “Grating-Coupled Surface Plas- mon for Measuring the Refractive Index of a Liquid Sample,” Japanese Journal of Applied Physics, Vol. 34, No. 1, 1995, pp. 331-335. doi:10.1143/JJAP.34.331 [14] I. Chegel, Y. M. Shirshov, E. V. Piletskaya and S. A. Piletsky, “Surface Plasmon Resonance Sensor for Pesti- cide Detection,” Sensors and Actuators B: Chemical, Vol. 48, No. 1-3, 1998, pp. 456-460. doi:10.1016/S0925-4005(98)00084-7 [15] W. Zhen and C. Yi, “Analysis of Mono- and Oligosac- charide by Multiwavelength Surface Plasmon Resonance (SPR) Spectroscopy,” Carbohydrate Research, Vol. 332, No. 2, 2001, pp. 209-213. doi:10.1016/S0008-6215(01)00060-X [16] W. Y. W. Yusmawati and M. Y. W. Mahmood, “Optical Properties and Kinetic Behavior of Chlorine in Pure Wa- ter and Swimming Pool Water Using Surface Plasmon Resonance Technique,” American Journal of Applied Sciences, Vol. 4, No. 12, 2007, pp. 1024-1028. doi:10.3844/ajassp.2007.1024.1028 [17] W. Y. W. Yusmawati, H. P. Chuah and M. Y. W. Mah- mood, “Optical Properties and Sugar Content of Com- mercial Carbonated Drinks Using Surface Plasmon Re- sonance,” American Journal of Applied Sciences, Vol. 4, No. 1, 2007, pp. 1-4. doi:10.3844/ajassp.2007.1.4 [18] G. T. Sincerbox and J. C. Gordon, “Small Fast Large- Aperture Light Modulator Using Attenuated Total Re- flection,” Applied Optics, Vol. 20, No. 8, 1981, pp. 1491- 1496. doi:10.1364/AO.20.001491 [19] L. Lévesque, B. E. Paton and S. H. Payne, “Precise Thickness and Refractive Index Determination of Po- Copyright © 2011 SciRes. OPJ  Y. W. FEN ET AL. Copyright © 2011 SciRes. OPJ 123 lymide Film Using Attenuated Total Reflection,” Applied Optics, Vol. 33, No. 34, 1994, pp. 8036-8040. doi:10.1364/AO.33.008036 [20] J. Homola, “Surface Plasmon Resonance Based Sensor,” 1st Edition, Springer, New York, 2006. [21] A. R. Sadrolhosseini, M. M. Moksin, H. L. L. Nang, M. Norozi, W. M. M. Yunus and A. Zakaria, “Physical Properties of Normal Grade Biodiesel and Winter Grade Biodiesel,” International Journal of Molecular Sciences, Vol. 12, No. 4, 2011, pp. 2100-2111. doi:10.3390/ijms12042100 [22] R. C. Weast and M. J. Astle, “CRC Handbook of Chem- istry and Physics,” 59th Edition, CRC Press, West Palm Beach, 1979. [23] D. J. Webb, R. P. Tatam and D. A. Jackson, “A Novel Interferometric Liquid Refractometer,” Review of Scien- tific Instruents, Vol. 60, No. 10, 1989, pp. 3347-3348. doi:10.1063/1.1140529 [24] S. M. Ma, B. M. Han, J. H. Jo and S. Chang, “Optical Excitation Conditions for Surface Plasmon at an Alu- minium-Liquid Interface,” Journal of the Korean Physi- cal Society, Vol. 37, No. 5, 2000, pp. 788-792. doi:10.3938/jkps.37.788
|