Journal of Service Science and Management, 2011, 4, 357-367
doi:10.4236/jssm.2011.43042 Published Online September 2011 (http://www.SciRP.org/journal/jssm)
Copyright © 2011 SciRes. JSSM
357
Box-Scheme Based Delivery System of Locally
Produced Organic Food: Evaluation of Logistics
Performance
T. Bosona, G. Gebresenbet, I. Nordmark, D. Ljungberg
Department of Energy and Technology, Swedish University of Agricultural Sciences, Uppsala, Sweden.
Email: Techane.Gari.Bosona@slu.se, tg.bosona@live.se
Received May 7th, 2011; revised June 18th, 2011; accepted June 30th, 2011.
ABSTRACT
The local food systems such as fruit and vegetable box-schemes are gaining new profitable niche markets as the de-
mand for local food is increasin g. This paper presen ts the study mad e on box-sch eme based lo cal food supply system in
Sweden, the Roslagslådan network, in which three distributors of locally produced organic food (LPOF) were th e ma in
actors. The objective of the study was to investigate the Roslagslådan LPOF supply network and evaluate its logistics
performanc e. The study was based on literature review, interview, field measurement and route simulation and optimi-
sation (in terms of route distance and driving time) analysis. The geographic information system (GIS) software was
used to map the locations of the distributing companies and their delivery points (customer locations) while Route
LogiX software was used for the simulation and optimisation analyses of routes for collection and distribution of LPOF,
mainly vegetables and herb-based products. From the quantified information, the three companies distributed, on av-
erage about 134 bo xes of LPOF to about 116 delivery points, once in two weeks period mainly during August-October.
The distribution via Roslagslådan network was supplemented with other means of selling: on farm sale, open market
sales and selling via supermarket. The route optimisatio n analysis resulted in significant savings in ro ute distance and
delivery time. The savings in distance were up to 76%, 23% and 32% for Company-1, Comp any-2 and Company-3 re-
spectively while the corresponding savings in delivery time were up to 75%, 10% and 16%. This reduction in distance
and time led to positive improvement toward the environmental and economical issues enhancing the sustainability of
local food systems.
Keywords: Sw eden, Roslagslådan Network, Box-scheme, Locally Produced Or ganic Food, Route Analysis
1. Introduction
The local food systems are gaining new profitable niche
markets as consumers start to value traceability and pro-
duction quality of locally produced food over cheaper
food grown and processed at unknown places around the
globe. As a result, fruit and vegetable box-scheme based
delivery systems are emerging as alternatives to conven-
tional and centralized food delivery systems [1-3]. Al-
though a common understanding of local food is its
proximity to production place to customers, other char-
acteristics such as small scale, greenness and socially
sustainable have been associated with it. Consumers
should be aware that purchasing local food has implica-
tions for biodiversity and landscape, local employment,
fair trade and social justice [4]. Brown et al. [3] studied
commercial box schemes (in England and France) of
local food produced approximately within 100 km radius
and identified that customers have been motivated (to
purchasing from the box scheme) by positive contribu-
tion to the ecosystem, food quality and pleasure. The
increasing demand for organic, welfare-friendly and lo-
cally produced food is creating more opportunities for
both existing farmers producing local food and for new
entrants to farming.
Due to political desires to reshape rural spaces to
market niche and quality food products and foster ‘alter-
native’ channels of food provision, local food is gaining
prominence within debates how to encourage the explo-
rations of the connections along the food chain, including
links between producers and retailers [1,5]. Therefore,
more research is needed to get better understanding on
consumers’ perceptions of local food, the impact of local
foods on rural-urban interactions and the problems re-
Box-Scheme Based Delivery System of Locally Produced Organic Food: Evaluation of Logistics Performance
358
lated to local food systems. Usually, consumers perceive
local food as “expensive” and not available at the right
time with required quantity as local sourcing is often
seasonal [3].
In Sweden, farmers markets have existed for hundreds
of years enhancing the delivery of products from local
producers to consumers [2,6]. Although open-air markets
exist mainly during the harvest season (August to Octo-
ber), they have social, cultural and economical benefits
as they are integrating producers and consumers. How-
ever, from logistics point of view, the main problem re-
lated to such selling system (open-air market) is that the
producers drive their own cars and also most of the buy-
ers drive to the market place. This leads to congestion
and increases emissions of greenhouse gases [2,6]. Simi-
lar problem related to local food distribution was re-
ported by Coley et al. [4] i.e. for large-scale vegetable
box system, the bulk of the emissions arise not from
chilling or mass transportation to regional hubs using
heavy goods vehicles but the final delivery phase using
light goods vehicles. This indicates that the local food
delivery systems should be evaluated based on the spe-
cific situations of producers and customers in the area/
region under consideration. Also, logistic cost has been a
bottleneck for small and local food producers to compete
with large scale and conventional food supply systems.
These logistic related problems can be counteracted by
creating efficient logistics systems adaptable for local
food systems such as coordinated box-scheme delivery
systems, direct sale (example to restaurants, schools),
integration into large scale food distribution systems and
planning optimized food delivery routes[6,7]. Such logis-
tics improving efforts should be supplemented by suc-
cessful planning and designing efficient distribution sys-
tems [8]. Freidberg and Goldstein [9] pointed out that as
local food is scarce on market, researches should focus
not only on quality of food but also on building genu-
inely alternative food supply networks. In the current
study, the Roslagslådan LPOF supply network (see Fig-
ure 1) which is operating in Roslag region, in Sweden,
has been investigated.
1.1. Roslagslådan LPOF Supply Network
Roslagslådan network is located in the region of Roslag
that is located in the Stockholm and Uppsala provinces,
Sweden (see Figure 2). In the region of Roslag, there is
an economic association known as Roslagsmat estab-
lished for small scale, local farmers and food producers
and it promotes “local food with identity and quality”. At
present, it has around 20 members who produce organic
food and sell directly to consumers and to retailers. The
produces are diversified but they are traceable and KRAV
certified. KRAV is the Swedish labelling certification that
a product has been organically produced without using any
synthetic fertilizers and pesticides and the livestock raising
does not rely on feed additives. However, this certification
does not guarantee quality [11].
In May 2006, the association initiated a pilot project to
explore and develop marketing channels for small scale
food producers in the region. As a result the concept of
Roslagslådan food supply network emerged with the ba-
sic purpose to avoid unnecessary transport distance and
logistics cost and to promote LPOF with high quality.
There are three companies which are main actors of the
network (see Figure 1). They collaborate chiefly for mu-
tual marketing and distribution benefits. They do have
their own farms for growing organic food and also col-
lect the produces from local farmers and distribute to the
retailers and consumers.
1.2. Main Characteristics of the Roslagslådan
Network
The main characteristics of the three main actors in the
Roslagslådan network are presented in Tables 1 and 2. In
addition to distributing LPOF to consumers, they also use
on farm sale and open market sales which promote social
connections and communications.
Table 2 indicates the distance of delivery routes varied
Table 1. Product type and me ans of delivery.
Farm Production type Selling channel
Company-1
Produces only herb-based products such as vinegars, oils, skin
products and teas; but also distributes vegetables (sourced
from Company-3)
Through Roslagslådan network (August-December)
Company-2
Tomato, cucumber, aubergine, paprika, lettuce, capsicum,
carrot and snow peas but potatoes, celeriac, squash, leek, pars-
nips, onion, garlic, cabbage, broccoli, bean, corn, parsley, dill,
red beet and meat*
On site sell (July-September) ; Annual open market;
through nearby ICA supermarket (May-September);
through Roslagslådan network (1/3 of its harvest) (August-
October)
Company-3
Vegetable (white, red and Savoy Cabbages), Root products
( beet, carrot and parsnip) and 17 - 20 different varieties of
potatoes; sheep**
Through Roslagslådan network (August-December); via
Supermarkets; direct supply to restaurants
*Senneby farm rears a small number of sheep, which are slaughtered and sold locally during the winter; **Forsbergs Gris & Grönt rears a number of sheep,
which are slaughtered and used for wool production locally.
Copyright © 2011 SciRes. JSSM
Box-Scheme Based Delivery System of Locally Produced Organic Food: Evaluation of Logistics Performance359
Figure 1. Concept of Roslagslådan food supply network. The information flow indicates how the social interaction is in-
creased due to the network.
Table 2. Characteristics of the existing distribution routes.
Route Farm Vehicle type Vehicle Capacity
[m3]
Route length
[km]
Total time
[h:min]
Route 1* Company-1 Peugeot Expert van 4 190 8:00
Route 2 Company-2 (route- I) VW transporter 5 174 5:30
Route 3 Company-2 (route-II) Renault Kangoo 2.8 109 4:00
Route 4 Company-3 (route-I) Citroen Jumper 9HDI 7.5 94 2:36
Route 5 Company-3 (route-II) Vehicles of other transport company (collaborator)N/A 131 N/A
*Collecting from production place and delivery to distribution point (complete route). It doesn’t include the distance travelled (which varies from 624 m to 70
km) by each of its customers to collects the produce from distribution point (see Figure 3).
from 94 km to 190 km while the respective transport
time (including loading/unloading) varied from 2:36 hr:
min to 8 hr. For Company-3, route-II covered the deliv-
ery from production area (Östhammar) to large cities,
namely Uppsala and Stockholm and the vehicle used for
delivery on this route was owned by external transport
company (see Figure 2). About 23% of the produces
delivered by Company-3 was performed via its route-II.
For the remaining route (see Table 2) the companies used
their own vehicles whose volume varies from 2.8 m3 to 7.5
m3.
Prior to the initiation of the Roslagslådan network, the
members have experienced constraints associated with
the logistics service. After garnering a pilot group of
customers via a local newspaper advertisement, the three
partners began planning logistical routes based on where
Copyright © 2011 SciRes. JSSM
Box-Scheme Based Delivery System of Locally Produced Organic Food: Evaluation of Logistics Performance
360
Figure 2. Location of study area and routes and customers
in the Roslagslåda network.
their clients lived. After a period of trial and error, Ro-
slagslådan network became a fully fledged delivery
scheme in 2006 and over four years, the operation has
developed a steady customer base, totalling approxi-
mately 150 regular customers.
The main objective of this study was to evaluate the
logistics performances of the Roslagslåda network mainly
in relation to transport distance and time and develop
recommendation for improvement, in case of any gap
identified. The specific objectives were to:
Identify and map the locally produced organic food
producers, distributors and delivery points in the
Roslagslådan network
Investigate the existing packaging condition, deliv-
ery frequency and quantity
Investigate the existing collection and distribution
routes
Carry out route simulation/optimisation analysis in
relation to transport distance and time
In summary, improving the logistics performance in-
crease the competitiveness of local food producers and
promote the sustainability of local food systems. In the
existing situation, the Roslagslådan LPOF supply net-
work is relatively good example of coordinated and inte-
grated local food delivery system. However, the finding
of this study indicated that further improvements could
be gained by replanning more optimal routes and revis-
ing delivery time windows. The remaining part of this
paper is structured as follows. In Section 2, the materials
and methods are described. The results are presented in
Section 3, while the main findings have been discussed
in Section 4. Finally, the major conclusions have been
drawn in Section 5.
2. Materials and Methods
In order to understand the characteristics of Roslagslådan
LPOF supply network and map out its logistics activities,
the information on packaging, the existing delivery
routes, the type and capacity of vehicles used, the main
bottlenecks or/and coordination in the food delivery sys-
tems were gathered and analyzed. The study was con-
ducted through literature review, interviews, field meas-
urements and route analysis (simulation and optimisa-
tion).
2.1. Data Collection
In order to complement the literature review, the three
main actors in the Roslagslådan network and some of
their customers were interviewed. These interviews were
conducted face-to-face, via telephone, and via email. In
addition to conducting interview, field measurements
were carried out in September and October months, 2009.
Data collection on the coordinates of location of produc-
ers, distributors, distribution points and food collection/
distribution routes was done using the global positioning
system (GPS). Two pieces of portable GPS receivers and
a stop watch were used. The portable GPS receivers were
used to collect information about points along 5 delivery
routes including time and coordinates of required loca-
tions. The recorded and stored data could be uploaded to
PC with the help of USB interference cable. The second
GPS receiver was used to quickly capture coordinates of
all stops or distribution points where, simultaneously
vehicles’ arrival and departure times, the numbers of
delivered boxes and customers’ postal addresses were
registered.
2.2. Mapping the Project Area
The location of the three distributing companies and their
delivery points in the network were mapped with ArcMap
of GIS software [12] utilizing the coordinates of each
point recorded during data gathering and field measure-
Copyright © 2011 SciRes. JSSM
Box-Scheme Based Delivery System of Locally Produced Organic Food: Evaluation of Logistics Performance361
ment (see Figure 2). The distribution Company-1 is lo-
cated at 59˚5028 N latitude and 18˚2631 E longitude
while Company-2 is located at 59˚5801 N latitude and
18˚5056 E longitude and Company-3 is located at
60˚1619 N latitude and 18˚0506 E longitude. Com-
pany-2 owns farm area that covers about 6.15 hectares in
its three open fields and one green house (650 m2).
Company-3 own farm land that covers about 20 hectares.
Customers of Roslagslådan network are Restaurants,
retailers and non business people. Also, the distribution
may be to working places, direct to residents and to pub-
lic waiting places.
2.3. The Existing Distribution System
In addition to on farm sale, the three main companies
distribute their products to their customers. Company-1
collects the food products from the farm owned by Com-
pany-3 and also from at least two other producers of
small quantity (see Figure 3). Then it transports the
products to a distribution point located at 59˚4435 N
and 18˚2203 E longitude, which is about 14 km away
from the place of Company-1. From the distribution
point, about 15 customers collect the products. One of
the customers is found in Stockholm, about 67 km far
away from the distribution point. For the remaining 14
customers the distance from the distribution point varies
from 1 km to 25 km.
Company-2 uses two routes (route-I and route-II) to
distribute LPOF to a distribution point and directly to the
place of some customers (see Figure 4). The company
first loads the produces from its own farm and then on the
way to distribution it picks the produces of small produc-
ers and distributes directly to some of its customers and to
a distribution point from where some customers collect
their orders.
Figure 3. The current distribution system of Company-1.
Similar to Company-2, the distributing Company-3 has
two delivery routes (see Figure 5). In its surrounding
area, the company uses route-I while route-II reaches
delivery points located at Östhammar, Uppsala and
Stockholm (three places in Stockholm) cities (see Figure
2 and 8(c)). The company delivers only to Östhammar
from where the products are distributed further to Upp-
sala and Stockholm by other external transporter (col-
laborator).
2.4. Route Analysis
Using Route LogiX software [13] and data gathered dur-
ing field measurement, route optimization analysis was
done to investigate the optimality of the current distribu-
tion routes of food products and to analyze the new dis-
tribution route based on different scenarios. RoutelogiX
software has most powerful vehicle routing and it finds
optimised routes by minimizing driving distance and
time, which in turn reduces transport cost and emission
of green house gases [13]. In total, seven different routes
Figure 4. The current distribution system of Company-2.
Figure 5. The current distribution system of Company-3.
The producer distributes to its customers.
Copyright © 2011 SciRes. JSSM
Box-Scheme Based Delivery System of Locally Produced Organic Food: Evaluation of Logistics Performance
362
were analysed for the three distributing companies of
Roslagslådan LPOF supply network.
2.4.1. Routes of Company-1
For Company-1, four routes i. e. a single collection route
and three distribution routes were studied. For the collec-
tion route, first the existing route distance and delivery
time was determined and thereafter the route was opti-
mised. For the distribution routes, three scenarios were
considered.
2.4.1.1. When Company-1 Delivers to a Distribution
Point from Where Customers Collect Their
Orders
This scenario is the same as existing route where the
company transport the products to the distribution centre
located at 59˚4435 N latitude and 18˚2203 E longi-
tude. The route analysis was done with and without in-
cluding the customer in Stockholm, because the customer
in Stockholm is relatively far from the area where Com-
pany-1 operates, and its impact on the simulation results
is high in relation to driving distance and time.
2.4.1.2. When Company-1 Distributes Products Directly
to Its Customers
In this case, the company delivers to each customers.
Similar to scenario 1, the simulation analysis was done
including and excluding the customer in Stockholm.
2.4.1.3. Scenario 3: When Only the Delivery to the
Distribution Point is Considered
In this case, the company delivers only to the distribution
place, from where its customers collect their order.
However, in Scenario 3, the transport distance and time
was simulated only for the delivery to the distribution
place, neglecting the transport distance and time taken by
each customer to collect their order taking into consid-
eration that most of the customers might collect their
order on the way from job or other trip.
2.4.2. Rout es of C omp any-2
There were two distribution routes for this company. In
both cases, first the route distance and travel time were
simulated for existing (unoptimized) route (i.e . following
the order of visiting each customer) and then the routes
were optimized. The transport distance and time deter-
mined for optimized routes were compared to that of
unoptimized routes.
2.4.3. Combined Distribution Route for Company-1
and Company-2
In this case, a single route was proposed for distributing
the products to all the customers of the two companies.
The optimized driving distance and total time of this new
route was compared to the sum of the three existing
routes i.e. scenario-1 of Company-1 (excluding its cus-
tomer in Stockholm) and the two routes of Company-2.
The distance and time were determined for the combined
and optimized route considering the address of Com-
pany-2 as starting and end point of the delivery tour on
this new route.
2.4.3. Rout es of C omp any-3
For this company, the route distance and travel time were
determined for unoptimized and optimized cases of its
two routes and then the unoptimized and optimized
routes were compared. In route II, simulation was done
taking into consideration the case when a single trans-
porter (collaborator) picks the products from Östhammar,
on the way from job (therefore, only one way journey
was considered) and transports to the customers in Upp-
sala and Stockholm cities.
For all the three companies, the comparison analysis
was done using the driving distance and total time deter-
mined for optimised and unoptimised routes. However in
this comparison analysis, the driving distance and time
considered for the existing routes, were not the measured
values, but the simulated values. This was preferred in
order to make the analysis approach consistent, because
for some scenarios, there were no distance and time val-
ues recorded for the routes.
In all cases, the loading and unloading time was esti-
mated based on the information gathered during field
measurement and interview. For loading time (for each
company) 15 to 30 minutes was considered depending on
the volume of produces loaded. The unloading time (in-
cluding delivery time) was taken to be equal to 2 minutes
on average for each customer. When picking products
(during product collection) the loading time at the place
of each producer (producing small quantity) was consid-
ered to be about 5 minutes.
During the field measurement it was learnt that the ex-
isting delivery routes were formed based on the delivery
time window set by the customers. The distribution
companies try to fulfil the need of customers although
the order of visiting the customers seems to be uneco-
nomical.
3. Results
3.1. Packaging
Transporting fresh producers requires appropriate pack-
aging. A wooden box, locally produced from pine was
used as the standard packaging material (see Figure 6).
The box is known as Roslagslåda and it is reused. In ad-
dition to the wooden boxes, paper bags are available and
used to complement the box when there is additional
order. The paper bag is also used when customer chooses
Copyright © 2011 SciRes. JSSM
Box-Scheme Based Delivery System of Locally Produced Organic Food: Evaluation of Logistics Performance
Copyright © 2011 SciRes. JSSM
363
it rather than wooden box. The sizes of the wooden box
and paper bag are 25 × 30 × 40 and 35 × 25 × 17 cm re-
spectively. Each delivery time the wooden box or paper
bag contains 8 to 10 different types of fresh vegetables
and root vegetables.
3.2. Delivery Quantity and Frequency
Considering the delivery amount observed during the
field measurement, about 134 boxes were distributed by
the three companies per delivery day. Large number of
boxes (about 111) was distributed by Company-2 while
Company-1 and Companu-2 delivered about 17 and 26
boxes respectively. About 71 delivery points (customers)
were recorded for Company-2. Company-3 had 30 deliv-
ery points while for Company-1, only 15 delivery points
were recorded (see Figure 7).
All three companies carried out the distribution of
LPOF once in two weeks period from August up to Oc-
tober. The deliveries of Company-1 and Company-3 ex-
tend until December. Company-1 also delivers once a
month in January and February.
3.3. Route Analysis
Table 3 presents the result of route simulation/optimisa-
tion analysis for the delivery routes of the three compa-
nies. For Company-1, the simulated driving distance and
total time for unoptimised collection route were about
225 km and 3:49 hr:min respectively. For this route,
there was no improvement obtained from optimisation
analysis indicating that the existing collection route is
optimum (see Table 3).
Comparing scenario-2 with scenario-1 (Company-1),
the driving distance and total time (excluding customer
in Stockholm) were reduced from 282 km to 119 km and
from 6:48 hr:min to 3:42 hr:min. This indicated that the
driving time and transport distance were improved by
about 58% and 46% respectively. In scenario-3, the
driving distance and total time were about 29 km and 54
minutes (i.e. to deliver to the distribution point). When
compared to the existing route of scenario-1, scenario3
improved the driving distance by 76% and total time by
74%.
Concerning Company-2, for route-I (Figure 4), the
distance was reduced from 156 km to 140 km while the
time was reduced from 5:36 to 5:12 hr:min indicating
that the distance and time were improved by 10% and
7% respectively. Similarly for route-2, the driving dis-
tance was reduced from 194 km to 149 km while total
time was reduced from 6:54 hr:min to 6:13 hr:min re-
spectively indicating that the distance and time were re-
duced by 23% and 10% respectively.
Regarding the combined routes of Company-1 and
Company-2 (see Figure 8a), the sum of distance for the
three existing routes (scenario1 of Company-1 and two
routes of Company-2) was about 632 km and the respec-
tive total time was 19:18 hr:min. By using the new com-
bined route, the total distance and time were reduced to
287 km and 12:41 hr:min which implied the improve-
ment of 55% and 34% for transport distance and time
respectively.
Regarding Company-3, for route-I (Figure 5), the
transport distance (unoptimised) was 160 km and the
corresponding total delivery time was 5:39 hr:min. When
optimized, the figures reduced to 108 km and 4:44
hr:min which meant improvement of 32% for distance
and 16% for time. For route-2, the analysis result indi-
cated that the transport distance and time (single trip) are
163 km and 3:34 hr:min and the optimization analysis
(a) (b) (c)
Figure 6. LPOF products of Company-2. (a) Organic vegetables on the farm field owned by Company-2; (b) boxes filled with
LPOF and ready for distribution by Company-2; (c) standard box of Roslagslådan network (source www.sennebytradgard.nu
nd a
www.roslagsmat.se).
Box-Scheme Based Delivery System of Locally Produced Organic Food: Evaluation of Logistics Performance
364
(a)
(b)
Figure 7. Number of delivery quantities and delivery points
recorded for each company. (a) The number of boxes deliv-
ered on each delivery day (once in 2 weeks); (b) the number
of delivery points recorded during field measurements.
indicated that the existing route (route-2) is optimum.
Figure 8 presents examples of unoptimized and optimized
routes.
4. Discussions
Nowadays, in relation to food safety and food security,
the demand for locally produced food is increasing and
the local food systems are being considered as alternative
strategies to conventional large scale food supply chains
[14-16]. This situation helped the companies in the Ro-
slagslådan network to gain costumers acceptance in rela-
tively short time and with less expenses to introduce their
marketing concept.
Roslagslådan is one example of business networks that
could facilitate some of the social and economic benefits
of local food systems. When food supply systems operate
as networks, social benefits such as potential for mutual
learning, reduced transaction costs, social cohesion and
competitive strengths emerge [17-21].
The members of the network are dedicated to satisfy
the consumers by supplying food with identity and qual-
ity. For example, the crops are allowed to mature in the
field to their specific requirements and they deliver fresh
produce to consumers. However, due to seasonal con-
straints, the varieties of vegetable to be supplied during
every distribution tour should be decided by the supplier
depending on the season and available produces.
The Roslagslådan LPOF supply network could facili-
tate the flow of information (see Figure 1). It created
good opportunity for the customer and the producers to
have contact and that helps the producer to get direct
response from the customers. Newsletters are distributed
with the delivery boxes outlining the varieties included in
the box, source of the produce and its price, relevant in-
formation about the vegetables and recipes for some pro-
duces which are uncommon in the region. The newsletter
also includes contact details, any relevant news or com-
munication and additional produce available for custom-
ers to purchase through Roslagslådan network from other
members of Roslagsmat. Such a local food brand, with
assurance of sustainability and quality, increases con-
sumers’ confidence [7].
There is internet based flow of information between
consumers, producers and distributing companies. The
customers could order the products by telephone or sub-
scribing via internet. The distributors contact the small
producers before starting the distribution and collect the
boxes from each small producer and perform the distri-
bution. The three main actors also play key role in adver-
tising the LPOF in the region. In addition to using news-
letters, in the region, the association arranges market
days 3 times per year between the months of August and
September mainly to promote the direct contact between
producers and consumers and increase consumers’ con-
fidence on the produces.
From the results of route analysis, it was noted that the
simulated value of route distance showed some deviation
from the value recorded during field measurement due to
different measurement errors and/or possible road changes
(i.e. the road embedded in the software may deviate from
the actual road the driver could use). Therefore, it would
be more realistic to do the comparison analysis based on
the simulated values, omitting the recorded values which
were available only for some of the routes (see Tables 2
& 3).
The route optimization analysis revealed that some of
the existing routes were nearly optimal, for example the
collection route for Company-1 and the distribution route-
II of Company-3. On the other hand, significant improve-
ments were gained for some routes. Good improvements
noticed in the distribution routes of Company-1 (e.g. for
Scenarios 2, up to 58% for distance and 46% for time),
Company-2 (up to 23% for distance and 10% for time) and
Company-3 (up to 32% for distance and 16% for time)
(see Table 3).
The highest improvement was observed for the sce-
nario3 for distribution route of Company-1, i.e. 76% for
distance and 75% for time. In scenario3 it was assumed
Copyright © 2011 SciRes. JSSM
Box-Scheme Based Delivery System of Locally Produced Organic Food: Evaluation of Logistics Performance365
Table 3. Summary of route analysis for product collection and distribution by the three companies.
Improvement
Route Driving distance Total time distance time
Collection route
Unoptimized Collection Route
225
3:49
Optimized Collection Route 225 3:44 0 0
Distribution Route
Scenario1
-With customer in Stockholm
414
8:27
-Without customer in Stockholm 282 6:48
Scenario2
-with customer in Stockholm
243
5:05
41.26
39.84
-without customer in Stockholm 119 3:42 57.85 45.59
Company-1
Scenario 3
Delivery to distribution point
29
0:57
75.63
74.32
Route-I
Unoptimized
156
5:36
Company-2 Optimized 140 5:12 10.34 7.14
Route-II
Unoptimized
194
6:54
Optimized 149 6:13 23.14 9.90
Summation of existing 3 routes 632 19:18
Combined route of
company-1 & company-2 New combined route 287 12:41 54.62 34.28
Route-I
Existing (Un optimized)
Optimized
160
108
5:39
4:44
32.14
16.22
Company-3
Route-II
Existing(unoptimized)
optimized
163
163
3:34
3:34
0
0
that the customers could collect the produce from distri-
bution point. Although, this option show good improve-
ment it should be noted that this option might not satisfy
the need of some customers who could not collect the
produce from distribution centre. The other problem re-
lated to this selling system (scenario-3) is that the buyers
drive their own cars to the distribution centre, which in
turn leads to congestion and increases emissions of
greenhouse gases [2,6]. Good improvement (upto 55%
for distance and 34% for time) was also seen when the
combined distribution route was considered for Com-
pany-1 and Company-2. This showed that integrating the
distribution activities of the actors and optimising the
route could result in significant savings and this con-
firmed the findings of previous researches [7,8].
The reduction in the driving distance led to positive
improvement towards environmental issue by reducing
emission. However, from practical point of view, it is
needed to consider other factors such as changing the
delivery time window and using vehicles of more capac-
ity (eg. for combined route of Company-1 and Com-
pany-2), in order to implement the optimised routes. This
is not easy for the distributors as they give priority to the
customers need and it might be difficult for some cus-
tomers to be flexible easily. However, improving the
delivery time window might be facilitated through dis-
cussion between customers and distributing companies.
Due to the increasing concern on environmental deg-
radation and energy crises, effective logistics networks
should consider not only economic and operational per-
formance but also the environmental sustainability of
food supply networks [22]. In the future, as the Ro-
slagslådan network expands or changes, updating the
design of optimal delivery routes with best possible de-
livery time windows, is recommendable to strengthen the
sustainability of the system. The continuation of this
study addresses the environmental, economical, and
management issues related to the sustainability of the
Roslagslådan LPOF supply chain.
5. Conclusions
T
his study mapped out the supply chain of LPOF (locally
Copyright © 2011 SciRes. JSSM
Box-Scheme Based Delivery System of Locally Produced Organic Food: Evaluation of Logistics Performance
366
Figure 8. Examples of distribution routes. (a) presents the combined route of Company-1 and Company-2; (b) and (c) show
unoptimized and optimised routes of Company-3 . (d) illustrates route-II of Company-3, the case where the existing route has
been found to be the best.
produced organic food). As a case study, Roslagslådan
food supply network, in which three LPOF distributing
companies are the main actors, was investigated with the
main aim of evaluating its logistics performance. The
study was based on literature review, interview, field
measurement and route simulation and optimisation (in
terms of route distance and driving time) analysis.
The three companies in the Roslagslådan network dis-
tribute about 134 boxes of LPOF to about 116 delivery
points, once in two weeks period mainly during August-
October, with 5 different distribution routes. The prod-
ucts are mainly vegetables and herb-based products. In
Copyright © 2011 SciRes. JSSM
Box-Scheme Based Delivery System of Locally Produced Organic Food: Evaluation of Logistics Performance367
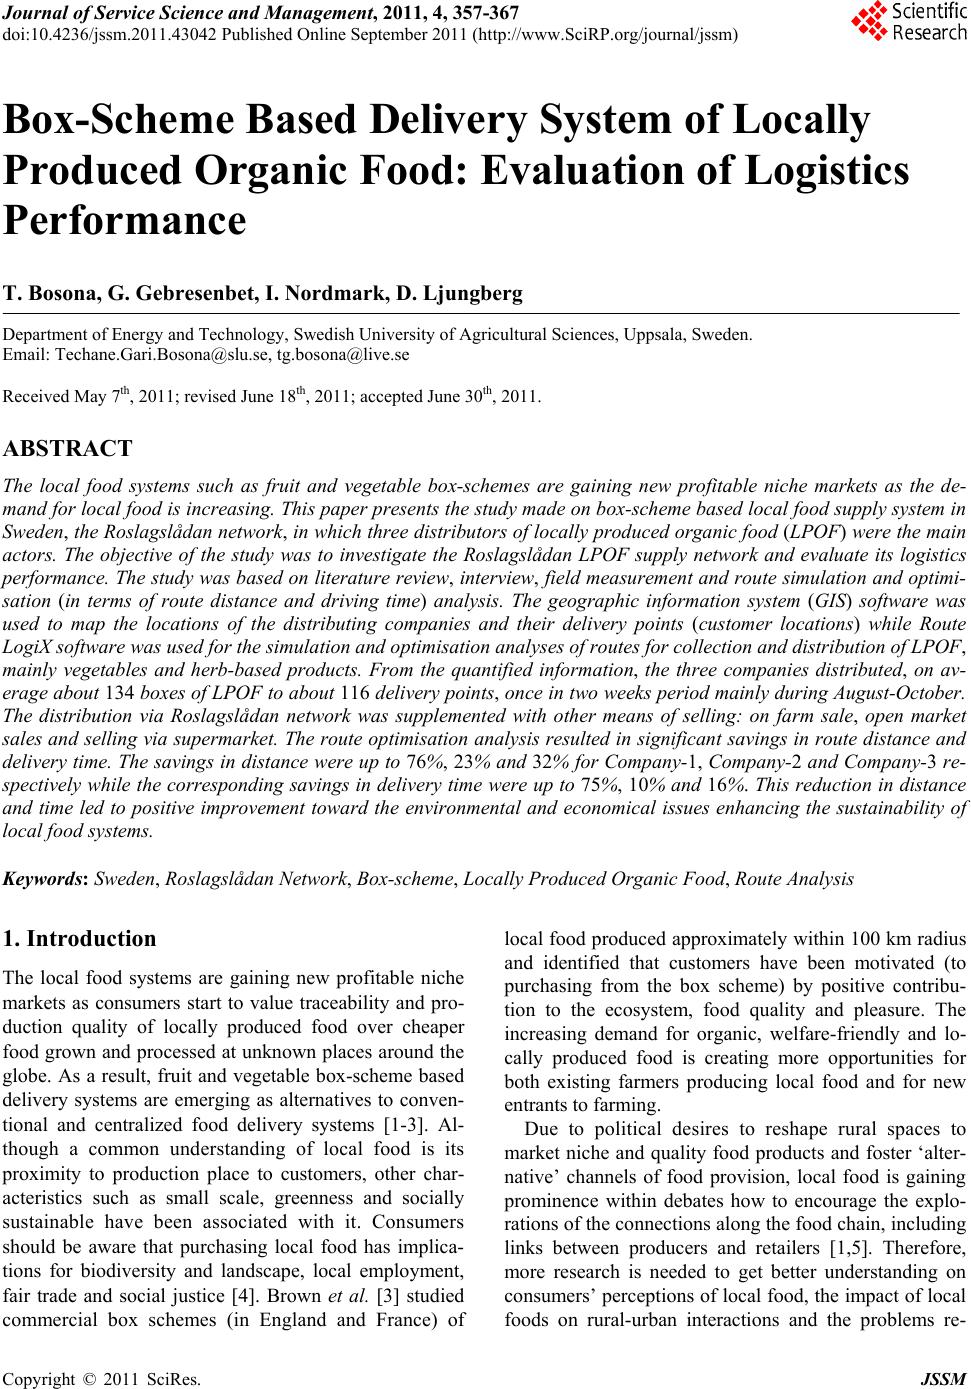
addition to the distributing via Roslagslådan food supply
network, the partners of the network uses also other
means of selling: on farm sale, open market sales and
selling via supermarket.
The locations of the distributing companies and deliv-
ery points (customer locations) were mapped using
ArcMap of GIS software. The route simulation and opti-
misation analyses were conducted utilizing Route LogiX
software. The route optimisation analysis indicated that
for all the three distributors significant savings were
noted in terms of route distance and delivery time. The
savings in distance were 76%, 23% and 32% for Com-
pany-1, Company-2 and Company-3 respectively. The
corresponding savings in delivery time were 75%, 10%
and 16%. This leads to positive improvement toward the
environmental and economical issues enhancing the sus-
tainability of local food systems.
REFERENCES
[1] L. Nichol, “Local Food Production: Some Implications
for Planning,” Planning Theory & Practice, Vol. 4, No. 4,
2003, pp. 409-427. doi:10.1080/1464935032000146264
[2] H. Nilsson, “Local Food Systems from a Sustainability
Perspective: Experiences from Sweden,” International
Journal of Sustainable Society, Vol. 1, No. 4, 2009, pp.
347-363. doi:10.1504/IJSSOC.2009.028906
[3] E. Brown, S. Dury and M. Holdsworth, “Motivations of
Consumers That Use Local, Organic Fruit and Vegetable
Box Schemes in Central England and Southern France,”
Appetite, Vol. 53, No. 2, 2009, pp. 183-188.
doi:10.1016/j.appet.2009.06.006
[4] D. Coley, M. Howard and M. Winter, “Local Food, Food
Miles and Carbon Emissions: A Comparison of Farm
Shop and Mass Distribution Approaches,” Food Policy,
Vol. 34, No. 2, 2009, pp. 150-155.
doi:10.1016/j.foodpol.2008.11.001
[5] B. Ilbery and D. Maye, “Retailing Local Food in the Scot-
tish-English Borders: A Supply Chain Perspective,” Geo-
forum, Vol. 37, No. 3, 2006, pp. 352-367.
doi:10.1016/j.geoforum.2005.09.003
[6] C. Wallgren, “Local or Global Food Markets: A Com-
parison of Energy Use for Transport,” Local Environment,
Vol. 11, No. 2, 2006, pp. 233-251.
doi:10.1080/13549830600558598
[7] T. G. Bosona and G. Gebresenbet, “Cluster Building and
Logistics Network Integration of Local Food Supply
Chain,” Biosystems Engineering, Vol. 108, No. 4, 2011,
pp. 293-302. doi:10.1016/j.biosystemseng.2011.01.001
[8] D. Ljungberg and G. Gebresenbet, “Mapping out the
Potential for Coordinated Goods Distribution in Urban
Areas: The Case of Uppsala,” International Journal of
Transport Management, Vol. 2, No. 3, 2004, pp. 161-172.
doi:10.1016/j.ijtm.2005.07.001
[9] S. Freidberg and L. Goldstein, “Alternative Food in the
Global South: Reflections on a Direct Marketing Initia-
tive in Kenya,” Journal of Rural Studies, in press.
www.elsevier.com/locate/jrurstud
[10] J. Murdoch, “Networks—A New Paradigm of Rural De-
velopment?” Journal of Rural Studies, Vol. 16, No. 4,
2000, pp. 407-419. doi:10.1016/S0743-0167(00)00022-X
[11] KRAV, “Standards for KRAV-Certified Production”.
www.krav. se
[12] Economic and Social Research Institute, “ArcGIS Desk-
top Help,” ESRI GIS Software Corporate, New York,
2008.
[13] DPS, “Route LogiX Professional V5.0.4.39,” Distribution
Planning Software Ltd., Halesowen, 2004.
[14] F. Curtis, “Eco-Localism and Sustainability,” Ecological
Economics, Vol. 46, No. 1, 2003, pp. 83-102.
doi:10.1016/S0921-8009(03)00102-2
[15] M. M. Kroma, “Organic Farmer Networks: Facilitating
Learning and Innovation for Sustainable Agriculture,”
Journal of Sustainable Agriculture, Vol. 28, No. 4, 2006,
pp. 5-28. doi:10.1300/J064v28n04_03
[16] T. Marsden and E. Smith, “Ecological Entrepreneurship:
Sustainable Development in Local Communities through
Quality Food Production and Local Branding,” Geoforum,
Vol. 36, No. 4, 2005, pp. 440-451.
doi:10.1016/j.geoforum.2004.07.008
[17] M. Nousiainen, P. Pylkkänen, F. Saunders, L. Seppnen
and K. M. Vesala, “Are Alternative Food Systems So-
cially Sustainable? A Case Study from Finland,” Journal
of Sustainable Agriculture, Vol. 33, No. 5, 2009, pp.
566-594. doi:10.1080/10440040902997819
[18] A. Hughes, “Geographies of Exchange and Circulation:
Alternative Trading Spaces,” Progress in Human Geog-
raphy, Vol. 29, No. 4, 2005, pp. 496-504.
doi:10.1191/0309132505ph563pr
[19] L. Holloway, R. Cox, L. Venn, M. Kneafsey, E. Dowler
and H. Tuomainen, “Managing Sustainable Farmed Land-
scape through ‘Alternative’ Food Networks: A Case
Study from Italy,” The Geographical Journal, Vol. 172,
No. 3, 2006, pp. 219-229.
[20] A. Halinen and J. Törnroos, “Using Case Methods in the
Study of Contemporary Business Networks,” Journal of
Business Research, Vol. 58, No. 9, 2005, pp. 1285-1297.
doi:10.1016/j.jbusres.2004.02.001
[21] T. Eng, “The Effects of Learning on Relationship Value
in a Business Network Context,” Journal of Business to
Business Marketing, Vol. 12, No. 4, 2005, pp. 67-101.
doi:10.1300/J033v12n04_03
[22] W. D. Solvang and M. H. Hakam, “Sustainable Logistics
Networks in Sparsely Populated Areas,” Journal of ser-
vice science and management, Vol. 3, No. 1, 2010, pp.
72-77. doi:10.4236/jssm.2010.31008
Copyright © 2011 SciRes. JSSM