 Low Carbon Economy, 2011, 2, 165-172 doi:10.4236/lce.2011.23021 Published Online September 2011 (http://www.SciRP.org/journal/lce) Copyright © 2011 SciRes. LCE 165 Energy and Carbon Modeling with Multi-Criteria Decision-Making towards Sustainable Industrial Sector Development in Thailand Aumnad Phdungsilp, Teeradej Wuttipornpun Department of Industrial Engineering, King Mongkut’s University of Technology North Bangkok, Bangkok, Thailand. Email: aumnad@gmail.com Received July 11th, 2011; revised August 4th, 2011; accepted August 10th, 2011. ABSTRACT This paper develops some policy options for Thailand’s industrial sector. The energy simulation model, the Long-range Energy Alternatives Planning (LEAP) system, has been used to simulate how energy might develop from 2005-2030. Five policy interventions are selected, and how these would change energy development is examined, and compared to a reference case. Further, the industrial policy options are assessed using a multi-criteria decision-making framework. Results of this study can increase the knowledge and understanding to make an explicit consideration of the transition from high carbon intensive energy system to one which is substantially decarbonized. The most significant energy-sav- ings are improvement of energy efficiency and process integration. These policy options also have the large potential to reduce CO2 emissions. Keywords: CO2 Emissions, Energy Modeling, Industrial Sector, Multi-Criteria Decision-Making 1. Introduction Climate change and energy issues are demanding new efforts to addressing the challenges. Significant changes have taken place on the world energy scene, which have important implications for energy planning. Globally, the industrial sector accounts for 40% of primary energy demand and approximately the same share for CO2 emis- sions. Mitigation can be substantially cut in this sector through policies, initiatives and efficient energy tech- nologies. Thailand’s industrial sector consists of manu- facturing, mining and construction industries. The manu- facturing industry accounts for more than 90% of total energy consumption in the industrial sector. Besides, the manufacturing industry contributes about 95% of CO2 emissions from industrial sector, while construction and mining industries contribute the rest [1]. Therefore, pre- paring appropriate actions can significantly reduce en- ergy demand and associated CO2 emissions. There ar e few studies of energy scenario s in Thailand, particularly in the industrial secto r, make an explicit con- sideration of the transition from high carbon intensive energy system to one which is substantially decarbonizes. This paper is motivated by the need to help decision- makers to prepare scientific-based policy, and to analyze industrial energy demand and associated emissions in a sustainable way. The paper would provide an in-depth understanding of the complex dynamics of energy and CO2 issues related to structure of industrial energy use patterns. In addition, it can produce a scientific knowl- edge to aid decision-makers in preparing with pathway towards low-car bon economy. Planning for a low-carbon society requires processes of analysis and decision- making about what resources and technologies to be used and pathways to achieve. This paper aims to develop energy and carbon model- ing of Thai industrial sector and some policy options. It outlines and assesses the current status and future devel- opment related to energy consumption and CO2 emis- sions over the twenty-five years from 2005-2030. The simulation model, the Long-range Energy Alternative Planning (LEAP) system, is used to simulate what might happen to energy demand and carbon emissions in the future in a business-as-usual (BAU) case and with alter- nate scenario. The BAU scenario provides a baseline vision of how energy consumption and CO2 emissions are likely to evolve, while alternate scenario explores a range of policy interventions. The study goes further in applying a decision support tool to evaluate different 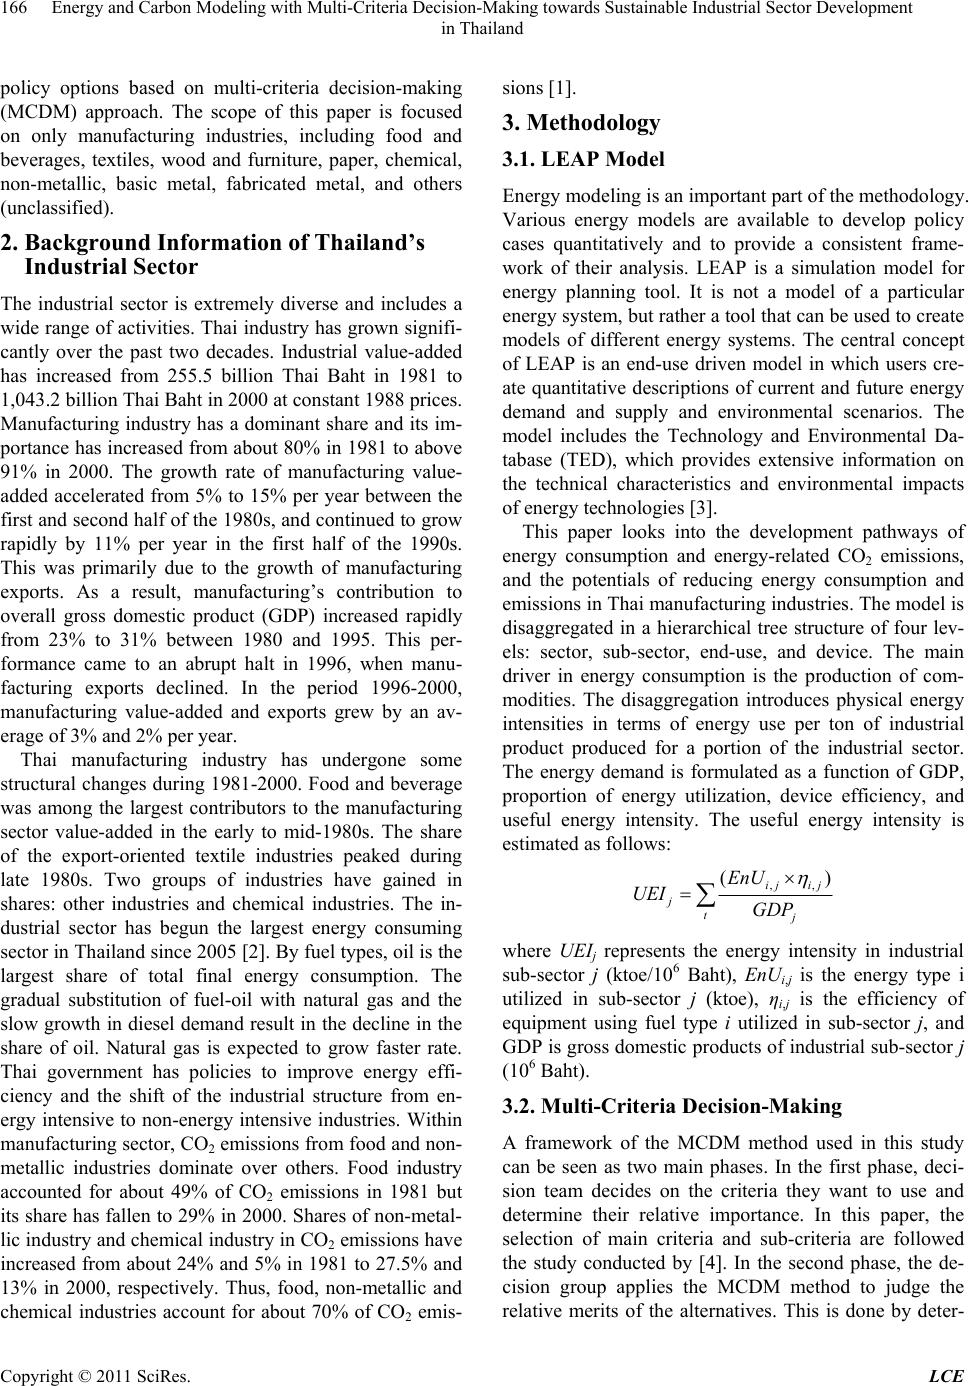 Energy and Carbon Modeling with Multi-Criteria Decision-Making towards Sustainable Industrial Sector Development 166 in Thailand policy options based on multi-criteria decision-making (MCDM) approach. The scope of this paper is focused on only manufacturing industries, including food and beverages, textiles, wood and furniture, paper, chemical, non-metallic, basic metal, fabricated metal, and others (unclassified). 2. Background Information of Thailand’s Industrial Sector The industrial sector is extremely diverse and includes a wide range of activities. Thai industry has grown signifi- cantly over the past two decades. Industrial value-added has increased from 255.5 billion Thai Baht in 1981 to 1,043.2 billio n Thai Baht in 20 00 at co n stan t 198 8 prices. Manufacturing industry has a dominant share and its im- portance has increased from about 80% in 1981 to above 91% in 2000. The growth rate of manufacturing value- added accelerated from 5% to 15% per year between the first and second half of the 1980s, and continued to grow rapidly by 11% per year in the first half of the 1990s. This was primarily due to the growth of manufacturing exports. As a result, manufacturing’s contribution to overall gross domestic product (GDP) increased rapidly from 23% to 31% between 1980 and 1995. This per- formance came to an abrupt halt in 1996, when manu- facturing exports declined. In the period 1996-2000, manufacturing value-added and exports grew by an av- erage of 3% and 2% per year. Thai manufacturing industry has undergone some structural changes during 1981-2000. Food and beverage was among the largest contributors to the manufacturing sector value-added in the early to mid-1980s. The share of the export-oriented textile industries peaked during late 1980s. Two groups of industries have gained in shares: other industries and chemical industries. The in- dustrial sector has begun the largest energy consuming sector in Thailand since 2005 [2]. By fuel types, oil is the largest share of total final energy consumption. The gradual substitution of fuel-oil with natural gas and the slow growth in diesel demand result in the decline in the share of oil. Natural gas is expected to grow faster rate. Thai government has policies to improve energy effi- ciency and the shift of the industrial structure from en- ergy intensive to non-energy intensive industries. Within manufacturing sector, CO2 emissions from food and non- metallic industries dominate over others. Food industry accounted for about 49% of CO2 emissions in 1981 but its share has fallen to 29% in 2000. Shares of non-metal- lic industry and chemical industry in CO2 emissions have increased from about 24% and 5% in 1981 to 27.5% and 13% in 2000, respectively. Thus, food, non-metallic and chemical industries account for about 70% of CO2 emis- sions [1]. 3. Methodology 3.1. LEAP Model Energy modeling is an important part of the methodology. Various energy models are available to develop policy cases quantitatively and to provide a consistent frame- work of their analysis. LEAP is a simulation model for energy planning tool. It is not a model of a particular energy system, but rather a tool that can be used to create models of different energy systems. The central concept of LEAP is an end-use driven model in which users cre- ate quantitative descriptions of current and future energy demand and supply and environmental scenarios. The model includes the Technology and Environmental Da- tabase (TED), which provides extensive information on the technical characteristics and environmental impacts of energy technologies [3]. This paper looks into the development pathways of energy consumption and energy-related CO2 emissions, and the potentials of reducing energy consumption and emissions in Thai manufacturing industries. The model is disaggregated in a hierarchical tree structure of four lev- els: sector, sub-sector, end-use, and device. The main driver in energy consumption is the production of com- modities. The disaggregation introduces physical energy intensities in terms of energy use per ton of industrial product produced for a portion of the industrial sector. The energy demand is formulated as a function of GDP, proportion of energy utilization, device efficiency, and useful energy intensity. The useful energy intensity is estimated as follows: ,, () ij ij j tj EnU UEI GDP where UEIj represents the energy intensity in industrial sub-sector j (ktoe/106 Baht), EnUi,j is the energy type i utilized in sub-sector j (ktoe), ηi,j is the efficiency of equipment using fuel type i utilized in sub-sector j, and GDP is gross domestic products of industrial sub-sector j (106 Baht). 3.2. Multi-Criteria Decision-Making A framework of the MCDM method used in this study can be seen as two main phases. In the first phase, deci- sion team decides on the criteria they want to use and determine their relative importance. In this paper, the selection of main criteria and sub-criteria are followed the study conducted by [4]. In the second phase, the de- cision group applies the MCDM method to judge the relative merits of the alternatives. This is done by deter- Copyright © 2011 SciRes. LCE  Energy and Carbon Modeling with Multi-Criteria Decision-Making towards Sustainable Industrial Sector Development in Thailand Copyright © 2011 SciRes. LCE 167 mining scores for each alternative for each criterion us- ing the measuring scales defined in the first phase. The application of MCDM was carried out in a labo- ratory setting. Five people with a background in energy, engineering, economic, environment, and political were contacted and communicated. They were asked to imag- ine themselves to be the decision-makers in charge of making decisions. One of the authors was assigned as the resident MCDM expert, that responsible for organizing the information and following other processes. Thus, other members do not need to become familiar with the mechanics of aggregating the information and running MCDM calculation. The objective of the study is to propose sustainable energy system. The criteria for energy system assessment reflect three main aspects, including environmental, economic and social. Some criteria and sub-criteria are quantifiable, while others are qualitative. The perform- ance prediction is done based on computer simulation (energy modeling), databases, rules of thumb, and ex- perience or expert judgment. Qualitative values are words or phrases that can be used to characterize how well a scheme rates against a particular criteria. These are quality issues, such as public acceptance or integra- tion into an urban context. The criteria weights are de- termined using a mathematical technique so-called Ana- lytic Hierarchy Process (AHP). AHP enables to st ructure a complex problem in the form of hierarchy and to evalu- ate a large number of quantitative and qualitative factors in a systematic manner under multiple conflicting criteria. AHP makes use of pairwise comparisons with 9-point ratio scaling to apply weights to attributes. Computer software Web-HIPRE (Hierarchical PREference analysis on the World Wide Web) is used in this process. For more detail of Web-HIPRE see [5,6] and the AHP see [7-9]. 4. Scenario Definition 4.1. Scenario Description Energy model allows the construction of policy options in a quantitative way. The imp lication o f policy interven - tions can be tested. In order to demonstrate the future energy consumption and CO2 emissions, and to evaluate the benefits of energy policies, two scenarios were de- veloped in LEAP model under different sets of policy options–a reference scenario or BAU case and an alter- nate policy scenario. These scenarios are primarily gov- erned by four factors: economic growth, proportion of energy types, efficiency of energy devices, and energy intensity. The policy options and assumptions are given in Table 1. Scenario provides a framework for exploring future energy perspectives, including various combinations of Table 1. Policy options and assumptions for scenario generation. Scenario Policy options Assumptions Business as usual Historical trends will continue and the GDP growth rate 4.5% (2005- 2010) and 5.5% (2011-2030). Alternate policy Improvement of industrial energy efficiency (IEE) A target of 10% and 20% increasing energy efficiency by 2015 and 2030. These improvements are from compressed air, boiler and steam systems, and lighting systems. Switching to natural gas (ING) Thermal energy supplied by non-renewable resources such as diesel and fuel-oil will be switched to natural gas by 2015. Combined heat and power in design ate factories (ICHP)Combined heat and power (CHP) systems will use to produce electricity in selected industries and the waste heat will use to replace heat from fuel-oil fired boilers. CHP systems will replace fuel-oil by 2015 and assume that electricity consumption will decrease 10% in each industry. Efficient electricity end-use devices (IElect) Only electricity will be considered—availability of efficient and less energy intensive pumps, compressors and motors for industrial proc- esses. This policy can consider as a part of Energy Labeling Program. It is assumed that increasing 20% of electricity efficiency by 2010. Process integration (IPI) Process integration will apply to food and beverages, chemical and pa- per industries. It is assumed that 20% reduction in useful energy inten- sity by 2015. Integrated policy (IIP) All of the above mentioned policies are considered together. This policy option would give the cumulative effect of the different options, giving Thai industry the lowest possible emission reductions.  Energy and Carbon Modeling with Multi-Criteria Decision-Making towards Sustainable Industrial Sector Development 168 in Thailand technology options and their implications. The scenario analysis timespan covers the years 2005-2030. All sce- narios start from a common base year (2005), which is named as the current account (CA) scenario in LEAP model. CA scenario describes energy demand in indus- trial sector based on proven historical data. Data for the CA scenario were collected from different sources as described in the following section. The CA scenario forms the base of BAU and alternate policy scenarios. BAU scenario assumes that past trends continue in the future and no new policies for energy-savings and emis- sion mitigation will be implemented. Energy demand is predicted as a function of time. This scenario aims to show the future through the prism of current policies and strategies. For the BAU scenario, the current patterns in the industrial structure will be maintained and the indus- trial sub-sectors will be the same as in CA scenario. This implies n o change compa red to the industr ial structure in 2005. The alternate policy scenario is inherited from BAU scenario. It is, thus, reflected sensitivities on the original scenario. This considers the cumulative impact of five industrial energy policies, including improvement of in- dustrial energy efficiency, switching to natural gas, CHP in designate factories, efficient electricity end-use de- vices, and process integration. This scenario can also consider as a mitigation scenario, which means that more ambitious energy conservation and emission reduction objectives and relevant policies are adopted. The policy options form the basis for technology selection. LEAP converts the assumptions (Table 1) into quantitative way. 4.2. Data Sources This study draws on a wide variety of sources. Data were obtained from various sources: statistical information, government publications of official energy data, utility statistics, journal articles, book chapters, research reports, and others. The principle sources are Ministry of Energy [2,10] and Ministry of Industry [11-12]. Sources of data used on economic [13-14], energy [2,10,15-17], and technology issue [18-21]. Data obtained from the original source were processed to meet the input requirements in LEAP model to develop a base year dataset. Growth in GDP was assumed to be the same in all scenarios. We assumed Thailand’s GDP from industrial sector will maintain its growth with an annual growth rate set to be 4.5% from 2005 to 2010. Then the growth will grow up, with an annual growth rate set to be 5.5% from 2010 to 2030. This assumption is based on the estimation by Na- tional Economic and Social Development Board. The industrial structure will remain constant during time- frame. 5. Results 5.1. Scenario Analysis Results 5.1.1 Business-as Usual Scenario The BAU scenario represents a base case without policy interventions. It is a projection of what would happen in the absence of specific energy policy and strategy. Cur- rently, industrial sector energy consumption accounts for around 36% of total national energy consumption, and the highly energy intensive industries, such as food and beverage, non-metallic and chemical, make up over 70% of total industrial energy d emand. Detail results for BAU case are shown in Table A-1. It shows that total indus- trial energy demand in 2005-2030 will in crease b y 5.5 3% annually, and in 2030, the energy demand is estimated to be about 3.5 times of that of the year 2005. Food and beverage, non-metallic and chemical indus- tries are expected to grow rapidly in BAU scenario. Es- timated renewable energy (including bagasse, biomass and wood), coal, electricity and natural gas demands in 2030 are 2 0,112 ktoe , 26,573 kto e, 19,034 k toe and 6 222 ktoe, respectively. Shares of biomass, coal, electricity and natural gas in energy demand of 2030 are estimated to be 26.5%, 35%, 25% and 8.2%, respectively. Among non-renewable energy, coal, electricity and natural gas are primarily responsible for the majority of final energy demand (Table A-1). The emissions for 2030 at BAU scenario are estimated 3.7 times for CO2 compared to the base year 2005. It should be noted that emissions from biomass are not taking into account. Non-metallic and fabricated metal are responsible for majority of the emissions in 2030. Non-metallic is responsible for emitting about 29.5%, while fabricated metal emits about 17.8% of total CO2 from industrial sector. CO2 emissions are estimated to be 68 MtCO2, 116 MtCO2 and 198 MtCO2 in 2010, 2020 and 2030, respectively. The estimations for the interme- diate years are illustrated in Figure 1. Electricity and coal products are responsible for the majority of emis- sions. 5.1.2. Alternate Scenari o The alternative policy options are compared to the BAU case in order to assess their potentials of energy demand and CO2 emission reductions. Indicators are selected to compare the results from the viewpoint of avoided en- ergy demand and avoided CO2 emissions compared to BAU case. The reduction in final energy demand in the industrial sector that occurs as a result of different policy options are shown in Table 2. It is found that energy efficiency improvement alone ould reduce energy demand by 40% from the BAU w Copyright © 2011 SciRes. LCE  Energy and Carbon Modeling with Multi-Criteria Decision-Making towards Sustainable Industrial Sector Development 169 in Thailand Figure 1. Estimated CO2 emissions from industrial energy consumption in BAU case. Table 2. Avoided energy demand compared to BAU under various policies (ktoe). 20102015 2020 20252030 Energy efficiency improvement 12933379 5904 966115,168 Switching to natural gas 239624 816 10661393 CHP in designate factories 5051321 1725 22532943 Efficient electricity end-use 10871421 1857 24273172 Process integration 25996794 8880 11,60615,168 Integrated policy 572313,539 19,182 27,01337,844 case in 2030. The reductions of energy demand in this policy case are higher compared to the other measures, such as switching to natural gas, CHP in designate facto- ries, and efficient electricity end-use devices. Process integration policy shows high possibility to reduce en- ergy demand during 2010-2015. It is, however, due to the assumption in the model the potential reduction of en- ergy demand decrease to 40% by 2030. Implementing all of the policy options is estimated to reduce energy de- mand by 22% in 2010, 43% in 2020, and 50% in 2030. Such reductions would have potentials to reduce a large amount of government revenues to be spent on imported energy. The potential CO2 emission reductions in various policies are presented in Table 3. Table 3. Reduction of CO2 emissions in various policies from BAU case (MtCO2). 2010 2015 2020 20252030 Energy efficiency improvement3.37 8.82 15.39 25.1839.51 Switching to natural gas 0.95 2.49 3.25 4.255.56 CHP in designate factories 2.11 5.52 7.22 9.4312.33 Efficient electricity end- u se 7.21 9.42 12.31 16.0921.03 Process integration 6.77 17.7 23.13 30.2339.51 Integrated policy 20.41 43.95 61.3 85.18117.94 5.2. Evaluation of Policy Options There are five main criteria for this analysis, including resource use, environmental loading, financial and eco- nomic, social, and practical. Main findings are found that resource use and environmental loading equal impor- tance on both criteria. It is also found that few differ- ences between social and practical aspects. Among sub- criteria (see Table 4). The annual fuel is considered to be the most important of the resource use criteria. The annual CO2 emissions are evaluated as the most important and the annual SO2 emissions is more importan ce than annu al NOx emissions in the environmental loading criteria. The market matur- ity is found the least important of the four aspects of the Copyright © 2011 SciRes. LCE 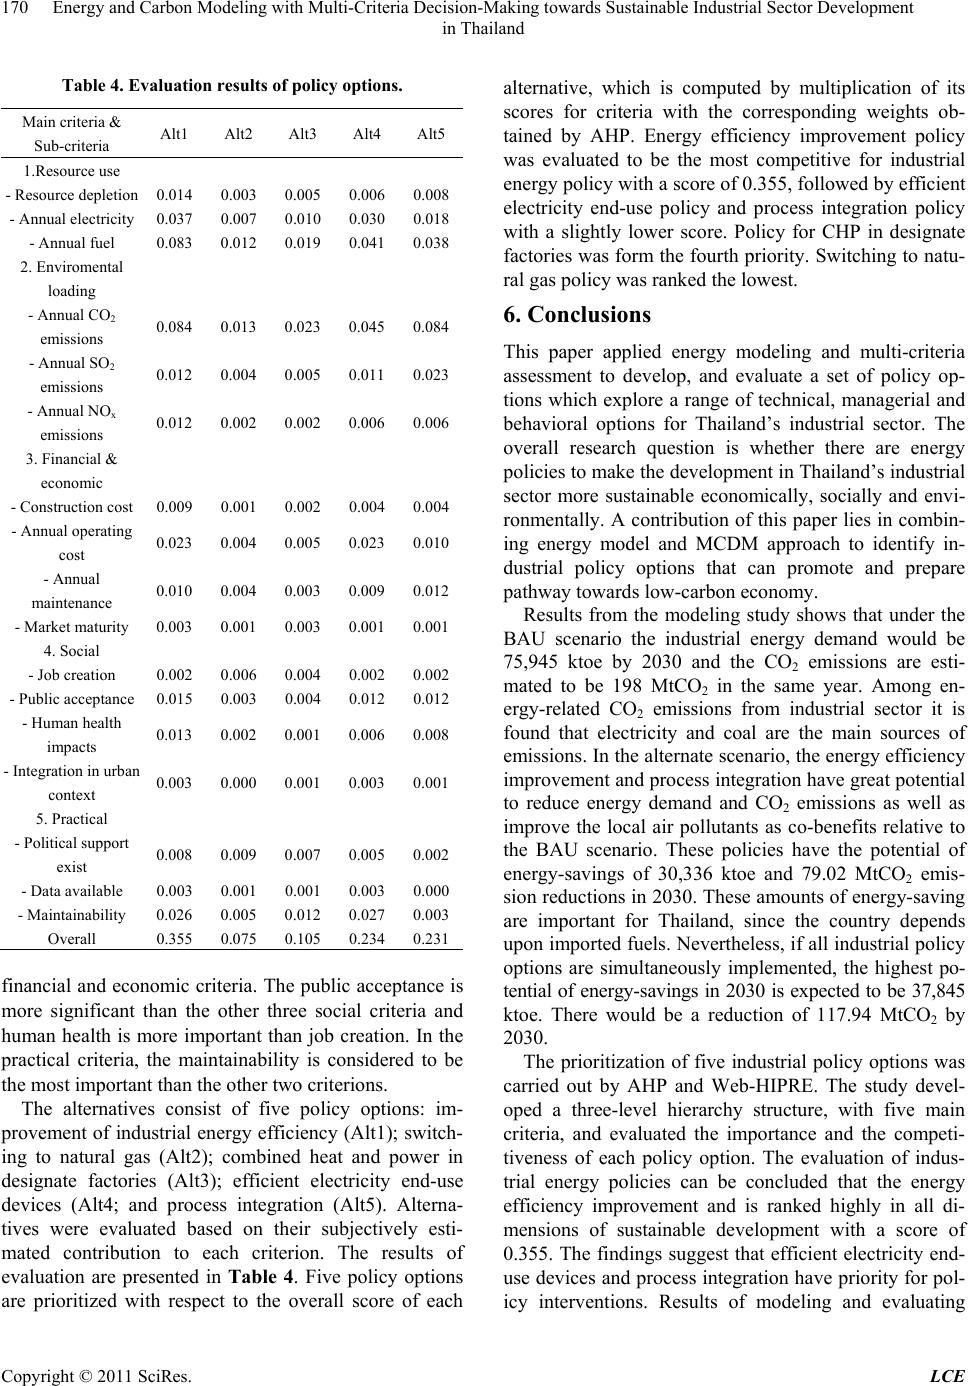 Energy and Carbon Modeling with Multi-Criteria Decision-Making towards Sustainable Industrial Sector Development 170 in Thailand Table 4. Evaluation results of policy options. Main criteria & Sub-criteria Alt1 Alt2 Alt3 Alt4 Alt5 1.Resource use - Resource depletion 0.014 0.003 0.005 0.0060.008 - Annual electricity 0.037 0.007 0.010 0.0300.018 - Annual fuel 0.083 0.012 0.019 0.0410.038 2. Enviromental loading - Annual CO2 emissions 0.084 0.013 0.023 0.0450.084 - Annual SO2 emissions 0.012 0.004 0.005 0.0110.023 - Annual NOx emissions 0.012 0.002 0.002 0.0060.006 3. Financial & economic - Construction cost 0.009 0.001 0.002 0.0040.004 - Annual operating cost 0.023 0.004 0.005 0.0230.010 - Annual maintenance 0.010 0.004 0.003 0.0090.012 - Market maturity 0.003 0.001 0.003 0.0010.001 4. Social - Job creation 0.002 0.006 0.004 0.0020.002 - Public acceptance 0.015 0.003 0.004 0.0120.012 - Human health impacts 0.013 0.002 0.001 0.0060.008 - Integration in ur an context 0.003 0.000 0.001 0.0030.001 5. Practical - Political support exist 0.008 0.009 0.007 0.0050.002 - Data available 0.003 0.001 0.001 0.0030.000 - Maintainability 0.026 0.005 0.012 0.0270.003 Overall 0.355 0.075 0.105 0.2340.231 financial and economic criteria. The public acceptance is more significant than the other three social criteria and human health is more important than job creation. In the practical criteria, the maintainability is considered to be the most important than the other two criterions. The alternatives consist of five policy options: im- provement of industrial energy efficiency (Alt1); switch- ing to natural gas (Alt2); combined heat and power in designate factories (Alt3); efficient electricity end-use devices (Alt4; and process integration (Alt5). Alterna- tives were evaluated based on their subjectively esti- mated contribution to each criterion. The results of evaluation are presented in Table 4. Five policy options are prioritized with respect to the overall score of each alternative, which is computed by multiplication of its scores for criteria with the corresponding weights ob- tained by AHP. Energy efficiency improvement policy was evaluated to be the most competitive for industrial energy policy with a score of 0.355, followed by efficient electricity end-use policy and process integration policy with a slightly lower score. Policy for CHP in designate factories was form the fourth priority. Switching to natu- ral gas policy was ranked the lowest. 6. Conclusions This paper applied energy modeling and multi-criteria assessment to develop, and evaluate a set of policy op- tions which explore a range of technical, managerial and behavioral options for Thailand’s industrial sector. The overall research question is whether there are energy policies to make the developmen t in Thailand’s industrial sector more sustainable economically, socially and envi- ronmentally. A contribution of this paper lies in combin- ing energy model and MCDM approach to identify in- dustrial policy options that can promote and prepare pathway towards low-carbon economy. Results from the modeling study shows that under the BAU scenario the industrial energy demand would be 75,945 ktoe by 2030 and the CO2 emissions are esti- mated to be 198 MtCO2 in the same year. Among en- ergy-related CO2 emissions from industrial sector it is found that electricity and coal are the main sources of emissions. In the alternate scenario, the energy efficiency improvement and process integration have great potential to reduce energy demand and CO2 emissions as well as improve the local air pollutants as co-benefits relative to the BAU scenario. These policies have the potential of energy-savings of 30,336 ktoe and 79.02 MtCO2 emis- sion reductions in 2030. These amounts of energy-saving are important for Thailand, since the country depends upon imported fuels. Nev ertheless, if all industrial policy options are simultaneously implemented, the highest po- tential of energy-savings in 2030 is expected to be 37,845 ktoe. There would be a reduction of 117.94 MtCO2 by 2030. The prioritization of five industrial policy options was carried out by AHP and Web-HIPRE. The study devel- oped a three-level hierarchy structure, with five main criteria, and evaluated the importance and the competi- tiveness of each policy option. The evaluation of indus- trial energy policies can be concluded that the energy efficiency improvement and is ranked highly in all di- mensions of sustainable development with a score of 0.355. The findings suggest that efficient electricity end- use devices and process integration have priority for pol- icy interventions. Results of modeling and evaluating Copyright © 2011 SciRes. LCE  Energy and Carbon Modeling with Multi-Criteria Decision-Making towards Sustainable Industrial Sector Development in Thailand Copyright © 2011 SciRes. LCE 171 policies provide useful, policy-relevant information, and can be used as a basis for priority policy planning in the industrial sector. 7. Acknowledgements This work was made possible by the financial support from the Science and Technology Research Institute, King Mongkut’s University of Technology North Bang- kok (KMUTNB), Th ailand. This work was also benefited from the discussions at Department of Industrial Engi- neering, Faculty of Engineering, KMUTNB. The authors also gratefully acknowledge the Stockholm Environ- mental Institute—Boston Center for supporting LEAP model, and the System Analysis Lab., Helsinki Univer- sity of Technology, Finland for the Web-HIPRE, web- based decisio n ana l y sis software. REFERENCES [1] S. C. Bhattacharyya and A. Ussanarassamee, “Decompo- sition of Energy and CO2 Intensities of Thai Industry be- tween 1981 and 2000,” Energy Economics, Vol. 26, No. 5, 2004, pp. 765-781. doi:10.1016/j.eneco.2004.04.035 [2] Department of Alternative Energy and Efficiency (DEDE), “Thailand Energy Situation 2005,” Ministry of Energy, Bangkok, 2005. [3] Stockholm Environment Institute (SEI), “LEAP, Long- Range Energy Alternative Planning System.” http://forum.seib.org/leap [4] A. Phdungsilp, “Integrated Energy and Carbon Modeling with a Decision Support System: Policy Scenarios for Low-Carbon City Development in Bangkok,” Energy Policy, Vol. 38, No. 9, 2010, pp. 4808-4817. doi:10.1016/j.enpol.2009.10.026 [5] R. P. Hämäläinen and H. Lauri, “HIPRE 3+ User’s Guide,” System Analysis Laboratory, Helsinki University of Tech- nology. http://www.sal.hut.fi/Downloadables/ hpdemo.html [6] R. L. Keeney and H. Raiffa, “Decisions with Multiple Objectives: Preference and Value Tradeoffs,” John Wiley & Sons Inc, New York, 1976. [7] T. L. Saaty, “The Analytic Hierarchy Process,” McGraw-Hi l l Inc, New York, 1980. [8] T. L. Saaty, “Highlights and Critical Points in the Theory and Application of the Analytic Hierarchy Process,” European Journal of Operational Research, Vol. 74, No. 3, 1994, pp. 426-447. doi:10.1016/0377-2217(94)90222-4 [9] A. Salo and R. P. Hämäläinen, “On the Measurement of Preferences in the Analytic Hierarchy Process,” Journal of Multi-Criteria Decision Analysis, Vol. 6, 1997, pp. 309-343. doi:10.1002/(SICI)1099-1360(199711)6:6<309::AID-MC DA163>3.0.CO;2-2 [10] Department of Alternative Energy Development and Effi- ciency (DEDE), “Energy Potentials,” Ministry of Energy, Bangkok, 2006. [11] Department of Industrial Works (DIW), “Thailand Fac- tory Databases,” 2008. http://www.diw.go.th/diw [12] Department of Industries and Mines (DPIM), “Thailand Mine Databases,” 2008. http://www.dpim.go.th [13] National Economic and Social Development Board (NESDB), “National Income of Thailand, 1980-2001 ed.,” Bangkok, 2003. [14] National Institute of Development Admini stration (NIDA), “Thailand Long-Term Load Forecasts,” Bangkok, 2006. http://www.eppo.go.th/load/nida/eng/contents. html [15] S. Tanatvanit, B. Limmeechokchai and S. Chungpaibul- patana, “Sustainable Energy Development Strategies: Im- plications of Energy Demand Management and Renew- able Energy in Thailand,” Renewable and Sustainable Energy Reviews, Vol. 7, No. 5, 2003, pp. 367-395. doi:10.1016/S1364-0321(03)00066-2 [16] B. Sajjakulnukit and P. Verapong, “Sustainable Biomass Production for Energy in Thailand,” Biomass and Bio- energy, Vol. 25, No. 5, 2003, pp. 557-570. doi:10.1016/S0961-9534(03)00091-6 [17] R. M. Shrestha, S. Malla and M. H. Liy anage, “Scenario- Based Analyses of Energy System Development and its environmental Implications in Thailand,” Energy Policy, Vol. 35, No. 6, 2007, pp. 3179-3193. doi:10.1016/j.enpol.2006.11.007 [18] M. Kainuma, Y. Matsuoka and T. Morita, “Climate Pol- icy Assessment: Asia-Pacific Integrated Modeling,” Sprin- ger, Tokyo, 2003. [19] J. Santisirisomboon, “Modeling of Energy and Environ- mental Systems in Thailand for Energy Conservation and Emission Mitigation,” Ph.D. Thesis, Thammasat Univer- sity, Bangkok, 2001. [20] R. M. Shrestha, P. Khummongkol, W. K. Biswas, G. R. Timilsina and S. Sinbanchongjit, “CO2 Mitigation Poten- tial of Efficient Demand-Side Technologies: The Case of Thailand,” Energy Sources, Vol. 20, No. 4-5, 1998, pp. 301-316. doi:10.1080/00908319808970063 [21] National Energy Policy Office (NEPO), “Energy Effi- ciency Standards Regime Study,” Environmental Re- source Management (ERM), Bangkok, 1999. 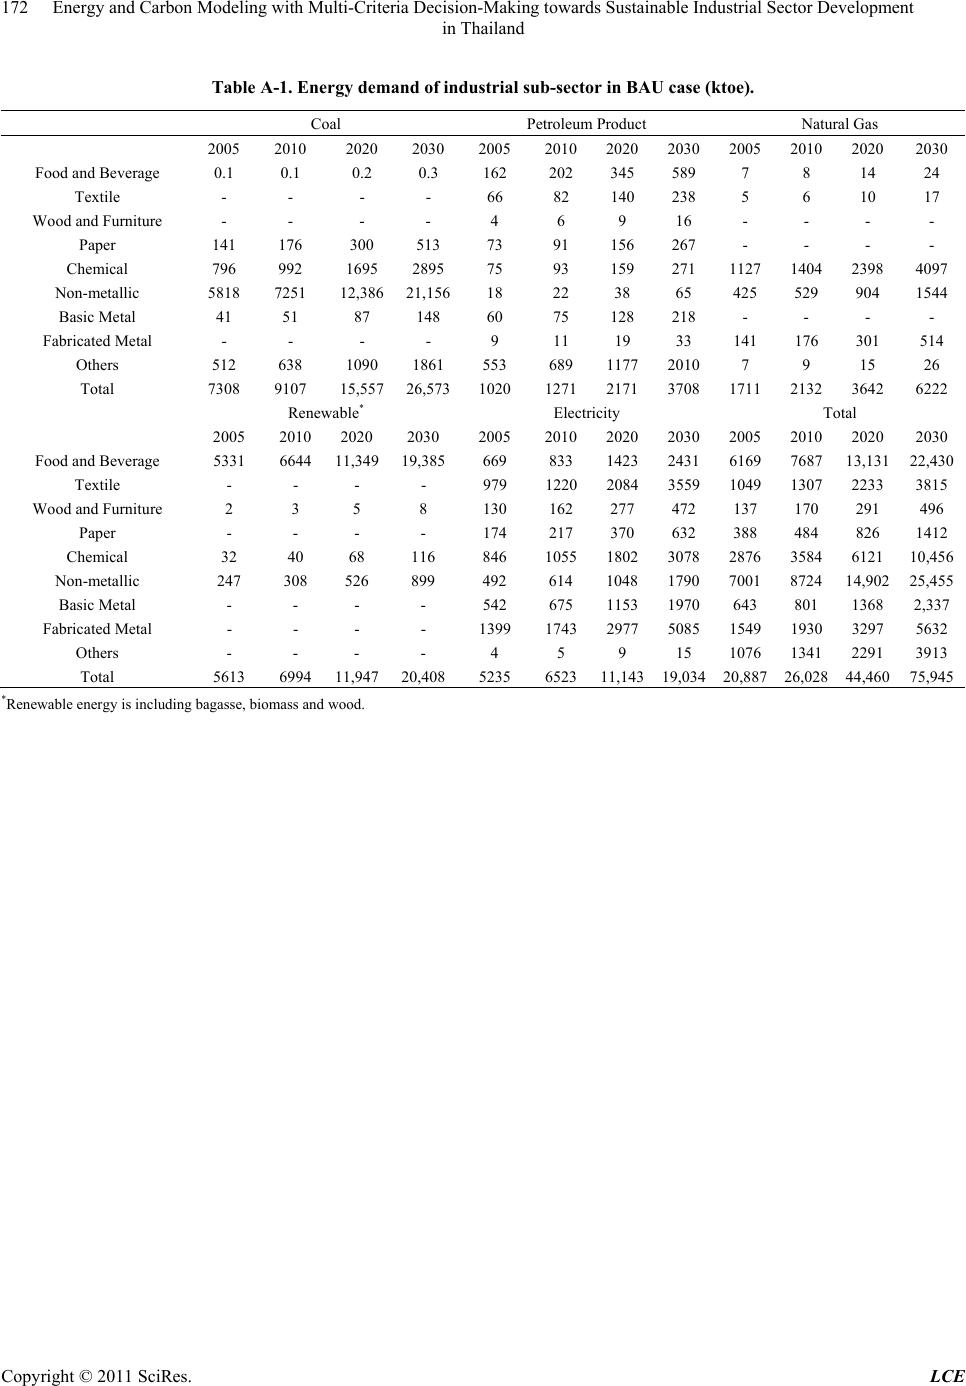 Energy and Carbon Modeling with Multi-Criteria Decision-Making towards Sustainable Industrial Sector Development 172 in Thailand Table A-1. Energy demand of industrial sub-sec tor in BAU case (ktoe). Coal Petroleum Product Natural Gas 20052010 2020 20302005 2010202020302005 2010 20202030 Food and Beverage 0.1 0.1 0.2 0.3 162 202 345 589 7 8 14 24 Textile - - - - 66 82 140 238 5 6 10 17 Wood and Furniture - - - - 4 6 9 16 - - - - Paper 141 176 300 513 73 91 156 267 - - - - Chemical 796 992 1695 289575 93 159 271 1127 1404 23984097 Non-metallic 58187251 12,38621,15618 22 38 65 425 529 904 1544 Basic Metal 41 51 87 148 60 75 128 218 - - - - Fabricated Metal - - - - 9 11 19 33 141 176 301 514 Others 512 638 1090 1861 553 689 117720107 9 15 26 Total 73089107 15,55726,5731020 1271217137081711 2132 36426222 Renewable* Electricity Total 2005 2010 2020 2030 2005 2010202020302005 2010 20202030 Food and Beverage 5331 6644 11,349 19,385669 833 142324316169 7687 13,13122,430 Textile - - - - 979 1220208435591049 1307 22333815 Wood and Furniture 2 3 5 8 130 162 277 472 137 170 291 496 Paper - - - - 174 217 370 632 388 484 826 1412 Chemical 32 40 68 116 846 1055180230782876 3584 612110,456 Non-metallic 247 308 526 899 492 614 104817907001 8724 14,90225,455 Basic Metal - - - - 542 675 11531970643 801 13682,337 Fabricated Metal - - - - 1399 1743297750851549 1930 32975632 Others - - - - 4 5 9 15 1076 1341 22913913 Total 5613 6994 11,947 20,4085235 652311,14319,03420,887 26,028 44,46075,945 *Renewable energy is including bagasse, biomass and wood. Copyright © 2011 SciRes. LCE
|