Journal of Environmental Protection, 2011, 2, 960-966
doi:10.4236/jep.2011.27110 Published Online September2011 (http://www.SciRP.org/journal/jep)
Copyright © 2011 SciRes. JEP
Measurement of Radioactivity of 238U, 226Ra, 232Th
and 40K in Soil of Different Geological Origins in
Northern India
Rohit Mehra1*, Manmohan Singh2
1Department of Physics, Dr BR Ambedkar National Institute of Technology, Jalandhar, Punjab, India; 2Department of Physics,
Kanya Maha Vidyalaya, Jalandhar, Punjab, India.
Email: *rohit_mimit@rediffmail.com
Received March 21st, 2011; revised July 19, 2011; accepted August 23rd, 2011.
ABSTRACT
Radioactivity of the nuclides 238U, 226Ra, 232Th and 40K was measured in soil by γ-ray spectrometry using HPGe detector.
A criterion was set in order to analyse soil samples from plain, semi-hilly and hilly areas in northern India. More than
three γ-ray energy peaks were used for the determination of 226Ra and 232Th activity concentrations to obtain more ac-
curate results. Some of these peaks have interfering energies, which was caused by the limited resolution of the detector,
but they were resolved theoretically and used in the analysis because of their significance in reducing the random error
to its minimum level. Relationships between the measured radionuclides have been discussed elaborately. Radionu-
clides 238U and 226Ra were found in disequilibrium with ratio of specific activities (238U/226Ra) less than unity for most of
the samples. In some cases this disequilibrium may be significant enough to modify the γ-ray dose factors.
Keywords: Soil, Natural Radionuclides, Disequilibrium, Dose
1. Introduction
There is a great interest all over the world in the study of
terrestrial radioactivity to carry out the radiological
characterisation of soils and building materials. This kind
of study is important not only for the assessment of pub-
lic dose rates and health risks but also to keep refer-
ence-data record to document the possible changes in the
environmental radioactivity induced by humans in future
as far as the nuclear activities are concerned [1].
Natural environmental radioactivity depends on the
geological and geographic conditions, and appears at
different levels in the soils of each different geological
region [2]. It comes mainly from uranium (238U) series,
thorium (232Th) series and natural potassium (40K). Ab-
normal occurrences of uranium and its decay products in
rocks and soils, and thorium in monazite sands have been
identified in several areas of the world, e.g., Yangjiang in
China, Rasmar in Iran, Kerala coast of India, etc. [3-5].
This study deals with the measurement of specific ac-
tivities of the naturally occurring radionuclides (238U,
232Th, and 40K) in soil and consequently the assessment
of γ-radiation dose. Soil samples were collected and their
γ-radiation measured in our laboratory by γ-ray spec-
trometry using HPGe detector. The samples were col-
lected from four sites (Bathinda, Amritsar, Pathankot and
Dalhousie). These sites cover different geographical fea-
tures, especially sandy soil at Bathinda and rocks at Dal-
housie, making them interesting sites for radiological
studies. Each site is different geologically and as well as
climatically from the other. Amritsar and Bathinda fall in
plain area of Punjab state of India. Pathankot is
semi-hilly area at the border of Punjab and Himachal
Pradesh states. Dalhousie is situated in the mountains of
Chamba district of Himachal Pradesh. Although Amritsar
and Bathinda both are plain areas, the nature of soil at
these places is quite different from each other. Soil at
Amritsar mainly consists of silty clay of low to medium
plasticity. Texture of the soil at Bathinda is sandy to silty.
Majority of the soil at Pathankot is a mixture of pebbles
and sandy loam. Soil at Dalhousie is formed of hard and
compact sedimentary rock (silty sandstone). Rainfall is
frequent in Dalhousie all over the year, while the climate
is drier in Amritsar and Bathinda.
2. Sample Collection and Measuring
Methods
Soil samples were collected from 24 points at selected
Measurement of Radioactivity of 238U, 226Ra, 232Th and 40K in Soil of Different Geological Origins in Northern India961
four sites with 6 samples from each site. Each sample
was taken from a depth of 5 cm - 10 cm at a randomly
chosen point within the site area. The only constraint was
that no sample was taken close to a field boundary, tree,
building, or other obstruction. However, sampling points
at each site were selected at a minimum distance of 2 km
from each other in order to cover a large area and to ob-
serve a significant local spatial variation in terrestrial
radioactivity. In order to obtain representative samples,
they were thoroughly mixed, sieved to remove stones,
pebbles grass roots and straws and then crushed to pass
through a 200 micron mesh sieve to homogenise the
contents. Then they were air-dried for several days and
finally, were packed in plastic cylindrical containers,
which were well sealed with celluloid tape. The volume
of the soil sample in the container was kept constant on
245 cm3. The samples filled in the containers were left
for at least 4 weeks before measuring by γ-spectrometry
in order to ensure that radioactive equilibrium was
reached between 226Ra, 222Rn, and hence 222Rn progeny.
The volume of the soil samples was equal to that of the
standard sample to maintain the geometrical identity.
Therefore, due to the varying density of soils, the sample
weight was also varying.
Soil samples were analysed for the activity of natural
radionuclides using a High Purity Germanium (HPGe)
coaxial n-type detector at Inter University Accelerator
Center(IUAC), New Delhi. The detector had a resolution
of 2.0 KeV at 1332 KeV and relative efficiency of 20%
relative to a 3” × 3” NaI(Tl) detector. Spectrum was ana-
lysed using the software “CANDLE” (Collection and Ana-
lysis of Nuclear Data using Linux Network)”developed
locally at Inter University Accelerator Center. The de-
tector was shielded using 4” lead on all sides to reduce
the background level of the system. Each sample was
measured for a time period of 72,000 seconds. Activity
concentration of each radionuclide was computed ac-
cording to the following formula:
PA100 100
Activity I 72000ε

 (1)
where PA is peak area for a given energy, I is γ-ray in-
tensity in percentage and
is efficiency in percentage of
the detector for that energy.
It is well known that 238U and 226Ra may not be in
secular equilibrium, therefore, an independent (from
226Ra) method was used to measure 238U.
2.1. Estimation of 238U Concentration
Direct determination of 238U using semiconductor γ-ray
spectrometer is very hard because 238U does not have
intensive γ-rays (lines) of its own. But it has several
daughter products which have more intensive lines and
activities equal to those of their parents in the state of
secular equilibrium. The most intensive energies, used to
determine 238U contents, either come from 226Ra and its
progeny or from 234Th [6]. However, 226Ra is generally
not in equilibrium with 238U because of geochemical
reasons, therefore, the idea of using the energies of 226Ra
progeny was discarded. 234Th is surely in equilibrium
with 238U and many authors use the 63.3 keV (3.6%) and
92.6 keV (4.9%) lines of 234Th to determine 238U. How-
ever, the interference of the 92.6 keV line from X-rays of
Bi, Po, U and Th, and the interference of the 63.3 keV
line from a 63.7 keV line of the thorium series may cause
uncertainty in the results [7]. Moreover, the self absorp-
tion of these low-energy γ-rays in the sample material is
significant and depends strongly on the varying composi-
tion and density of the sample. These facts may lead to
the increase of the random error [8].
In the present study, 238U was determined through the
determination of 235U assuming 235U/238U isotopic ratio to
be constant for soils and rocks at 7.2 × 10⁻³. 235U is de-
termined using its own intensive line at 185.7 keV (57.5
%). Intensity of this peak relative to 238U is about 2.6%
that gives a little bit lower peak intensity and higher sta-
tistical uncertainty than that of the 63.3 keV peak of
234Th. However, the 185.7 keV peak suffers from inter-
ference only from 226Ra, and the uncertainty caused by
self-absorption is less because the higher γ-ray energy.
The photo peak at the 185.7 keV line is interfered by the
186.1 keV line of 226Ra, which makes it necessary to re-
solve by using some mathematical relations. In the pre-
sent analysis, the peak area under the 186 keV peak, was
treated as sum:
235 226
PA(186)PA(U, 185.7)PA(Ra, 186.1) (2)
To deduce 226Ra contribution, it was assumed to be in
equilibrium with its progeny. The intense γ-rays of 214Pb
and 214Bi were used subsequently to determine 226Ra ac-
tivity. For example, 295.2 keV γ-ray of 214Pb were cho-
sen for this purpose to yield:
226
226
214
214
PA(Ra, 186.1)
(186.1) I(Ra,186.1)PA(Pb, 295.2)
(295.2)I(Pb, 295.2)

(3)
where I(AX, Eγ) and
(Eγ) are the emission probability
and detection efficiency, respectively, for the Eγ (keV)
γ-ray of radionuclide AX. Similarly, PA(226Ra, 186.1) was
computed also using the 351.9, 609.3 and 1120.3 keV
lines and the average value for PA(226Ra, 186.1) was
computed and subtracted from the measured PA(186) to
yield the value of PA(235U, 185.7) according to Equation
(2). Activity of 235U was, then, calculated using Equation
(1). Finally, 238U was computed from the following equa-
Copyright © 2011 SciRes. JEP
Measurement of Radioactivity of 238U, 226Ra, 232Th and 40K in Soil of Different Geological Origins in Northern India
962
tion:
238
235235 235
1/2
238 238
1/2
U(Bq/kg)
T( U)M( U)U(Bq/kg)
F
T( U)M( U)

(4)
where T1/2(AX) is the half-life and M(AX) is atomic mass
of radionuclide AX. Factor F is 235U/238U isotopic, which
is assumed to be constant for soil and rocks at 7.2 × 10⁻³
[7].
3. Results and Discussion
3.1. Specific Activities of 238U, 226Ra, 232Th and
40K
Table 1 illustrates the specific activities of the natural
radionuclides (238U, 226Ra, 232Th, and 40K) in the samples
collected from four sites. Activity of 238U, collectively
for all the 24 soil samples, found to be ranged from 22.63
to 116.23 Bq/kg with an average value of 50.5 Bq/kg.
Activity of 226Ra varied from 19.47 to 96.08 Bq/kg with
an average value of 54.13 Bq/kg. The 232Th activity
ranged from 30.2 to 136.12 Bq/kg with an average value
of 83.04 Bq/kg. While the activity of 40K ranged from
189.47 to 508.05 Bq/kg with an average of 337.53 Bq/kg.
Dalhousie location 3 has the highest values of 238U, 226Ra
and 232Th, while Pathankot location 1 has the highest
value of 40K. Average activity concentrations of 238U,
226Ra and 232Th are significantly higher, and activity
concentration of 40K is lower as compared to the world-
wide average concentrations in soils of various countries,
which are 33 Bq/kg for 238U, 32 Bq/kg for 226Ra, 45
Bq/kg for 232Th and 420 Bq/kg for 40K [2]. Each out of
24 soil samples follows the activity order as 226Ra < 232Th
< 40K. For a detailed study, 238U/226Ra, 232Th/226Ra,
40K/226Ra and 40K/232Th ratios are given in Table 2. It is
generally expected that 238U and 226Ra being in the same
series, are in equilibrium, however, diversity of their ra-
tio from unity was found in the present measurements as
explained separately in section 4.2. 232Th/226Ra varied in
the range of 1.25 and 1.85 with an average value of 1.55.
40K/226Ra ranged from 3.4 to 10.15 with an average value
of 6.61. 40K/232Th ranged from 2.72 to 6.54 with an av-
erage value of 4.27. This ratio can be used as an indicator
of the relative occurrence of these radionuclides. Study-
ing each site individually, it can be seen from Table 1
that the average activity values of Bathinda samples are
highest for 238U, 232Th and 40K, while 226Ra is highest for
Dalhousie samples. The lowest average activity values of
238U, 226Ra and 232Th are for Pathankot samples. Average
activity of 40K is lowest for Amritsar samples. However,
the contents of 238U and 232Th at Bathinda have insignifi-
cant difference from the corresponding contents at Dal-
housie. Similarly, activity of 226Ra at Bathinda is ap-
proximately equal to that at Amritsar.
3.2. Study of 238U/226Ra Activity Concentration
Ratio
Table 2 shows that 15 out of 24 samples have 238U/226Ra
activity ratio less than unity. This ratio ranged from 0.56
to 1.56 having an average value of 0.95. The average
value of 238U/226Ra in UNSCEAR, 2000 report is about
1.03. However, after a detailed study of this report, it is
found that most of the values of 238U presented in the
report are based on assuming 238U and 226Ra in equilib-
rium. Compiling only those 238U values, which were
measured independently by some means, it has been ob-
served that 9 out of 17 countries have experienced
238U/226Ra activity ratio less than unity as can be seen in
Table 3.
Navas et al. [9] have reported 238U/226Ra ratio as low
as 0.55 in the upper layer of soils (0 cm - 20 cm). They
explained it by the significant differences in mobility of
these radionuclides. According to them, 238U may be in-
tensively leached from the soil surface and transferred to
deeper soil sections where it accumulates. In comparison
226Ra is very immobile and keeps constant. This distur-
bance from equilibrium might be attributed to the weath-
ering of rocks and the activity of water on the soil [6]. It
is found that there is a positive correlation between
238U/226Ra ratio and water content in the soil [10]. Present
study of 238U/226Ra provides further evidences for this
fact as Dalhousie is known for frequent rain falling all
over the year and average 238U/226Ra at this site is lowest
to the value of 0.83. On the other side, Amritsar and
Bathinda have drier climate and exhibit higher 238U/226Ra
ratio. More surprisingly Bathinda shows 238U/226Ra ratio
more than unity. This may be attributed to the spread of
fly ash enriched in uranium contents, which is originated
from the combustion of coal from a thermal plant run-
ning in this area for more than 50 years.
3.3. Dose Distribution of γ-Radiations
Distribution of 226Ra, 232Th and 40K in soil is not uniform.
Therefore, in order to compare their combined radio-
logical effect, a common index called the radium
equivalent activity (Raeq) was used. The radium equiva-
lent activity is a weighted sum of activities of the above
three radionuclides based on the assumption that 370
Bq/Kg of 226Ra, 259 Bq/Kg of 232Th and 4810 Bq/Kg of
40K produces the same gamma dose rate. It is calculated
through the following relation [11]:
Ra Th K
eq
CCC
Ra370 370 259 4810




(5)
or
Copyright © 2011 SciRes. JEP
Measurement of Radioactivity of 238U, 226Ra, 232Th and 40K in Soil of Different Geological Origins in Northern India
Copyright © 2011 SciRes. JEP
963
eq RaThK
RaC 1.43C0.077 (6)
where CRa, CTh and CK are the activity concentrations (in
Bq/kg) for 226Ra, 232Th and 40K, respectively. It can be
seen from Table 1 that the radium equivalent for all the
24 soil samples in the present study ranged between
77.87 Bq/kg for Pathankot location 6 and 325.71 Bq/kg
for Dalhousie location 3 at an average value of 198.86
Bq/kg, which is lower than the allowed maximum value
of 370 Bq/kg [11,12]. The contributions of 226Ra, 232Th
and 40K in the average value of Raeq are in the ratio
Table 1. Activity concentration of 238U, 226Ra, 232Th, and 40K in some Indian soils (Bathinda, Amritsar, Pathankot and Dal-
housie).
Sample
238U
(Bq/kg)
226Ra
(Bq/kg)
232Th
(Bq/kg)
40K
(Bq/kg)
Raeq
(Bq/kg)
Bathinda location 1 49.64 ± 4.13 57.16±1.08 104.08 ± 4.08489.55 ± 5.15 243.69 ± 7.31
Bathinda location 2 41.7 ± 3.92 44.12 ± 0.88 72.64 ± 3.08 252.75 ± 3.10 167.46 ± 5.52
Bathinda location 3 97.32 ± 5.20 82.28 ± 1.48 124.36 ± 5.24507.5 ± 5.53 299.19 ± 9.40
Bathinda location 4 58.57 ± 4.36 74.68 ± 1.24 121.44 ± 1.96486.45 ± 5.28 285.8 ± 4.45
Bathinda location 5 45.6 ± 4.02 41.88 ± 0.80 71.28 ± 3.64 272.28 ± 3.28 164.78 ± 6.26
Bathinda location 6 52.33 ± 4.20 33.92 ± 0.56 62.68 ± 3.52 253.73 ± 3.10 143.09 ± 5.83
Average 57.53 ± 4.30 55.67 ± 1.01 92.75 ± 3.59 377.04 ± 4.24 217.33 ± 6.46
Standard deviation 20.33 19.33 27.28 129.06 67.59
Amritsar location 1 35.26 ± 3.73 56.36 ± 1.08 90.64 ± 3.28 301.66 ± 3.50 209.20 ± 6.04
Amritsar location 2 31.40 ± 3.61 35.40 ± 0.66 49.72 ± 1.71 231.56 ± 2.88 124.33 ± 3.33
Amritsar location 3 55.47 ± 4.28 42.48 ± 0.78 65.48 ± 2.91 214.25 ± 2.73 152.61 ± 5.15
Amritsar location 4 37.81 ± 3.80 46.31 ± 0.90 57.73 ± 2.46 257.89 ± 3.11 148.72 ± 4.66
Amritsar location 5 40.27 ± 3.87 51.08 ± 0.98 74.10 ± 3.67 312.24 ± 3.60 181.09 ± 6.51
Amritsar location 6 103.46 ± 5.31 95.08 ± 1.56 132.16 ± 5.12493.18 ± 5.18 322.04 ± 9.28
Average 50.61 ± 4.10 54.45 ± 0.99 78.31 ± 3.19 301.80 ± 3.50 189.67 ± 5.83
Standard deviation 27.17 21.16 29.92 101.25 71.13
Pathankot location 1 42.36 ± 3.93 56.96 ± 1.04 100.08 ± 3.80508.05±5.32 239.19±6.88
Pathankot location 2 26.78±3.46 20.38±0.47 33.28±1.89 189.47±2.52 82.56±3.37
Pathankot location 3 23.83±3.35 34.72±0.72 61.96 ± 4.16 242.08 ± 3.00 141.96 ± 6.90
Pathankot location 4 33.42 ± 3.67 59.32 ± 1.11 101.92 ± 3.88442.5 ± 4.78 239.14 ± 7.03
Pathankot location 5 70.29 ± 4.63 64.30 ± 1.14 89.72 ± 3.29 403.39 ± 4.41 223.66 ± 6.18
Pathankot location 6 30.41 ± 3.58 19.47 ± 0.51 30.20 ± 1.77 197.6 ± 2.56 77.87 ± 3.24
Average 37.85 ± 3.77 42.53 ± 0.83 69.53 ± 3.13 330.52 ± 3.77 167.40 ± 5.60
Standard deviation 17.13 20.24 32.58 137.66 76.58
Dalhousie location 1 23.47 ± 3.34 29.26 ± 0.55 37.14 ± 1.30 223.78 ± 2.82 99.60 ± 2.63
Dalhousie location 2 74.86 ± 4.73 75.40 ± 1.80 126.72 ± 5.40485.25 ± 5.13 293.97 ± 9.92
Dalhousie location 3 116.23 ± 5.55 96.08 ± 1.68 136.12 ± 5.24454.28 ± 4.88 325.71 ± 9.55
Dalhousie location 4 22.63 ± 3.31 38.07 ± 0.71 51.56 ± 2.23 264.80 ± 3.16 132.19 ± 4.14
Dalhousie location 5 61.50 ± 4.43 87.44 ± 1.44 109.32 ± 4.12297.10 ± 3.47 266.64 ± 7.60
Dalhousie location 6 37.43 ± 3.79 57.00 ± 0.96 88.52 ± 3.59 319.48 ± 3.60 208.18 ± 6.37
Average 56.02 ± 4.19 63.88 ± 1.19 91.56 ± 3.65 340.78 ± 3.84 221.05 ± 6.70
Standard deviation 36.14 26.97 40.27 105.43 90.73
Measurement of Radioactivity of 238U, 226Ra, 232Th and 40K in Soil of Different Geological Origins in Northern India
964
Table 2. Activity concentration ratios 238U/226Ra, 232Th/226Ra, 40K/226Ra and 40K/232Th in some Indian soils (Bathinda, Amrit-
sar, Pathankot and Dalhousie).
Sample 238U/226Ra 232Th/226Ra 40K/226Ra 40K/232Th
Bathinda location 1 0.87 ± 0.091.82 ± 0.11 8.56 ± 0.25 4.70 ± 0.23
Bathinda location 2 0.95 ± 0.111.65 ± 0.10 5.73 ± 0.18 3.48 ± 0.19
Bathinda location 3 1.18 ± 0.081.51 ± 0.09 6.17 ± 0.18 4.08 ± 0.22
Bathinda location 4 0.78 ± 0.071.63 ± 0.05 6.51 ± 0.18 4.01 ± 0.11
Bathinda location 5 1.09 ± 0.121.70 ± 0.12 6.50 ± 0.20 3.82 ± 0.24
Bathinda location 6 1.54 ± 0.151.85 ± 0.13 7.48 ± 0.21 4.05 ± 0.28
Average 1.07 ± 0.101.69 ± 0.10 6.83 ± 0.20 4.02 ± 0.21
Standard deviation 0.27 0.13 1.03 0.40
Amritsar location 1 0.63 ± 0.081.61 ± 0.09 5.35 ± 0.16 3.33 ± 0.16
Amritsar location 2 0.89 ± 0.121.40 ± 0.07 6.54 ± 0.20 4.66 ± 0.22
Amritsar location 3 1.31 ± 0.121.54 ± 0.10 5.04 ± 0.16 3.27 ± 0.19
Amritsar location 4 0.82 ± 0.101.25 ± 0.08 5.57 ± 0.18 4.47 ± 0.24
Amritsar location 5 0.79 ± 0.091.45 ± 0.10 6.11 ± 0.19 4.21 ± 0.26
Amritsar location 6 1.09 ± 0.071.39 ± 0.08 5.19 ± 0.14 3.73 ± 0.18
Average 0.92 ± 0.101.44 ± 0.09 5.63 ± 0.17 3.95 ± 0.21
Standard deviation 0.24 0.13 0.58 0.59
Pathankot location 1 0.74 ± 0.081.76 ± 0.10 8.92 ± 0.26 5.08 ± 0.25
Pathankot location 2 1.31 ± 0.201.63 ± 0.13 9.30 ± 0.34 5.69 ± 0.40
Pathankot location 3 0.69 ± 0.111.78 ± 0.16 6.97 ± 0.23 3.91 ± 0.31
Pathankot location 4 0.56 ± 0.071.72 ± 0.10 7.46 ± 0.22 4.34 ± 0.21
Pathankot location 5 1.09 ± 0.091.40 ± 0.08 6.27 ± 0.18 4.50 ± 0.21
Pathankot location 6 1.56 ± 0.221.55 ± 0.13 10.15 ± 0.40 6.54 ± 0.47
Average 0.99 ± 0.131.64 ± 0.12 8.18 ± 0.27 5.01 ± 0.31
Standard deviation 0.39 0.15 1.50 0.97
Dalhousie location 1 0.80 ± 0.131.27 ± 0.07 7.65 ± 0.24 6.03 ± 0.29
Dalhousie location 2 0.99 ± 0.091.68 ± 0.11 6.44 ± 0.22 3.83 ± 0.20
Dalhousie location 3 1.21 ± 0.081.42 ± 0.08 4.73 ± 0.13 3.34 ± 0.16
Dalhousie location 4 0.59 ± 0.101.35 ± 0.08 6.96 ± 0.21 5.14 ± 0.28
Dalhousie location 5 0.70 ± 0.061.25 ± 0.07 3.40 ± 0.10 2.72 ± 0.13
Dalhousie location 6 0.66 ± 0.081.55 ± 0.09 5.60 ± 0.16 3.61 ± 0.19
Average 0.83 ± 0.091.42 ± 0.08 5.80 ± 0.18 4.11 ± 0.21
Standard deviation 0.23 0.17 1.56 1.23
Table 3. Activity concentration ratio 238U/226Ra in various countries (UNSCEAR, 2000).
Country 238U(Bq m-3)/226Ra(Bq m-3)
Algeria 30/50 (0.60)
Egypt 37/17 (2.18)
United States 35/40 (0.88)
China 33/32 (1.03)
Hong Kong 84/59 (1.42)
Japan 29/33 (0.88)
Kazakhstan 37/35 (1.06)
Malaysia 66/67 (0.99)
Thailand 114/48 (2.38)
Armenia 46/51 (0.90)
Syrian Arab Republic 23/20 (1.15)
Ireland 37/60 (0.62)
Bulgaria 40/45 (0.89)
Hungary 29/33 (0.88)
Russian Federation 19/27 (0.70)
Croatia 110/54 (2.04)
Portugal 49/44 (1.11)
Copyright © 2011 SciRes. JEP
Measurement of Radioactivity of 238U, 226Ra, 232Th and 40K in Soil of Different Geological Origins in Northern India 965
27.2:59.7:13.1. Average results of Raeq for each site are
also listed in Table 1, which is highest at Dalhousie at the
value of 221.05 Bq/kg and lowest at Pathankot at the
value of 167.4 Bq/kg.
The external terrestrial γ-radiation absorbed dose rate
in air at a height of about 1 m above the ground is calcu-
lated by using the following relation [2]:
Ra ThK
D(nGy/h) 0.462C0.604C0.0417C (7)
Results of γ-radiation absorbed dose rate are shown in
Table 4. It ranged between 35.48 nGy/h for Pathankot
location 6 and 145.55 nGy/h for Dalhousie location 3 at
an average value of 89.24 nGy/h, which is higher by a
factor of 1.49 than the world’s average value of 60 nGy/h
[2].The contributions of 226Ra, 232Th and 40K in the aver-
age value are in the ratio 28:56.2:15.78. Results for each
sample as well as average results for each site are also
listed in Table 4.
To estimate annual effective dose, account was taken
of the conversion coefficient from absorbed dose in air to
effective dose and the indoor occupancy factor. The
committee used 0.7 Sv/Gy for the conversion coefficient
from absorbed dose in air to effective dose received by
adults, and 0.2 for the outdoor occupancy factor [2, 13].
Effective dose rate outdoors in units of mSv per year was
calculated by the following formula:
-6
Annual effective dose(mSv)
D(nGy/h) 8,760 h 0.2 0.7 Sv/Gy10
(4.8)
Results for outdoor annual effective dose are shown in
Table 4. It ranged from 0.4 to 0.18 mSv with an average
Table 4. Absorbed dose rates from 226Ra, 232Th, and 40K and annual effective dose (Bathinda, Amritsar, Pathankot and Dal-
housie).
Absorbed dose rate
Sample 226Ra
(nGy/h)
232Th
(nGy/h)
40K
(nGy/h)
Total
(nGy/h)
Annual effective dose
(mSv)
Bathinda location 1 26.41 ± 0.50 62.86 ± 2.46 20.41 ± 0.21 109.69 ± 3.18 0.135 ± 0.004
Bathinda location 2 20.38 ± 0.41 43.87 ± 1.86 10.54 ± 0.13 74.80 ± 2.39 0.092 ± 0.003
Bathinda location 3 38.01 ± 0.68 75.11 ± 3.16 21.16 ± 0.23 134.29 ± 4.08 0.165 ± 0.005
Bathinda location 4 34.50 ± 0.57 73.35 ± 1.18 20.28 ± 0.22 128.14 ± 1.97 0.157 ± 0.002
Bathinda location 5 19.35 ± 0.37 43.05 ± 2.20 11.35 ± 0.14 73.76 ± 2.70 0.090 ± 0.003
Bathinda location 6 15.67 ± 0.26 37.86 ± 2.13 10.58 ± 0.13 64.11 ± 2.51 0.079 ± 0.003
Average 25.72 ± 0.47 56.02 ± 2.17 15.72 ± 0.18 97.47 ± 2.81 0.120 ± 0.003
Standard deviation 8.93 16.48 5.38 30.45 0.037
Amritsar location 1 26.04 ± 0.50 54.75 ± 1.98 12.58 ± 0.15 93.36 ± 2.63 0.114 ± 0.003
Amritsar location 2 16.35 ± 0.30 30.03 ± 1.03 9.66 ± 0.12 56.04 ± 1.46 0.069 ± 0.002
Amritsar location 3 19.63 ± 0.36 39.55 ± 1.76 8.93 ± 0.11 68.11 ± 2.23 0.084 ± 0.003
Amritsar location 4 21.40 ± 0.42 34.87 ± 1.49 10.75 ± 0.13 67.02 ± 2.03 0.082 ± 0.002
Amritsar location 5 23.60 ± 0.45 44.76 ± 2.22 13.02 ± 0.15 81.38 ± 2.84 0.100 ± 0.003
Amritsar location 6 43.93 ± 0.72 79.82 ± 3.09 20.57 ± 0.22 144.32 ± 4.03 0.177 ± 0.005
Average 25.16 ± 0.46 47.30 ± 1.93 12.59 ± 0.15 85.04 ± 2.53 0.104 ± 0.003
Standard deviation 9.78 18.07 4.22 31.78 0.039
Pathankot location 1 26.32 ± 0.48 60.45 ± 2.30 21.19 ± 0.22 107.95 ± 3.00 0.132 ± 0.004
Pathankot location 2 9.42 ± 0.22 20.10 ± 1.14 7.90 ± 0.11 37.42 ± 1.46 0.046 ± 0.002
Pathankot location 3 16.04 ± 0.33 37.42 ± 2.51 10.09 ± 0.13 63.56 ± 2.97 0.078 ± 0.004
Pathankot location 4 27.41 ± 0.51 61.56 ± 2.34 18.45 ± 0.20 107.42 ± 3.06 0.132 ± 0.004
Pathankot location 5 29.71 ± 0.53 54.19 ± 1.99 16.82 ± 0.18 100.72 ± 2.70 0.124 ± 0.003
Pathankot location 6 9.00 ± 0.24 18.24 ± 1.07 8.24 ± 0.11 35.48 ± 1.41 0.044 ± 0.002
Average 19.65 ± 0.38 41.99 ± 1.89 13.78 ± 0.16 75.43 ± 2.43 0.093 ± 0.003
Standard deviation 9.35 19.68 5.74 34.36 0.042
Dalhousie location 1 13.52 ± 0.25 22.43 ± 0.79 9.33 ± 0.12 45.28 ± 1.16 0.056 ± 0.001
Dalhousie location 2 34.83 ± 0.83 76.54 ± 3.26 20.23 ± 0.21 131.61 ± 4.31 0.161 ± 0.005
Dalhousie location 3 44.39 ± 0.78 82.22 ± 3.16 18.94 ± 0.20 145.55 ± 4.14 0.179 ± 0.005
Dalhousie location 4 17.59 ± 0.33 31.14 ± 1.35 11.04 ± 0.13 59.77 ± 1.81 0.073 ± 0.002
Dalhousie location 5 40.40 ± 0.67 66.03 ± 2.49 12.39 ± 0.14 118.82 ± 3.30 0.146 ± 0.004
Dalhousie location 6 26.33 ± 0.44 53.47 ± 2.17 13.32 ± 0.15 93.12 ± 2.76 0.114 ± 0.003
Average 29.51 ± 0.55 55.31 ± 2.20 14.21 ± 0.16 99.03 ± 2.91 0.121 ± 0.004
Standard deviation 12.46 24.32 4.40 40.21 0.049
Copyright © 2011 SciRes. JEP
Measurement of Radioactivity of 238U, 226Ra, 232Th and 40K in Soil of Different Geological Origins in Northern India
966
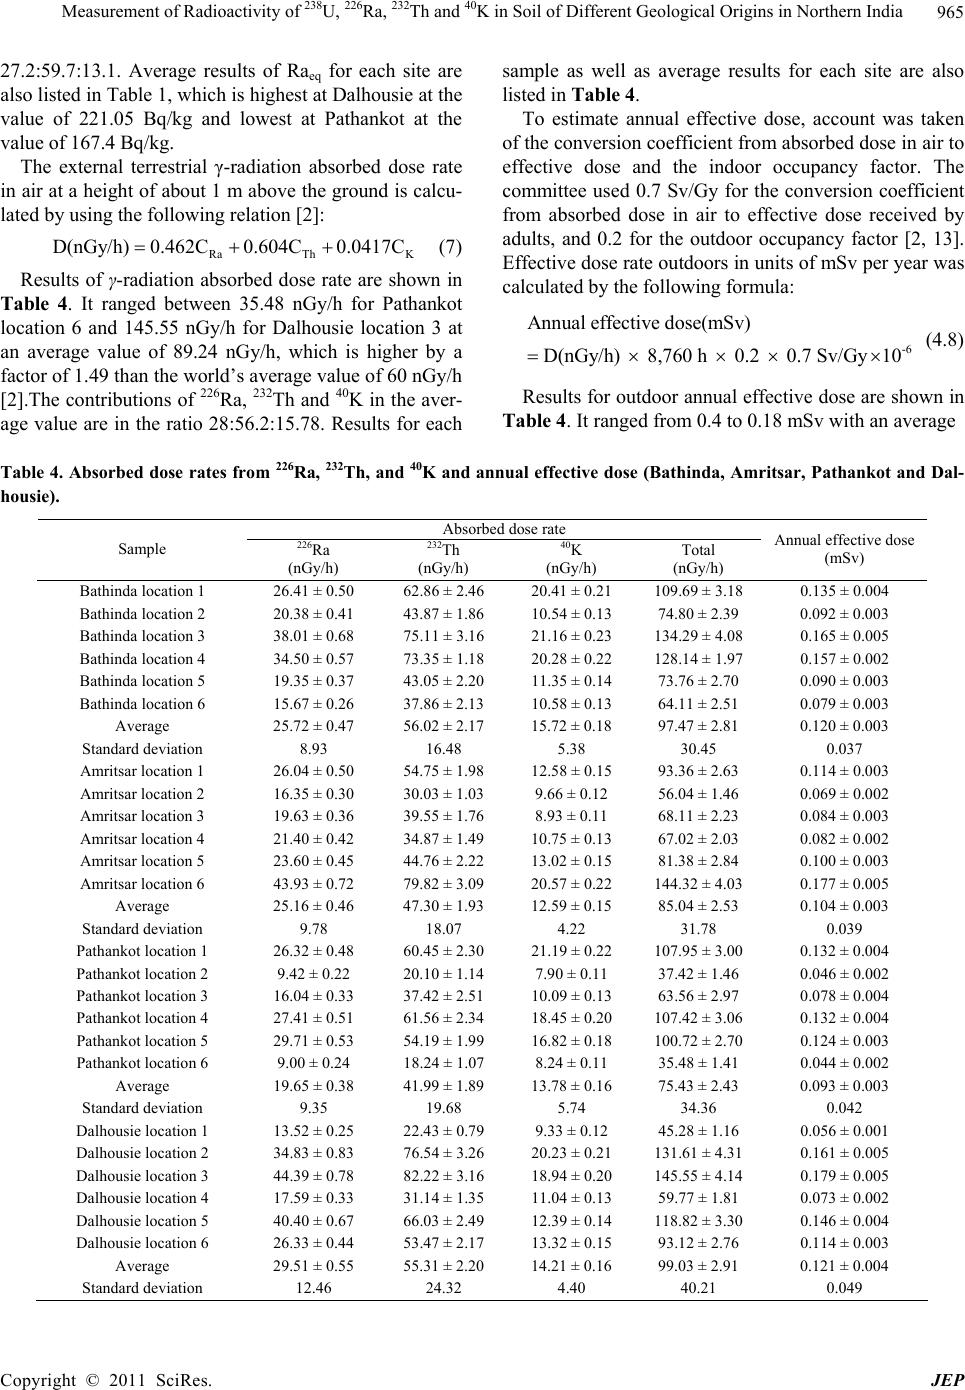
value of 0.11 mSv, while the world wide outdoor average
annual effective dose is approximately 0.07 mSv [2].
Only three samples, Pathankot location 2, Pathankot lo-
cation 6 and Dalhousie location 1, have lower values
than the worldwide average value, which are 0.05, 0.04
and 0.06 mSv, respectively. Average annual effective
doses at Bathinda and Dalhousie are equal at 0.12 mSv
and are higher than other two sites Amritsar by factor of
1.20 and Pathankot by a factor of 1.33.
4. Conclusions
1) For the determination of 226Ra and 232Th activity con-
centrations, more than three γ-ray energy peaks were
used.
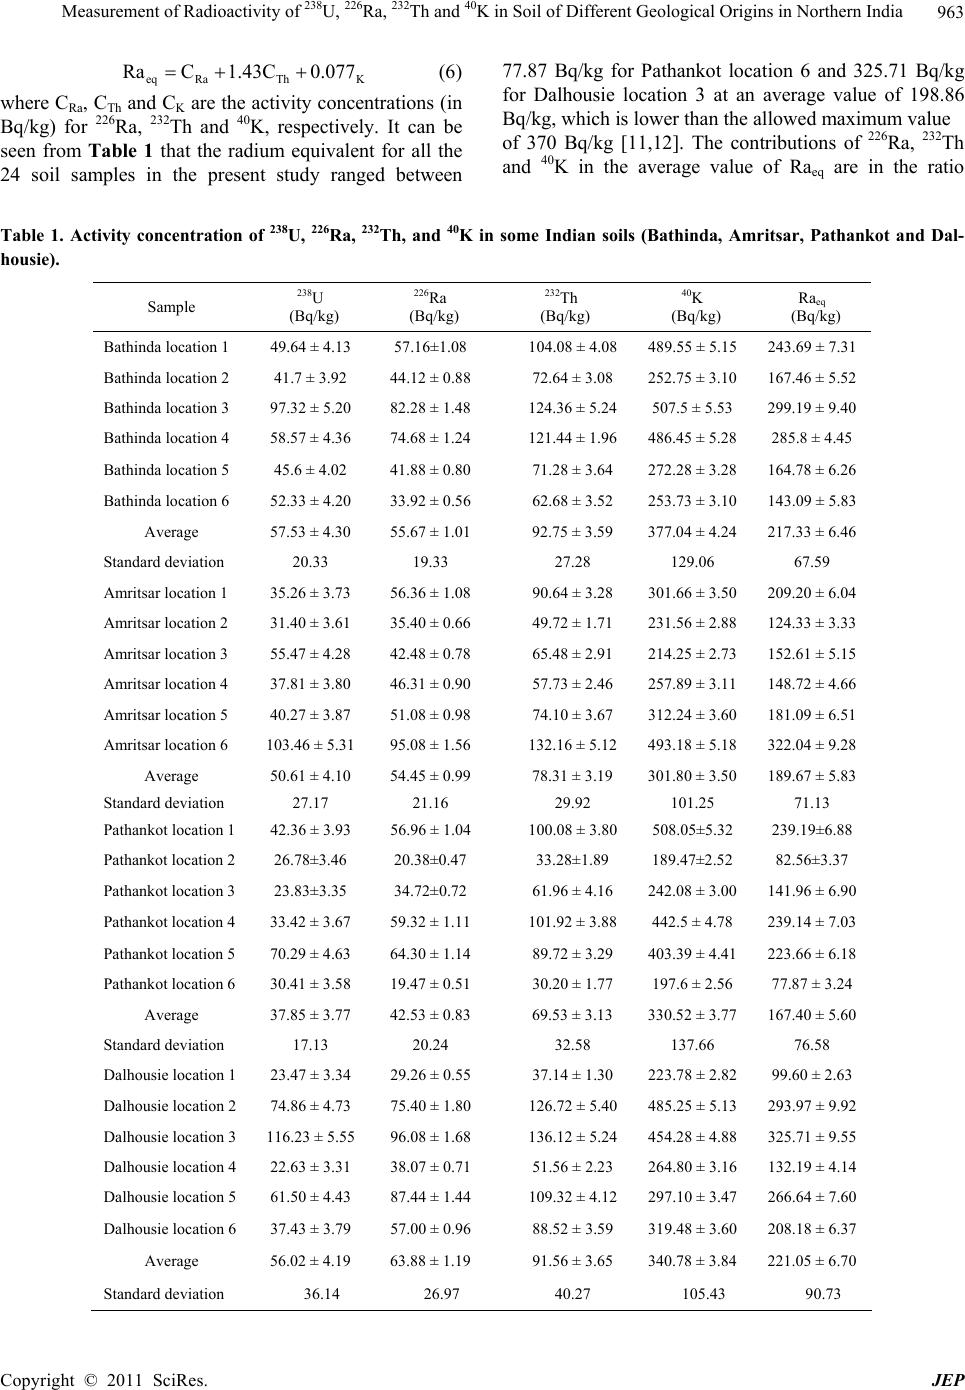
2) Average activity concentrations of 238U, 226Ra and
232Th are higher and activity concentration of 40K is
lower as compared to the worldwide average concentra-
tion.
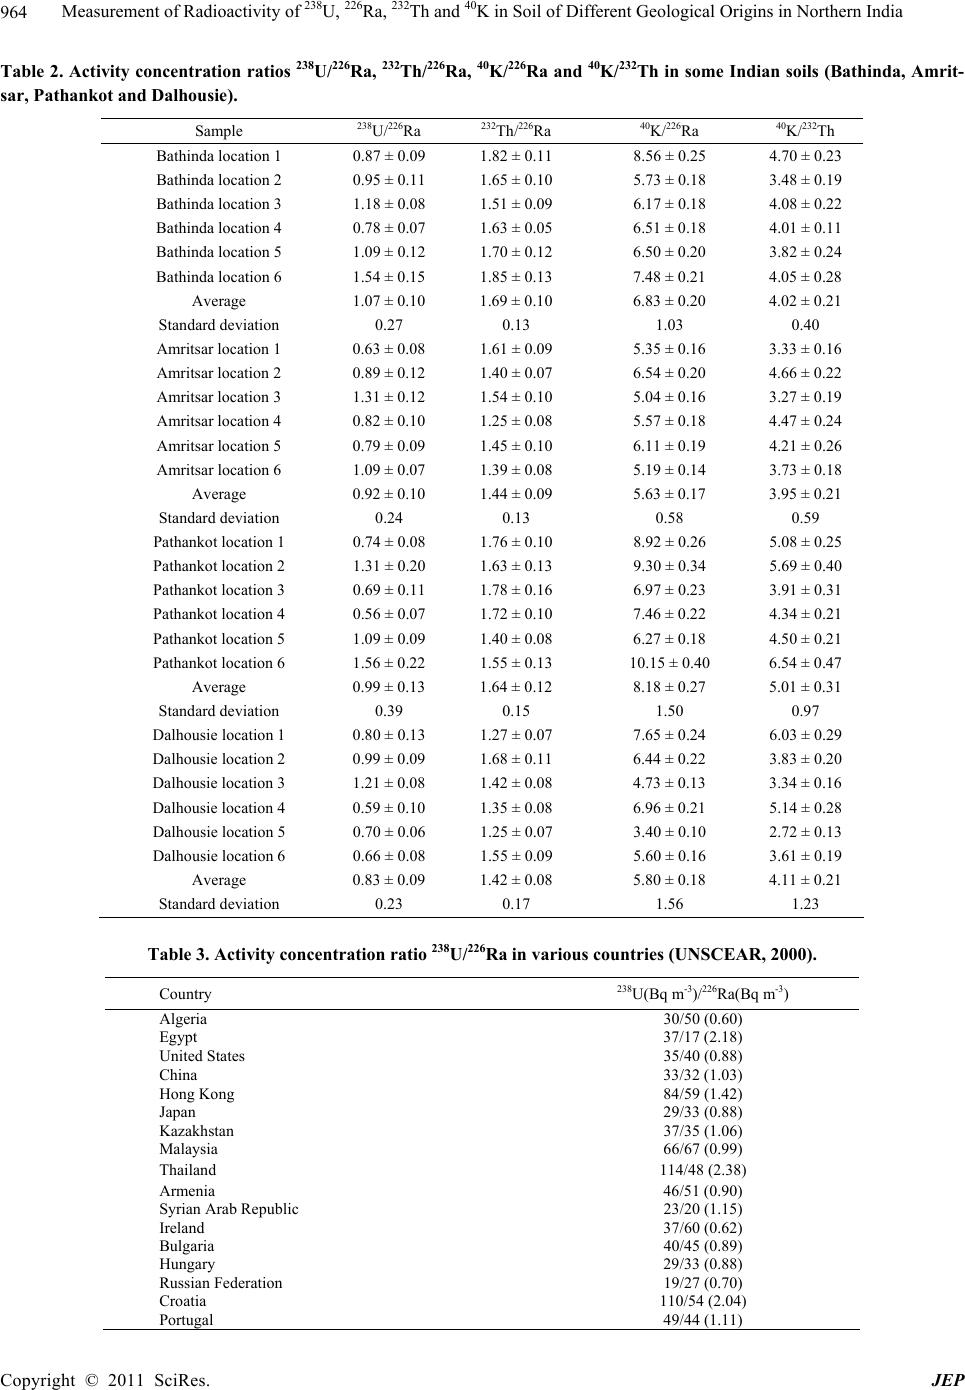
3) Dalhousie exhibit lowest 238U/226Ra ratio while Am-
ritsar and Bathinda exhibit higher 238U/226Ra ratio due to
their different climatic changes.
Average results of Raeq is highest at Dalhousie with
value 221.05 Bq/kg and lowest at Pathankot with value
167.4 Bq/kg.
REFERENCES
[1] M. Tufail, N. Akhtar and N. Waqas, “Measurement of
Terrestrial Radiation for Assessment of Gamma Dose
from Cultivated and Barren Saline Soils of Faisalabad of
Pakistan,” Radiation Measurement, Vol. 41, No. 4, 2006,
pp. 443-451. doi:10.1016/j.radmeas.2005.10.007
[2] UNSCEAR, “United Nations Scientific Committee on the
Effects of Atomic Radiation. Sources and Effects of Ion-
izing Radiations,” United Nations, New York, 2000.
[3] M. Sohrabi, “Recent Radiological Studies of High Level
Natural Radiation Areas of Rasmar,” Proceeding of the
International Conference on High Levels of Natural Ra-
diation, Rasmar, IAEA, Vienna, 1993.
[4] C. M. Sunta, “A Review of the Studies of High Back-
ground Areas of the S-W Coast of India,” Proceeding of
the International Conference on High Levels of Natural
Radiation, Rasmar, IAEA, Vienna, 1993.
[5] H. Zhu, H. Huang, J. Song , J. Li, J. Zhang, J. Huang, Y.
Zha and Y. Guo, ”Gamma Radiation Levels Around the
Highest Background Area in Poland,” Proceeding of the
International Conference on High Levels of Natural Ra-
diation, Rasmar, IAEA, Vienna, 1993.
[6] M. J. Anagnostakis, E. P. Hinis, D. J. Karangelos, N. P.
Petropoulos, P. K. Rouni, S. E. Simopoulos and Z. S.
Zunic, “Determination of Depleted Uranium in Environ-
mental Samples by Gamma-Spectroscopic Techniques,”
Archive of Oncology, Vol. 9, 2001, pp. 231-236.
[7] A. S. Murray and M. J. Aitken, “Analysis of Low-Level
Natural Radioactivity in Small Mineral Samples for Use
in Thermoluminescence Dating, Using High Resolution
Gamma Spectrometry,” Applied Radiation and Isotopes,
Vol. 39, No. 2, 1988, pp. 145-158.
doi:10.1016/0883-2889(88)90160-8
[8] Z. Papp, Z. Dezso and S. Daroczy, “Measurement of the
Radioactivity of 238U, 232Th, 226Ra, 137Cs and 40K in Soil
Using Direct Ge(Li) γ-Ray Spectrometry,” Journal of Ra-
dioanalytical and Nuclear Chemistry, Vol. 222, No. 1-2,
1997, pp. 171-176. doi:10.1007/BF02034265
[9] A. Navas, J .Soto and J. Machin, “238U, 226Ra, 210Pb, 232Th
and 40K Activities in Soil Profiles of the Flysch Sector
(Central Spanish Pyrenees),” Applied Radiation and Iso-
topes, Vol. 57, No. 4, 2002, pp. 579-589.
doi:10.1016/S0969-8043(02)00131-8
[10] M. Dowdall and J. O’Dea, “226Ra/ 238U Disequilibrium in
an Upland Organic Soil Exhibiting Elevated Natural Ra-
dioactivity,” Journal of Environmental Radioactivity, Vol.
59, No. 1, 2002, pp. 91-104.
doi:10.1016/S0265-931X(01)00038-8
[11] J. Beretka and P.J. Mathew, “Natural Radioactivity of
Australian Building Materials, Industrial Wastes and
by-Products,” Health Physics, Vol. 48, No. 1, 1985, pp.
87-95. doi:10.1097/00004032-198501000-00007
[12] OECD, “Exposure to Radiation from the Natural Radio-
activity in Building Materials,” Report by a Group of
Experts of the OECD, Nuclear Energy Agency, Paris,
1979.
[13] UNSCEAR, “United Nations Scientific Committee on the
Effects of Atomic Radiation. Ionizing Radiation Sources
and Biological Effects,” Reports to general assembly,
United Nations, New York, 1993.
Copyright © 2011 SciRes. JEP