Journal of Environmental Protection, 2011, 2, 915-922
doi:10.4236/jep.2011.27104 Published Online September2011 (http://www.SciRP.org/journal/jep)
Copyright © 2011 SciRes. JEP
915
Turbidimetric Determination of Hydrocarbon
Contamination in Passaic River Sediments and
Refinery Polluted Soils
Mahmood Mahdi Barbooti
Department of Earth and Environmental Studies, Montclair State University, Montclair, USA.
Email: brbt2m@gmail.com
Received May 15th, 2011; revised June 19th, 2011; accepted July 27th, 2011.
ABSTRACT
A rapid method is described for the determination of petroleum hydrocarbons in soil samples. The method is based on
the extraction of hydrocarbons by a solvent and the treatment of the solution with an aqueous solution of a surfactant to
release the hydrocarbons to the water phase in the form of a stable emulsion. The emulsion is then utilized to measure
the hydrocarbon content by turbidimetry. The effects of various operating parameters including the surfactant solution
composition and time of extraction and time of mixing with the releasing solution are investigated. The stability of the
emulsion was improved in acid environment containing and electrolyte. The turbidity values (T) were related with hy-
drocarbon concentration in the extract (C) by the following equation. Turbidity = 2.75 C + 205.7. With R2 = 0.9929.
The soil hydrocarbon content (SHC) measured in µg/g can then be calculated using the formula: SHC = [Extract Vol.
(mL) x C]/Sample Wt (g). The results correlated well with the results of to tal hydrocarbons in soils determined by stan-
dard methods. The method was applied for the estimation of hydrocarbons in Passaic river sediments taken from vari-
ous locations and depths. For field work the method was used to supply data on the hydrocarbon contamination of soil
samples taken within an oil refinery and a monitoring well drilled within heavy hydrocarbon waste dumping location.
Keywords: Hydrocarbon Contamination, Turbidimetry, Refinery Soils, Passaic River Sediments
1. Introduction
There is an increasing interest in the environmental stud-
ies due to the health impacts of the various pollutants.
Petroleum hydrocarbons (HC) are among the dangerous
materials because they are potential carcinogenic materi-
als. The HC are introduced to our environment from re-
fining and various processes utilizing HC as fuels. On the
marine environment they float and prevent the oxygen
exchange and reduce the penetration of sunshine from
reaching the deep marine phytoplanctons and conse-
quently alter the production of oxygen. Transportation,
fallouts and leakage may contribute to the total HC intro-
duction to soil and water. Osuji and Nwoye [1], reported
that hydrocarbon pollution of soil generally imply low
soil fertility, which in turn implies low agricultural pro-
ductivity and reduced source of livelihood in the affected
area. Thus, contingency/remedial measures should in-
clude the application of appropriate and sufficient inor-
ganic NPK fertilizer to restore the carbon to nutrient ra-
tios to the optimum required to stimulate and sustain mi-
crobial activity. Clays like montmorillonite and kaolinite
proved capable of promoting microbial growth and al-
lowed microorganisms to proliferate (to a greater degree
than in a control sample which contained no clay) in an
extremely high concentration of heavy oil [2].
The determination of HC is the first step in the reme-
diation and site assessment programs. Thus, the methods
need to be reliable, precise and simple to provide the
correct the right data on which the decision makers and
engineers make their plans. Systematic methods are
available for the detailed and quantitative evaluation of
HC contamination levels. The methods involve the ex-
traction of soil samples with organic solvents like di-
chloromethane or hexane using the soxhlet systems and
the concentration of the extract with heating and vacuum
to bring the HC concentration up to the detectable levels
of the measuring instruments and to recover the solvent.
These methods are performed in well equipped laborato-
ries and take more than 24 hrs. Concentrated samples can
then be used for quantitative and qualitative evaluations.
However, heating and vacuum may result in the loss of
Turbidimetric Determination of Hydrocarbon Contamination in Passaic River Sediments and Refinery Polluted Soils
916
the more important volatile and semivolatile components
[3,4].
An impressing approach was introduced by Zhang et
al. [5], by extracting soil with a water soluble solvent,
THF, and followed by turbidimetric determination of the
HC after release into water containing surfactant. Based
on this procedure patents were registered, namely, US
575635; 5679574 and 6117682 to deal with the determi-
nation of petroleum hydrocarbons in water and soil sam-
ples. Kulichenko and Shevchenko [6], utilized the Triton
X-100-stabilized “oil-in-water” emulsions as suitable
media for alkalimetric determination of hydrophobic
organic acids. Due to their potent solubilizing and emul-
sifying properties, synthetic surfactants and biosurfactants
can be used for removing hydrophobic pollutants from
soil. Pastewski, et al. [7], investigated the wetting prop-
erties, emulsification and micellar solubilization of non-
ionic surfactants and biosurfactant. Emulsions stabilized
by Triton X-100 were the most stable.
For field work, a commercial kit was employed for the
screening and quantitative assay of petroleum HC in re-
finery soil samples [8]. The work is based on the extrac-
tion of HC with a solvent, filtering with syringe filter and
finally adding the filtrate onto a developer to produce
emulsion. The emulsion is measured by turbidimetry.
The solvent and developer is a property of the manufac-
turer.
The present paper focuses on the development of sol-
vent surfactant system for the determination of HC in
soils. Various operating parameters were evaluated to
establish the best conditions for the determination. The
method is applied on the determination of HC in Passaic
River which is known of its pollution with HC and other
contaminants [9] and to soil samples collected from a
local refinery in Iraq.
2. Experimental
2.1. Materials and Reagents
Methanol was a spectroscopy grade from Merck. Ethanol
was a 95.5% analytical grade reagent from Merck. Tri-
ton-X-100 (Merck, AG). The diesel fuel sample used was
an Exxon highway diesel fuel with a maximum sulfur
content of 15 ppm supplied from a local fuel station in
Montclair, NJ.
2.2. Procedures
A stock solution of the low sulfur diesel fuel in metha-
nol-ethanol mixture (3:1 respectively) was prepared by
dissolving 2.500 g of the hydrocarbon in the solvent
mixture and dilution to 250 mL in a calibrated flask to
give a concentration of 10,000 ppm. A set of calibration
standards: 50, 100, 200, 300, 500, 750, 1000, 1500 and
2000 mg/L that are equivalent to 0.005, 0.010, 0.020,
0.030, 0.050, 0.075, 0.100, 0.150 and 0.200% were pre-
pared by proper dilution of the stock solution with the
solvent mixture. The emulsifier solution was prepared by
dissolving 0.250 g of Triton X-100 with 2.5 g of NaCl
and 1-mL aliquot of 1 M HCl in the minimum amount of
water. The solution was diluted to 250 mL to give 1000
ppm of the detergent in 1% NaCl and (0.001 - 0.002 M
HCl. A set of glass bottles were prepared to be used as
the reaction cells and a constant volume of the emulsifier
solution was introduced to each of them. An aliquot of
5.0 mL of each standard solution was added twice to 10
mLs of the surfactant solution. The mixing time was
fixed at 15 s and the settling time at 5 min and the emul-
sion stabilization at 10 mins. Two readings were taken
for each emulsion, i.e., four readings for each standard
solution. The turbidity values of the resultant emulsions
were measured.
2.2.1. Mixing of Hydrocarbons with water and
Emulsification
To a constant volume of water (50 mL) various amounts
(10 mL - 50 mL) of the HC alcoholic hydrocarbon solu-
tion were added and agitated for 10 s - 60 s. The appear-
ance of the mixture was monitored to ensure the release
of HC from the alcoholic solution to water. The immisci-
bility of HC with water caused the separation of HC as a
distinct layer above the water phase. When the best ratio
of mixing was evaluated, the experiment was repeated
several times to ensure stability and repeatability.
Water in the previous section was replaced with an
aqueous solution (1000 mg/L) of the surfactants used.
The HC—water mixture will appear as a white translu-
cent (Turbid) solution depending on the amount of the
two components. The turbidity measurement this time
was employed to detect the release of HC into the water
phase.
2.2.2. Calibration Curve
An aliquot of the standard solution was added to the re-
action cell t a ratio of 2:3 (HC solution: Detergent solu-
tion). The bottle contents were mixed thoroughly for 15 s
- 20 s and left to settle for 4 mins. The reaction mixture
was poured into the turbidimeter cell and the measure-
ment was taken after 10 s - 20 s.
2.2.3. Synthetic Soil Samples Preparation
Small amount of soil taken from a forest on the sur-
roundings of Montclair city to represent HC free samples
was mixed specified volume of alcoholic solution of
standard diesel fuel oil. The mixture was thoroughly ho-
mogenized to ensure even distribution of the HC in the
soil. During homogenization the alcohol was gradually
evaporated. Finally the remaining alcohol was evapo-
Copyright © 2011 SciRes. JEP
Turbidimetric Determination of Hydrocarbon Contamination in Passaic River Sediments and Refinery Polluted Soils917
rated under vacuum. Calculated amounts of the dry HC-
polluted soil were place in plastic centrifuge tubes with
10 mL -15 mL of the alcoholic mixed-solvent and the
tube was capped. Various shaking time intervals were
selected to ensure maximum removal of HC from soil (2
- 10 mins). The mixture was then allowed for enough
time for the soil to settle. The extract was decanted into a
syringe filter fitted with a 0.2 μm fiber filter. The plunger
was fitted to the syringe and pushed to force the clear
extract into a vial containing the hydrocarbon-releasing
and emulsifying solution. The procedure was completed
to develop the formation of emulsion and stabilized for
10 min before the turbidity reading was taken. It ap-
peared that the turbidity values increase as the shaking
time increases up till 3.5 min when the reading showed
pronounced stability. The shaking time was then fixed on
4-5 min in the proposed procedure.
2.3. Sampling of Sediments and Soils
Several sediment samples were taken from Passaic river
sediments at various depths. These samples were studied
for their clay contents and total organic matter by Bujal-
ski and Kruge [10] to ensure variety of HC levels and
various textures. The samples were also analyzed in ac-
cordance with standard EPA method for comparative
purposes.
The method was also applied for the estimation of pe-
troleum hydrocarbon contamination of samples taken
from a local refinery site including storage tanks, area
surrounding the water treatment plant of the refinery and
from the heavy hydrocarbons dumping location. Soil
samples were also taken during the digging of a moni-
toring well (8.0 m depth at 0.5 m intervals to evaluate the
possibility of penetration of hydrocarbons in the soil and
the possible contamination of the ground water. In
some cases a small distance between samples gave high
differences in the hydrocarbon contents. The choice of
these samples was according to the use of the location.
2.4. Determination of Hydrocarbons in Soil
The most relevant sample preparation procedures were
applied [11]. Randomly 15 samples from the Daura re-
finery were selected for the ASTM Soxhlet method. Ac-
curately about 20 g of soil samples were weighed and
thoroughly mixed with an equal amount of anhydrous
sodium sulfate to aid dehydration and then placed in the
extraction cellulosic thimble. The thimble was inserted
within the Soxhlet apparatus and hexane (later replaced
with dichloromethane) was employed for the extraction.
The extraction took 16 hr - 20 hr. In the next day the
system was dismantled and the flask containing the hy-
drocarbon extract was fitted in the RV-05 IKA Rotary
Evaporation System to aid the concentration and solvent
recovery. The evaporation continues until the volume of
the solution is reduced to 4 mL - 7 mL volume. The con-
centrate was transferred quantitatively into a watch glass
and left for air drying and weighed until a constant
weight was obtained.
3. Results and Discussion
3.1. Water-Hydrocarbons Mixing and
Emulsification
The addition of the HC alcoholic solution to water re-
sulted in a smoothly separation of HC from the solution.
It was found that mixing the solution with water for 15 s
- 30 s is adequate for the release of all the HC from the
solution to form a distinct layer above the water surface
on standing. Thus, the alcoholic mixture acts as a vehicle
for the transport of hydrocarbon from the soil into water
system. However, beyond 40 mL hydrocarbon solution
volume it was clear that not all the HC could be released.
By repeating the experiment it was found that a HC solu-
tion volume of 20 mL - 30 mL (40% - 60% of water vol-
ume) gave the best results. Further, the addition must be
done gradually to give the best release of HC.
Hydrocarbons do not mix with water unless an emulsi-
fier is added. The emulsifier is a surface active agent
which has two ends of different polarity. The hydrophilic
end comprises a hydrolysable group that facilitates inti-
mate mixing with water. The other end is the oleophilic
group which dissolves in the oil and hence a total distri-
bution of the HC in the water body. Detergents are used
in bulk quantities in the cleaners industry which can suc-
cessfully separate oil contamination from hands and fab-
rics by forming micelles giving a stable colloidal solution
for a defined time. The HC—water mixture will appear
as a white translucent (Turbid) solution depending on the
amount of the two components. Ionic and non-ionic de-
tergents are commercially available for the various pur-
poses.
The goal now is to produce an emulsion from the re-
leased HC with water and has to be stable for certain
interval of time to allow turbidimetric measurement.
Household detergent products usually contain some addi-
tive like colors and perfumes. Thus, these products could
not be employed for the present work. Dodecylbenzene-
sulfonate, DBS, (anionic detergent) and Triton X-100
(non-ionic detergent) were chosen for this purpose.
The use of DBS 1000 ppm aqueous solution resulted
in good emulsion upon mixing but with limited stability
(2 min - 4 min). This limited stability will limit the ap-
plicability of the resultant emulsion for subsequent tur-
bidity measurements.
Meanwhile, the 1000 ppm triton X-100 solution gave
very good emulsion with improved stability of 14 min -
Copyright © 2011 SciRes. JEP
Turbidimetric Determination of Hydrocarbon Contamination in Passaic River Sediments and Refinery Polluted Soils
Copyright © 2011 SciRes. JEP
918
22 min. Thus, the latter was employed for the rest of this
study as the emulsifier or the turbidity developing agent.
To aid the application, sodium chloride was added to
give the required medium for complete rejection of HC
into water. The emulsions stabilized by Triton X-100
were the most stable [7]. Acidification was also important
because the emulsion breakdown occurs at 10 < pH <
13.5. An emulsion stability gap was also observed at 102
< N < 2.5 × 101 of polyvalent metal chlorides concentra-
tion in the initial aqueous phase [12]. However, the addi-
tion of inorganic acids did not significantly affect the
stability of emulsions stabilized by Triton X-100 [13].
A certain amount of Triton-X100 was found capable of
emulsifying a quantity of diesel fuel that is 1.5 times its
concentration in water. Also, the presence of the surfac-
tant helps to reduce the mixing time necessary to release
the HC into the water phase as it enters directly in emul-
sion in accordance with Le Chatelier law.
3.2. Determination of Turbidity Reading Time
After the formation of the oil-in-water emulsion at vari-
ous concentrations, the emulsion was placed in the tur-
bidimeter after ensuring the absence of any air bubbles
and making sure of the cleanliness of the cuvette sides. A
solution of moderate hydrocarbon concentration was
chosen to evaluate the stability of the emulsion. The
emulsion was left for one minute and the turbidity read-
ings started. Figure 1 shows the development of the
reading and its stability over certain time. It appears that
the reading was unstable and tends to increase to attain a
stable value for another 10 mins. Thus, a time interval of
10 mins must be elapsed before any reliable turbidity
reading to be taken for analytical purposes.
3.3. Analysis of Synthetic Samples
The results of the agricultural soil samples contaminated
with the diesel fuel oil indicated an increase of the tur-
bidity values with the increase of the shaking time up till
3.5 min when the reading showed pronounced stability.
The shaking time was then fixed on 4 min - 5 min in the
proposed procedure.
However, the high HC content of the soils is very well
reflected by the color of their alcoholic extract being dark
brown for the highly concentrated samples. This pre-
liminary observation led to use samples smaller than 10 g
for the concentrated soils.
Figure 1. Stability of Turbidity Reading.
Figure 2. Calibration Graph of the Turbidimetric Determination of Hydrocarbons.
Turbidimetric Determination of Hydrocarbon Contamination in Passaic River Sediments and Refinery Polluted Soils919
3.4. Recommended Procedure
1) In a plastic capped tube, specified amount (2.0 g - 5.0
g) of soil was placed and 10.0 mL of mixed alcohol sol-
vent were added. The tube contents were shaken for 4-5
min and left for 1 min - 2 min to settle.
2) The supernatent solution was decanted into a sy-
ringe filter equipped with a 0.2 μm fiber filter. The
plunger was introduced into the syringe and the solution
was transferred into a 10 mL capped vial.
3) 2.3 ml of the extract was transferred into a small
glass bottle of 10 mL - 15 mL size containing the 3.8 mL
of the emulsion developing solution. The mixture was
shaken for 15 s - 20 s and left for 8 - 12 min to stabilize.
4) The emulsion was placed in the turbidimeter meas-
uring cell and the reading was taken after 10 s - 15 s.
Another reading was taken to ensure reproducibility.
5) During the settling time of the extract and the emul-
sion, other soil sample may be taken and the procedure
was applied.
3.5. Range of Application of the Method
For the range of HC concentrations in alcohol only the
readings of the two highest standards (1500 and 2000
mg/L) fell out of the range of the turbidimeter. The tur-
bidity values were plotted against the concentration. The
signal increased linearly with the increase of concentra-
tion (Figure 3). Thus, linear correlation expresses the
relation of turbidity with concentration over the range of
50 mg/L - 1500 mg/L. However, a power relation was
described elsewhere between turbidity and soil hydro-
carbon after extraction [14].
Some of the standard solutions were utilized as sam-
ples to estimate the HC concentration of HC from the
measured Turbidity values. To calculate the HC content
of the analyzed soil samples the following relation was
employed:
HC% = (Extract Vol * HC concentration)/Soil sample
weight, g.
3.6. Applications
The results of HC contents of Passaic river sediments are
given in Table 1 in comparison with some published
results [10]. The results correlates well with the total
organic contents of Passaic River sediments [9] as can be
seen in Figure 3. However, the differences may be as-
signed to the variety of organic materials in the sediment
samples including plant residues and others of anthropo-
genic origin in addition to hydrocarbons [10].
The hydrocarbon contents of some refinery samples
determined by the standard Soxhlet gravimetric method
were compared with those determined with the present
method and the correlation can be seen in Figure 4. Rea-
sonable correlation could be attained because almost all
light hydrocarbons are already lost from the soil due the
long term evaporation during the many years and very
hot summer sunshine in Iraq. The appearance of the dried
extracts as resinous to greasy materials [8] may account
for the significant differences for some samples.
The hydrocarbon contamination distribution in the
Daura refinery soils is shown in Figure 5. For the soil
samples taken during the digging of a monitoring well,
the hydrocarbon distribution along the profile of the well
can be seen in Figure 6. The samples representing the
soil within the dumping lagoons, confirmed those related
to the soil layers of the monitoring well digging. At a
depth of 0.5 m maximum contamination could be ob-
served within the area of the dumping lagoons. The sur-
face soil within the lagoons area is always subject to
mixing with clean soil and burning and exposed to the
summer sun of Iraq for several seasons. At a depth of 2
m, the soil sample taken within the new project area ex-
hibited almost no hydrocarbon content and very trace-
Figure 3. Correlation between Organic Contents and the Turbidimetric Hydrocarbon Results.
Copyright © 2011 SciRes. JEP
Turbidimetric Determination of Hydrocarbon Contamination in Passaic River Sediments and Refinery Polluted Soils
920
Figure 4. Correlation between Soxhlet and Turbidimetric Hydrocarbon Results or Refinery Soil Samples.
Figure 5. The Distribution of Hydr ocarbons within the Refinery Site.
Figure 6. The hydrocarbon content of the soil of the monitoring well.
amounts of heavy metals. This is related to the difficult
penetration of hydrocarbons down to such depths [15].
Some samples were characterized by an average hydro-
carbon content of about 1000 ppm (0.1%). The sample
taken at the flare location indicated relatively high hy-
drocarbon content even at a high dilution.
Copyright © 2011 SciRes. JEP
Turbidimetric Determination of Hydrocarbon Contamination in Passaic River Sediments and Refinery Polluted Soils921
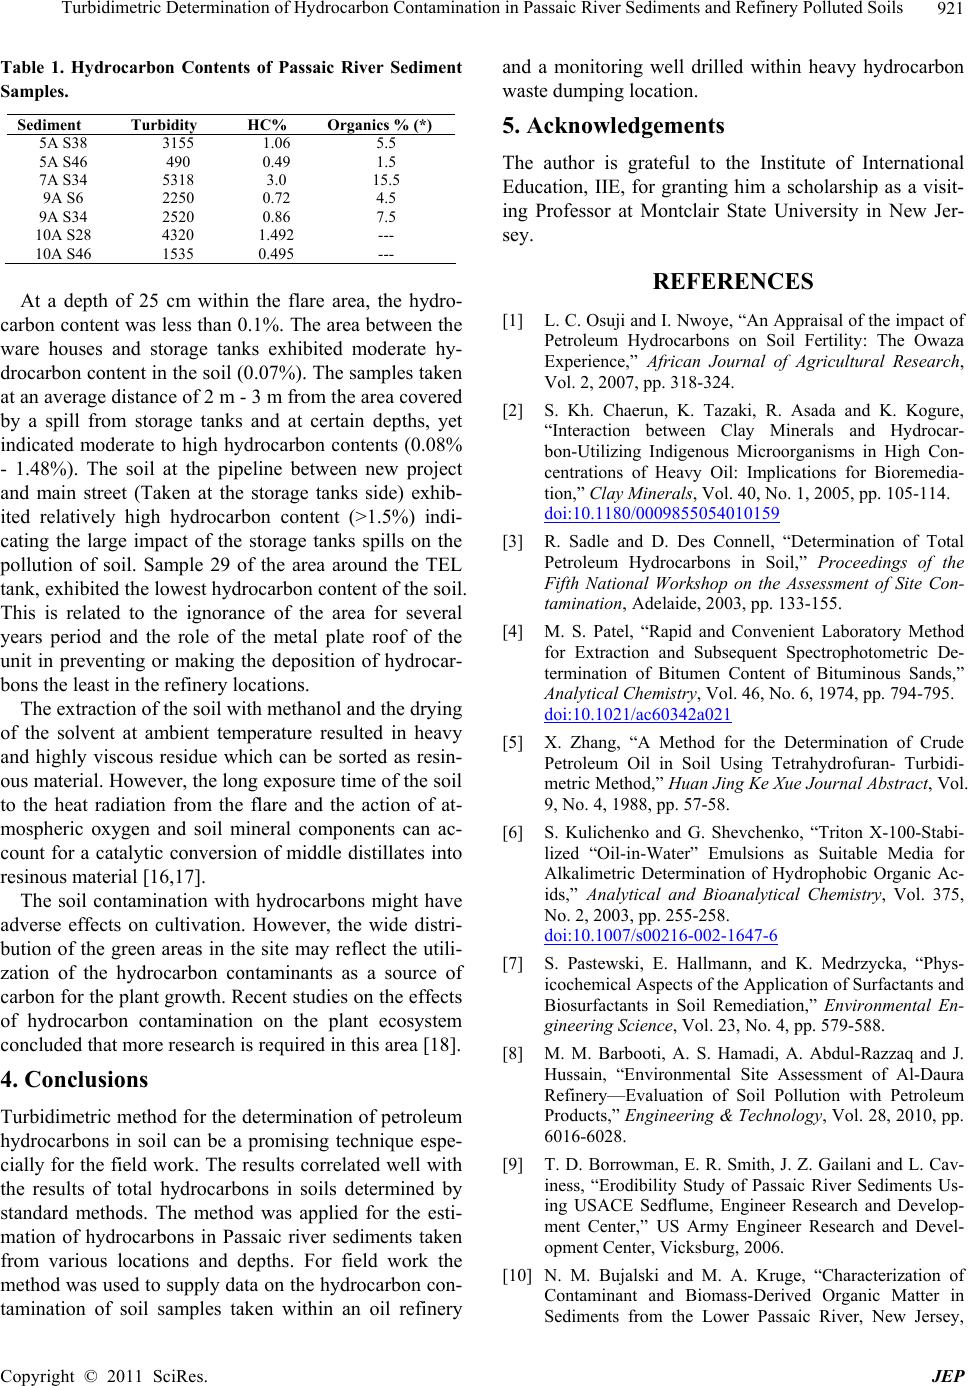
Table 1. Hydrocarbon Contents of Passaic River Sediment
Samples.
Sediment Turbidity HC% Organics % (*)
5A S38 3155 1.06 5.5
5A S46 490 0.49 1.5
7A S34 5318 3.0 15.5
9A S6 2250 0.72 4.5
9A S34 2520 0.86 7.5
10A S28 4320 1.492 ---
10A S46 1535 0.495 ---
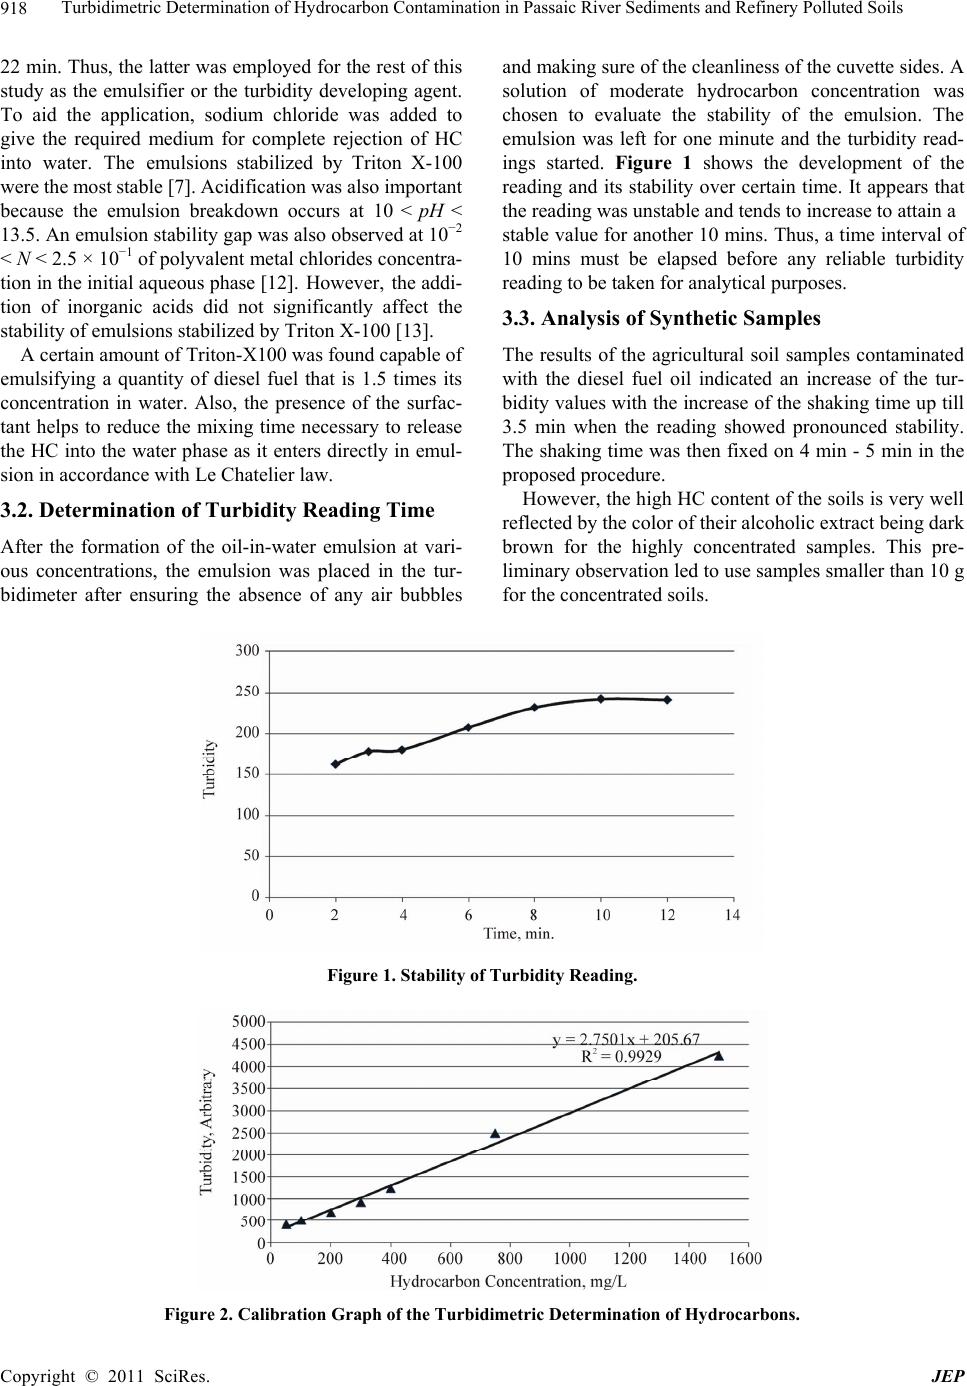
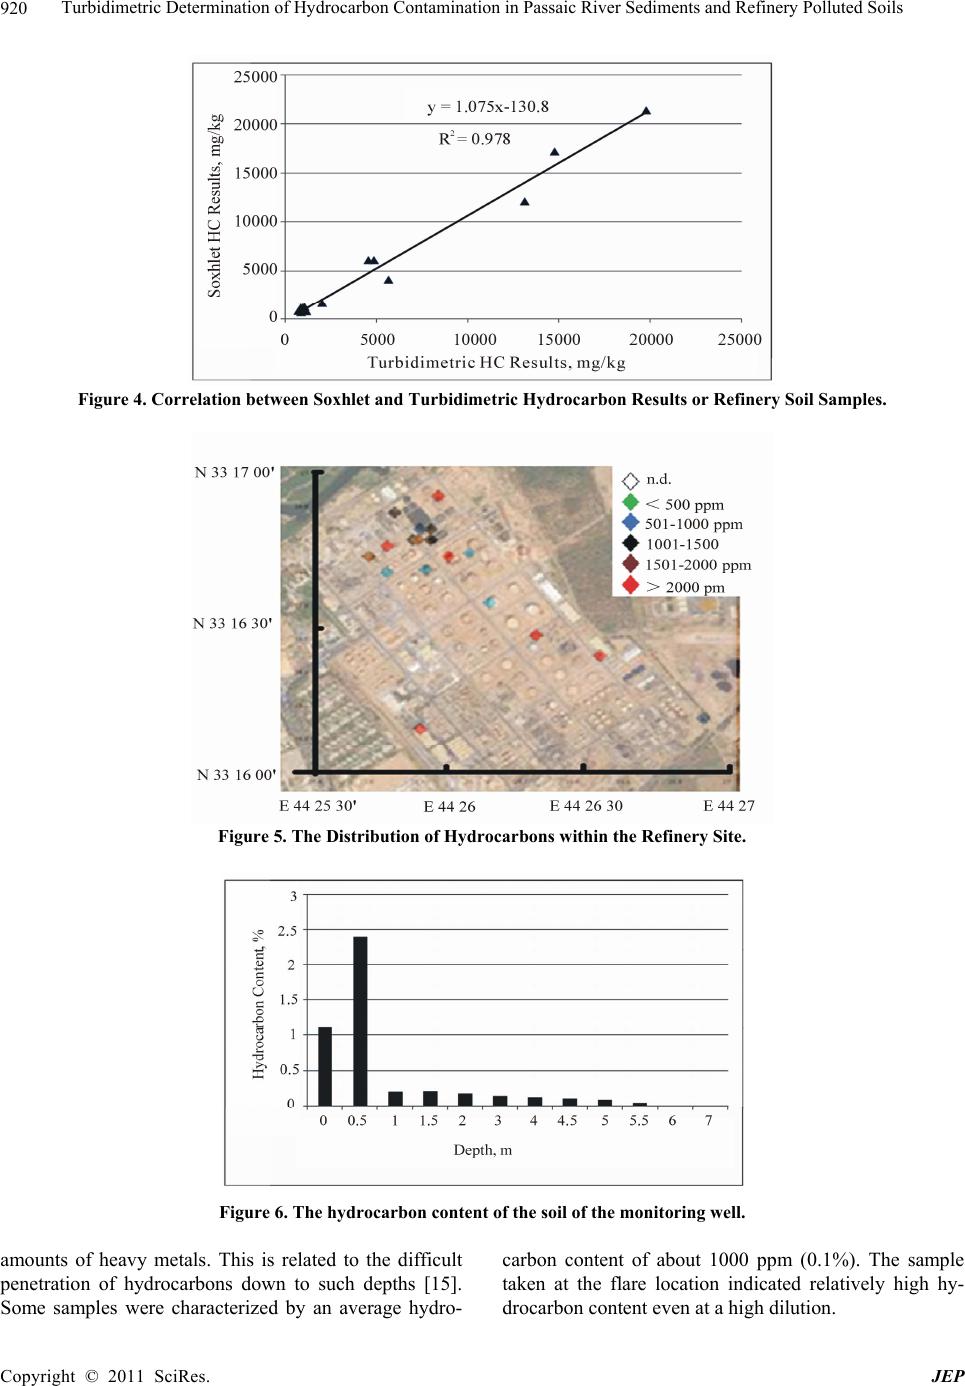
At a depth of 25 cm within the flare area, the hydro-
carbon content was less than 0.1%. The area between the
ware houses and storage tanks exhibited moderate hy-
drocarbon content in the soil (0.07%). The samples taken
at an average distance of 2 m - 3 m from the area covered
by a spill from storage tanks and at certain depths, yet
indicated moderate to high hydrocarbon contents (0.08%
- 1.48%). The soil at the pipeline between new project
and main street (Taken at the storage tanks side) exhib-
ited relatively high hydrocarbon content (>1.5%) indi-
cating the large impact of the storage tanks spills on the
pollution of soil. Sample 29 of the area around the TEL
tank, exhibited the lowest hydrocarbon content of the soil.
This is related to the ignorance of the area for several
years period and the role of the metal plate roof of the
unit in preventing or making the deposition of hydrocar-
bons the least in the refinery locations.
The extraction of the soil with methanol and the drying
of the solvent at ambient temperature resulted in heavy
and highly viscous residue which can be sorted as resin-
ous material. However, the long exposure time of the soil
to the heat radiation from the flare and the action of at-
mospheric oxygen and soil mineral components can ac-
count for a catalytic conversion of middle distillates into
resinous material [16,17].
The soil contamination with hydrocarbons might have
adverse effects on cultivation. However, the wide distri-
bution of the green areas in the site may reflect the utili-
zation of the hydrocarbon contaminants as a source of
carbon for the plant growth. Recent studies on the effects
of hydrocarbon contamination on the plant ecosystem
concluded that more research is required in this area [18].
4. Conclusions
Turbidimetric method for the determination of petroleum
hydrocarbons in soil can be a promising technique espe-
cially for the field work. The results correlated well with
the results of total hydrocarbons in soils determined by
standard methods. The method was applied for the esti-
mation of hydrocarbons in Passaic river sediments taken
from various locations and depths. For field work the
method was used to supply data on the hydrocarbon con-
tamination of soil samples taken within an oil refinery
and a monitoring well drilled within heavy hydrocarbon
waste dumping location.
5. Acknowledgements
The author is grateful to the Institute of International
Education, IIE, for granting him a scholarship as a visit-
ing Professor at Montclair State University in New Jer-
sey.
REFERENCES
[1] L. C. Osuji and I. Nwoye, “An Appraisal of the impact of
Petroleum Hydrocarbons on Soil Fertility: The Owaza
Experience,” African Journal of Agricultural Research,
Vol. 2, 2007, pp. 318-324.
[2] S. Kh. Chaerun, K. Tazaki, R. Asada and K. Kogure,
“Interaction between Clay Minerals and Hydrocar-
bon-Utilizing Indigenous Microorganisms in High Con-
centrations of Heavy Oil: Implications for Bioremedia-
tion,” Clay Minerals, Vol. 40, No. 1, 2005, pp. 105-114.
doi:10.1180/0009855054010159
[3] R. Sadle and D. Des Connell, “Determination of Total
Petroleum Hydrocarbons in Soil,” Proceedings of the
Fifth National Workshop on the Assessment of Site Con-
tamination, Adelaide, 2003, pp. 133-155.
[4] M. S. Patel, “Rapid and Convenient Laboratory Method
for Extraction and Subsequent Spectrophotometric De-
termination of Bitumen Content of Bituminous Sands,”
Analytical Chemistry, Vol. 46, No. 6, 1974, pp. 794-795.
doi:10.1021/ac60342a021
[5] X. Zhang, “A Method for the Determination of Crude
Petroleum Oil in Soil Using Tetrahydrofuran- Turbidi-
metric Method,” Huan Jing Ke Xue Journal Abstract, Vol.
9, No. 4, 1988, pp. 57-58.
[6] S. Kulichenko and G. Shevchenko, “Triton X-100-Stabi-
lized “Oil-in-Water” Emulsions as Suitable Media for
Alkalimetric Determination of Hydrophobic Organic Ac-
ids,” Analytical and Bioanalytical Chemistry, Vol. 375,
No. 2, 2003, pp. 255-258.
doi:10.1007/s00216-002-1647-6
[7] S. Pastewski, E. Hallmann, and K. Medrzycka, “Phys-
icochemical Aspects of the Application of Surfactants and
Biosurfactants in Soil Remediation,” Environmental En-
gineering Science, Vol. 23, No. 4, pp. 579-588.
[8] M. M. Barbooti, A. S. Hamadi, A. Abdul-Razzaq and J.
Hussain, “Environmental Site Assessment of Al-Daura
Refinery—Evaluation of Soil Pollution with Petroleum
Products,” Engineering & Technology, Vol. 28, 2010, pp.
6016-6028.
[9] T. D. Borrowman, E. R. Smith, J. Z. Gailani and L. Cav-
iness, “Erodibility Study of Passaic River Sediments Us-
ing USACE Sedflume, Engineer Research and Develop-
ment Center,” US Army Engineer Research and Devel-
opment Center, Vicksburg, 2006.
[10] N. M. Bujalski and M. A. Kruge, “Characterization of
Contaminant and Biomass-Derived Organic Matter in
Sediments from the Lower Passaic River, New Jersey,
Copyright © 2011 SciRes. JEP
Turbidimetric Determination of Hydrocarbon Contamination in Passaic River Sediments and Refinery Polluted Soils
Copyright © 2011 SciRes. JEP
922
USA”, 2010.
http://pages.csam.montclair.edu/pri/symposium2010/krug
e_PRS2010.pdf
[11] Oil Industry Environmental Working Group, “Sampling
Protocols and Analytical Methods for Determining Petro-
leum Products in Soil and Water,” Wellington, 1999.
[12] J. J. Oren, G. David and M. MacKay, “Electrolyte and pH
Effect on Emulsion Stability of Water-in-Petroleum
Oils,” Fuel, Vol. 56, No. 4, 1977, pp. 382-384.
doi:10.1016/0016-2361(77)90062-X
[13] C. M. Chen, C. H. Lu, C. H. Chang, Y. M. Yang and. J. R.
Maa, “Influence of pH on the Stability of Oil-in-Water
Emulsions Stabilized by a Splittable Surfactant,” Colloids
and Surfaces A: Physicochemical and Engineering As-
pects, Vol. 170, No. 2-3, 2000, pp. 173-179.
doi:10.1016/S0927-7757(00)00480-5
[14] S. B. Friedman, T. N. Stewart and P. Mize, “Quantitative
Test for Oils, Crude Oil, Hydrocarbon, or Other Con-
taminants in Soil and a Kit for Performing the Same,” US
Patent 5679574, October 21, 1997.
[15] P. Oleszczuk and S. Baran, “Degradation of Individual
Polycyclic Aromatic Hydrocarbons (PAHs) in Soil Pol-
luted with Aircraft Fuel,” Polish Journal of Environ-
mental Studies, Vol. 12, 2003, pp. 431-437.
[16] O. Burkhan and I. M. Kolesnikov, “Characteristics of the
Change in the Properties of Gasoline during Storage,”
Chemistry and Technology of Fuels and Oils, Vol. 43, No.
4, 2007, pp. 290-292. doi:10.1007/s10553-007-0051-5
[17] S. J. Robertson, W. B. McGill, H. B. Massicotte and M. P.
Rutherford, “Petroleum Hydrocarbon Contamination in
Boreal Forest Soils: A Mycorrhizal Ecosystems Perspec-
tive,” Biological Reviews, Vol. 82, No. 2, 2007, pp.
213-240.
[18] R. G. Zytne, “Organic Compounds in Unsaturated Soil,”
School of Engineering, University of Guelph, Guelph
2007.