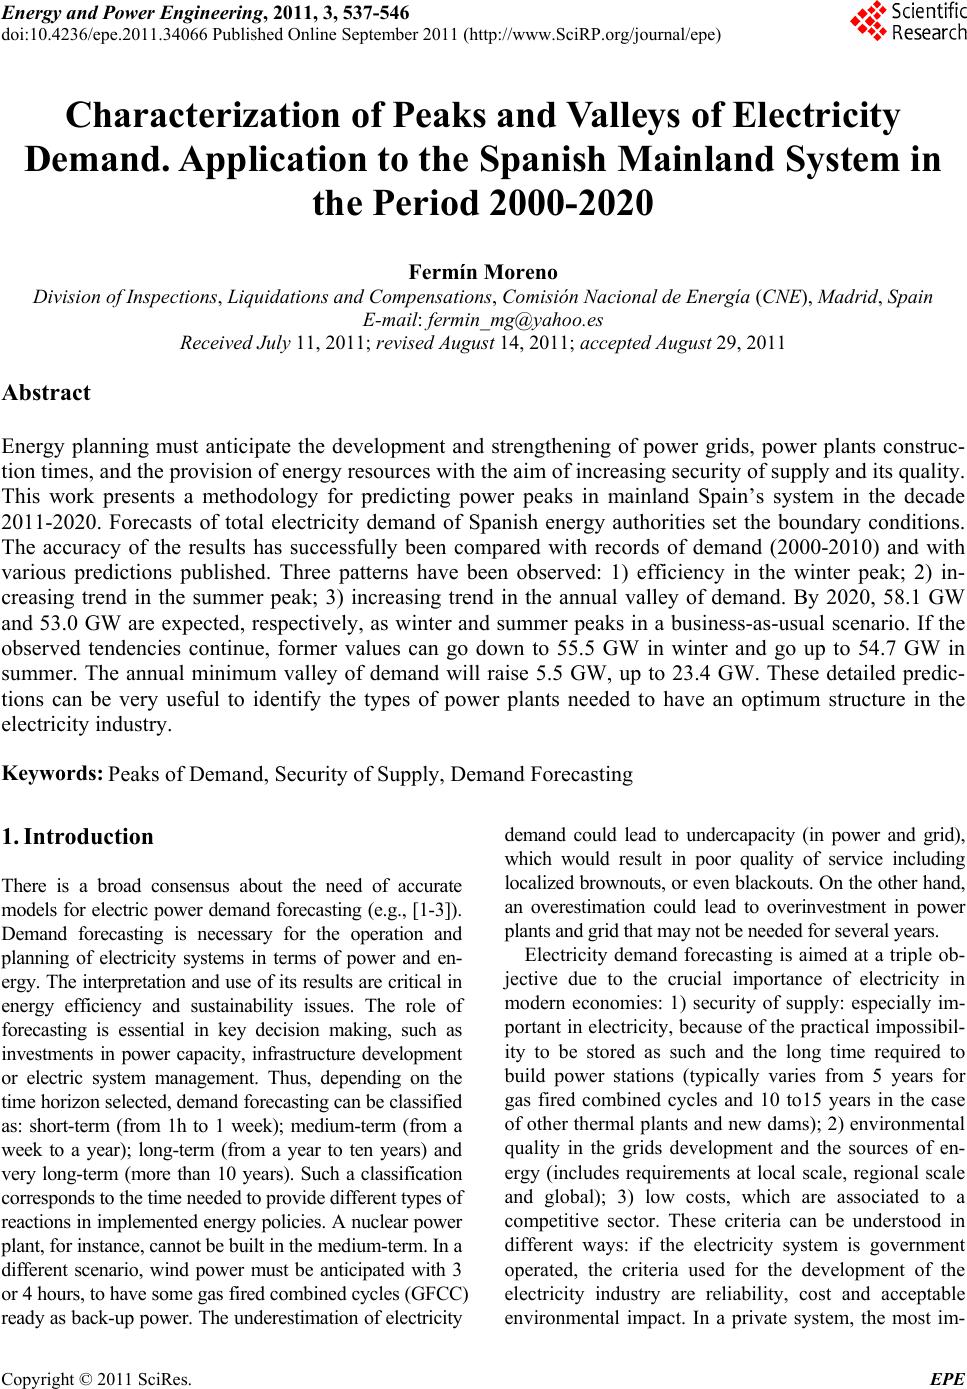
 Energy and Power En gi neering, 2011, 3, 537-546 doi:10.4236/epe.2011.34066 Published Online September 2011 (http://www.SciRP.org/journal/epe) Copyright © 2011 SciRes. EPE Characterization of Peaks and Valleys of Electricity Demand. Application to the Spanish Mainland System in the Period 2000-2020 Fermín Moreno Division of Inspections, Liquidations and Compensations, Comisión Nacional de Energía (CNE), Madrid, Spain E-mail: fermin_mg@yahoo.es Received July 11, 201 1; revised August 14, 2011; accepted August 29, 2011 Abstract Energy planning must anticipate the development and strengthening of power grids, power plants construc- tion times, and the provision of energy resources with the aim of increasing security of supply and its quality. This work presents a methodology for predicting power peaks in mainland Spain’s system in the decade 2011-2020. Forecasts of total electricity demand of Spanish energy authorities set the boundary conditions. The accuracy of the results has successfully been compared with records of demand (2000-2010) and with various predictions published. Three patterns have been observed: 1) efficiency in the winter peak; 2) in- creasing trend in the summer peak; 3) increasing trend in the annual valley of demand. By 2020, 58.1 GW and 53.0 GW are expected, respectively, as winter and summer peaks in a business-as-usual scenario. If the observed tendencies continue, former values can go down to 55.5 GW in winter and go up to 54.7 GW in summer. The annual minimum valley of demand will raise 5.5 GW, up to 23.4 GW. These detailed predic- tions can be very useful to identify the types of power plants needed to have an optimum structure in the electricity industry. Keywords: Peaks of Demand, Security of Supply, Demand Forecasting 1. Introduction There is a broad consensus about the need of accurate models for electric power demand forecasting (e.g., [1-3]). Demand forecasting is necessary for the operation and planning of electricity systems in terms of power and en- ergy. The interpretation and use of its results are critical in energy efficiency and sustainability issues. The role of forecasting is essential in key decision making, such as investments in power capacity, infrastructure development or electric system management. Thus, depending on the time horizon selected, demand forecasting can be classified as: short-term (from 1h to 1 week); medium-term (from a week to a year); long-term (from a year to ten years) and very long-term (more than 10 years). Such a classification corresponds to the time needed to provide different types of reactions in implemented energy policies. A nuclear power plant, for instance, cannot be built in the medium-term. In a different scenario, wind power must be anticipated with 3 or 4 hours, to have some gas fired combined cycles (GFCC) ready as back-up power. The underestimation of electricity demand could lead to undercapacity (in power and grid), which would result in poor quality of service including localized brownouts, or even blackouts. On the other hand, an overestimation could lead to overinvestment in power plants and grid that may not be needed for several years. Electricity demand forecasting is aimed at a triple ob- jective due to the crucial importance of electricity in modern economies: 1) security of supply: especially im- portant in electricity, because of the practical impossibil- ity to be stored as such and the long time required to build power stations (typically varies from 5 years for gas fired combined cycles and 10 to15 years in the case of other thermal plants and new dams); 2) environmental quality in the grids development and the sources of en- ergy (includes requirements at local scale, regional scale and global); 3) low costs, which are associated to a competitive sector. These criteria can be understood in different ways: if the electricity system is government operated, the criteria used for the development of the electricity industry are reliability, cost and acceptable environmental impact. In a private system, the most im- 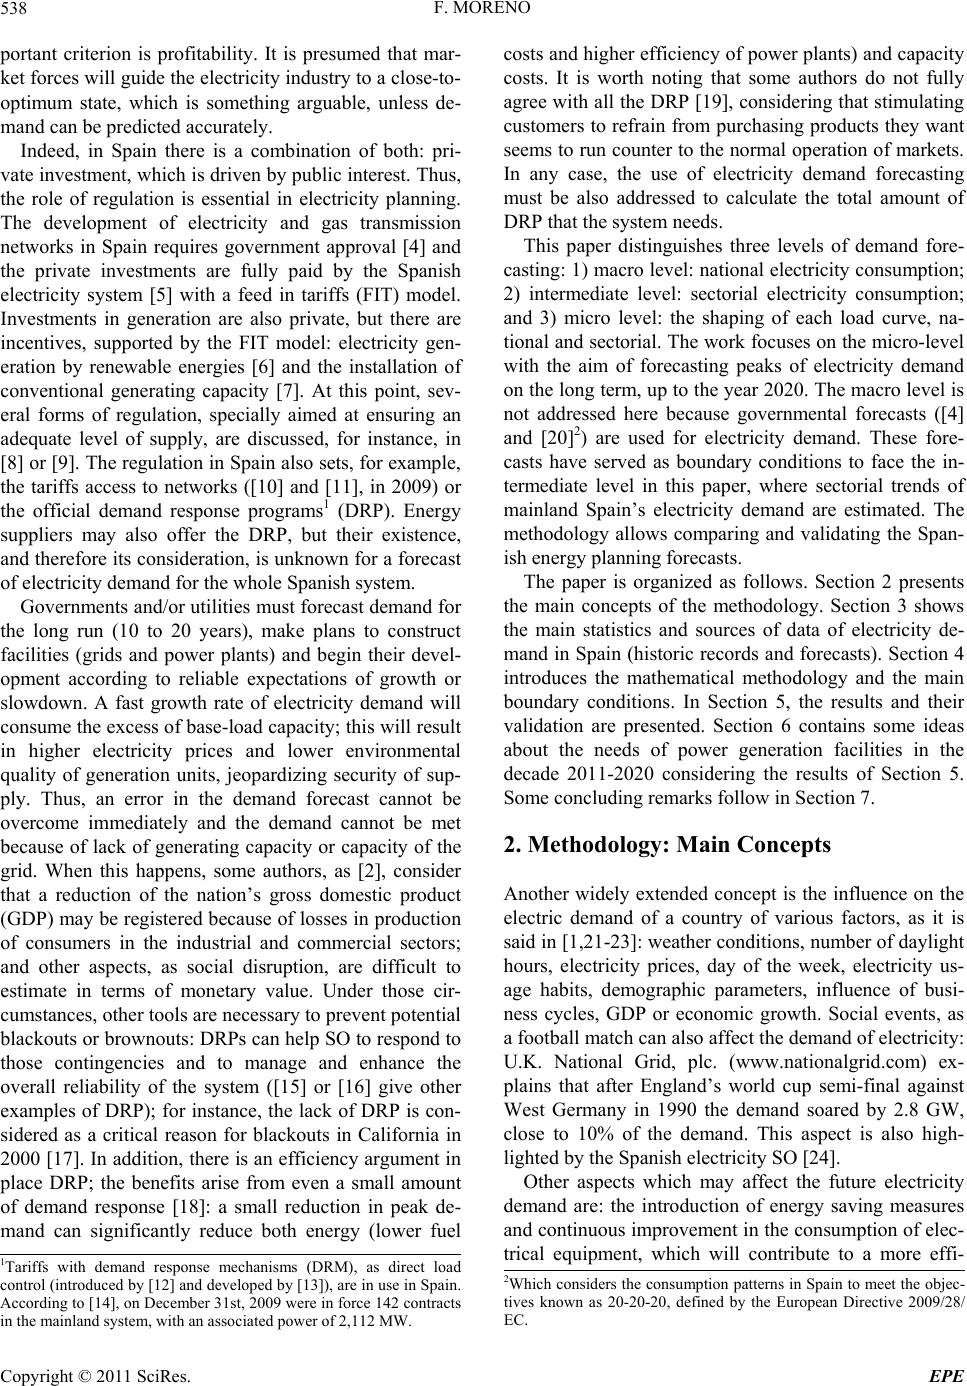 F. MORENO 538 portant criterion is profitability. It is presumed that mar- ket forces will guide the electricity industry to a close-to- optimum state, which is something arguable, unless de- mand can be pr edi c t e d acc u rately. Indeed, in Spain there is a combination of both: pri- vate investment, which is driven by public interest. Thu s, the role of regulation is essential in electricity planning. The development of electricity and gas transmission networks in Spain requires government approval [4] and the private investments are fully paid by the Spanish electricity system [5] with a feed in tariffs (FIT) model. Investments in generation are also private, but there are incentives, supported by the FIT model: electricity gen- eration by renewable energies [6] and the installation of conventional generating capacity [7]. At this point, sev- eral forms of regulation, specially aimed at ensuring an adequate level of supply, are discussed, for instance, in [8] or [9]. The regulation in Spain also sets, for example, the tariffs access to networks ([10] and [11], in 2009) or the official demand response programs1 (DRP). Energy suppliers may also offer the DRP, but their existence, and therefore its consideration, is unknown for a forecast of electricity demand for the whole Spanish system. Governments and/or utilities must forecast demand for the long run (10 to 20 years), make plans to construct facilities (grids and power plants) and begin their devel- opment according to reliable expectations of growth or slowdown. A fast growth rate of electricity demand will consume the excess of base-load capacity; this will result in higher electricity prices and lower environmental quality of generation units, jeopardizing security of sup- ply. Thus, an error in the demand forecast cannot be overcome immediately and the demand cannot be met because of lack of generating capacity or capacity of the grid. When this happens, some authors, as [2], consider that a reduction of the nation’s gross domestic product (GDP) may be registered because of losses in production of consumers in the industrial and commercial sectors; and other aspects, as social disruption, are difficult to estimate in terms of monetary value. Under those cir- cumstances, other tools are necessary to prevent potential blackouts or brownouts: DRPs can help SO to respond to those contingencies and to manage and enhance the overall reliability of the system ([15] or [16] give other examples of DRP); for instance, the lack of DRP is con- sidered as a critical reason for blackouts in California in 2000 [17]. In addition, there is an efficiency argument in place DRP; the benefits arise from even a small amount of demand response [18]: a small reduction in peak de- mand can significantly reduce both energy (lower fuel costs and higher efficiency of power plants) and capacity costs. It is worth noting that some authors do not fully agree with all the DRP [19], considering that stimulating customers to refrain fro m purchasing products they wan t seems to run counter to the normal operation of markets. In any case, the use of electricity demand forecasting must be also addressed to calculate the total amount of DRP that the system needs. This paper distinguishes three levels of demand fore- casting: 1) macro level: national electricity consu mption; 2) intermediate level: sectorial electricity consumption; and 3) micro level: the shaping of each load curve, na- tional and sectorial. The wo rk focuses on the micro-level with the aim of forecasting peaks of electricity demand on the long term, up to the year 2020 . The macro level is not addressed here because governmental forecasts ([4] and [20]2) are used for electricity demand. These fore- casts have served as boundary conditions to face the in- termediate level in this paper, where sectorial trends of mainland Spain’s electricity demand are estimated. The methodology allows comparing and validating the Span- ish energy planning forecasts. The paper is organized as follows. Section 2 presents the main concepts of the methodology. Section 3 shows the main statistics and sources of data of electricity de- mand in Spain (historic records and forecasts). Section 4 introduces the mathematical methodology and the main boundary conditions. In Section 5, the results and their validation are presented. Section 6 contains some ideas about the needs of power generation facilities in the decade 2011-2020 considering the results of Section 5. Some concluding remarks follow in Section 7. 2. Methodology: Main Concepts Another widely extended concept is the influence on the electric demand of a country of various factors, as it is said in [1,21-23]: weather cond itions, number of daylight hours, electricity prices, day of the week, electricity us- age habits, demographic parameters, influence of busi- ness cycles, GDP or economic growth. Social events, as a football match can also affect the demand of electricity: U.K. National Grid, plc. (www.nationalgrid.com) ex- plains that after England’s world cup semi-final against West Germany in 1990 the demand soared by 2.8 GW, close to 10% of the demand. This aspect is also high- lighted by the Spa ni s h electricity SO [24]. Other aspects which may affect the future electricity demand are: the introduction of energy saving measures and continuous improvement in the consumption of elec- trical equipment, which will contribute to a more effi- 1Tariffs with demand response mechanisms (DRM), as direct load control (introduced by [12] and developed by [13]), are in use in Spain. According to [14], on December 31st, 2009 were in force 142 contracts in the mainland system, with an associated power of 2,112 MW. 2Which considers the consumption patterns in Spain to meet the objec- tives known as 20-20-20, defined by the European Directive 2009/28/ EC. Copyright © 2011 SciRes. EPE 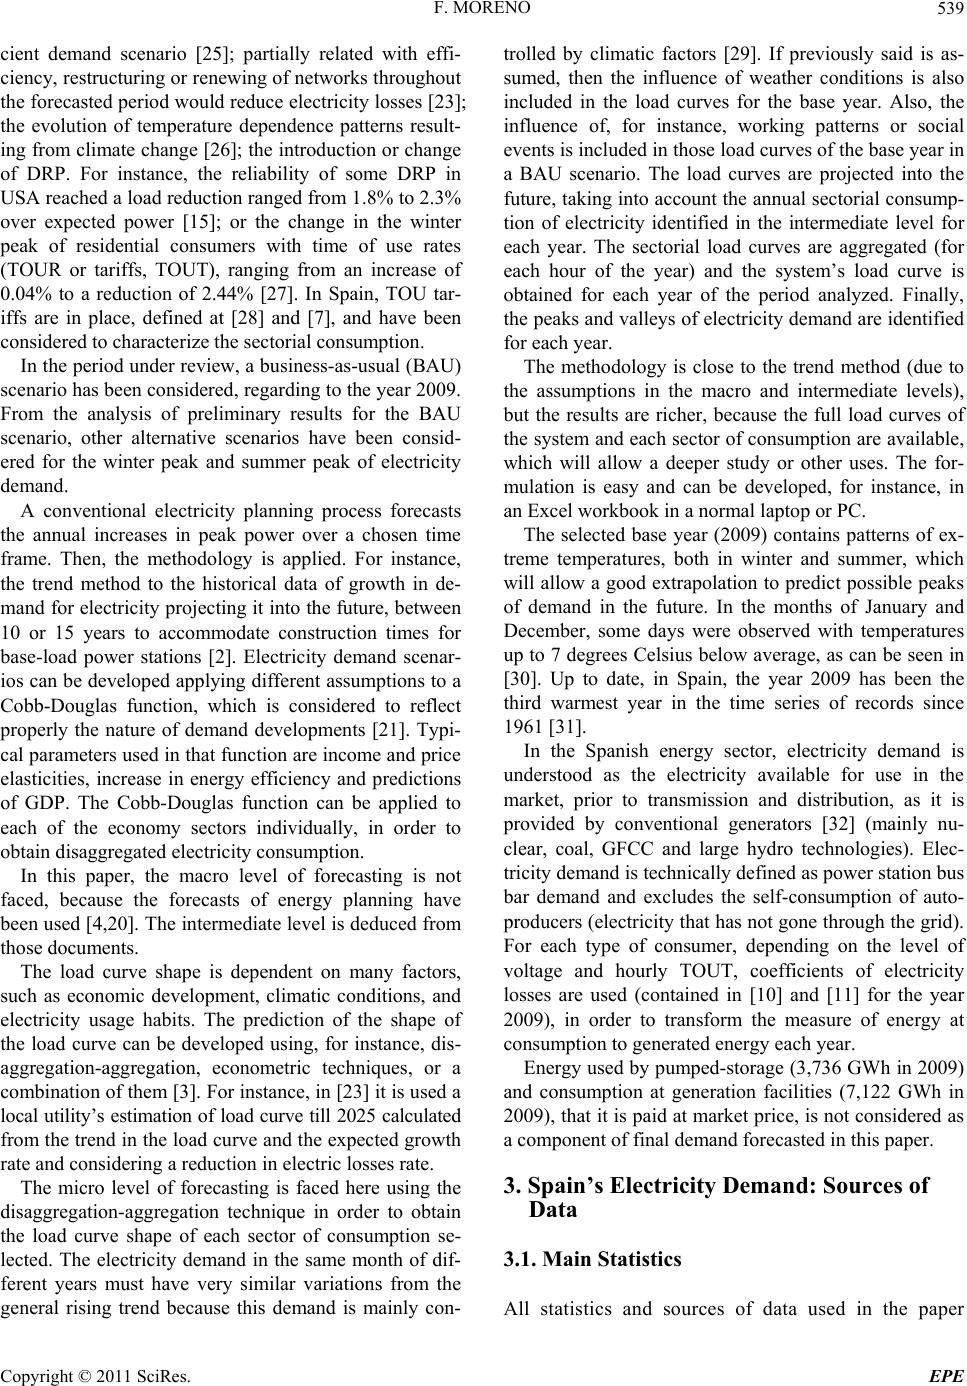 F. MORENO539 cient demand scenario [25]; partially related with effi- ciency, restructuring or renewing of networks throughout the forecasted period would reduce electricity losses [23]; the evolution of temperature dependence patterns result- ing from climate change [26]; the introduction or change of DRP. For instance, the reliability of some DRP in USA reached a load reduction ranged from 1.8% to 2.3% over expected power [15]; or the change in the winter peak of residential consumers with time of use rates (TOUR or tariffs, TOUT), ranging from an increase of 0.04% to a reduction of 2.44% [27]. In Spain, TOU tar- iffs are in place, defined at [28] and [7], and have been considered to characterize t he sec t ori al consumption. In the period under review, a business-as-usual (BAU) scenario has been considered, regarding to the year 2009. From the analysis of preliminary results for the BAU scenario, other alternative scenarios have been consid- ered for the winter peak and summer peak of electricity demand. A conventional electricity planning process forecasts the annual increases in peak power over a chosen time frame. Then, the methodology is applied. For instance, the trend method to the historical data of growth in de- mand for electricity projecting it into the future, between 10 or 15 years to accommodate construction times for base-load power stations [2]. Electricity demand scenar- ios can be developed applying different assumptions to a Cobb-Douglas function, which is considered to reflect properly the nature of demand developments [21]. Typi- cal parameters used in that function are income and price elasticities, increase in energy efficiency and predictions of GDP. The Cobb-Douglas function can be applied to each of the economy sectors individually, in order to obtain disaggregated electricity consumption. In this paper, the macro level of forecasting is not faced, because the forecasts of energy planning have been used [4,20]. The intermediate level is deduced from those documents. The load curve shape is dependent on many factors, such as economic development, climatic conditions, and electricity usage habits. The prediction of the shape of the load curve can be developed using, for instance, dis- aggregation-aggregation, econometric techniques, or a combination of them [3]. For instance, in [23 ] it is used a local utility’s estimation of load curve till 2025 calculated from the trend in the load cu rve and the expected growth rate and considering a reduction in electric losses rate. The micro level of forecasting is faced here using the disaggregation-aggregation technique in order to obtain the load curve shape of each sector of consumption se- lected. The electricity demand in the same month of dif- ferent years must have very similar variations from the general rising trend because this demand is mainly con- trolled by climatic factors [29]. If previously said is as- sumed, then the influence of weather conditions is also included in the load curves for the base year. Also, the influence of, for instance, working patterns or social events is included in those load curves of the base year in a BAU scenario. The load curves are projected into the future, taking into account the annual sectorial consump- tion of electricity identified in the intermediate level for each year. The sectorial load curves are aggregated (for each hour of the year) and the system’s load curve is obtained for each year of the period analyzed. Finally, the peaks and valleys of electricity demand are iden tified for each year. The methodology is close to the trend method (due to the assumptions in the macro and intermediate levels), but the results are richer, because the full load curves of the system and each sector of consumption are available, which will allow a deeper study or other uses. The for- mulation is easy and can be developed, for instance, in an Excel workbook in a normal laptop or PC. The selected base year (2009) contains patterns of ex- treme temperatures, both in winter and summer, which will allow a good extrapolation to predict possible peaks of demand in the future. In the months of January and December, some days were observed with temperatures up to 7 degrees Celsius below average, as can be seen in [30]. Up to date, in Spain, the year 2009 has been the third warmest year in the time series of records since 1961 [31]. In the Spanish energy sector, electricity demand is understood as the electricity available for use in the market, prior to transmission and distribution, as it is provided by conventional generators [32] (mainly nu- clear, coal, GFCC and large hydro technologies). Elec- tricity demand is technically defined as power station bus bar demand and excludes the self-consumption of auto- producers (electricity that has not gone through th e grid). For each type of consumer, depending on the level of voltage and hourly TOUT, coefficients of electricity losses are used (contained in [10] and [11] for the year 2009), in order to transform the measure of energy at consumption to generated energy each year. Energy used by pumped-storage (3,73 6 GWh in 2009) and consumption at generation facilities (7,122 GWh in 2009), that it is paid at market pr ice, is not considered as a component of final demand forecasted in this paper. 3. Spain’s Electricity Demand: Sources of Data 3.1. Main Statistics All statistics and sources of data used in the paper Copyright © 2011 SciRes. EPE  F. MORENO 540 come from: Spanish System Operator (www.ree.es, [14] and [33]); National Energy Commission (CNE’s bulle- tins -www.cne.es-); and UNESA (Spanish Association of Electricity Industries) [3 2]. Table 1 shows the evolution of peaks of electricity demand in the decade 2000-2009. These data will be employed as a first validation of the results of the model. Figure 1 shows the evolution of high voltage (HV, voltage greater o equal than 1 kV) demand and low vol- tage (LV) demand in Spain in the decade 2000-2009. In [34] was pointed out that there are robust evidences that both industrial and residential electricity demand have a symmetric distribution for G7 countries. Spain does not belong to G7, but the distribution of demand in Figure 1 shows that the industrial demand (HV) is parallel to the residential plus commercial sector demand (LV). The only exception in the period shown is the year 2009, when industrial demand for electricity was strongly af- fected by the economic crisis. Data from Figure 1 will be used to project the model into the past and compare the results with those records in Table 1. Table 1. Annual evolution of maxima of electr icity demand. Source: [14], [32] and [33]. Peak (MW) Year Winter Summer 2000 31,951 29,363 2001 34,948 31,249 2002 37,274 31,927 2003 37,724 34,537 2004 38,210 36,619 2005 43,378 38,511 2006 42,153 40,275 2007 44,876 39,038 2008 42,961 40,156 2009 44,440 40,226 Figure 1. Structure of electricity supply in Spain and its evolution taking into account voltage (HV and LV). Source: [32], CNE (www.cne.e s) and own calculations. 3.2. Electricity Demand Forecasting in Spain Most of the electricity demand forecasts in Spain are mandatory developed by the SO [35]. Short-term fore- casts are provided by the SO in real-time at its webs (in real-time at https://demanda.ree.es/demanda.html, one week ahead at http://www.esios.ree.es/web-publica/). Some of SO’s forecasts in the medium-term [36] are used as an update of those included at energy planning [4], which are the long-term projections. The available long-term predictions were made before the economic crisis, so that should be considered outdated. Subsequently, with the aim of meeting the obligations undertaken by the Spanish government with the Euro- pean Directive 2009/28/EC (objectives known as 20-20- 20), it has been developed a new planning in the field of renewable energy [20] that includes predictions of en- ergy demand for the period 2011-2020. In the pro- posed scenario, net electricity demand in mainland Spain will raise up from 252.0 GWh in the year 2009, to 330.6 GWh by 2020 (estimated from [20]) for the reference scenario. The renewable energy planning considers all the scenarios with growing energy consumption, both primary and final (opposed to Germany in [25], for ex- ample). On the other hand, the electricity grid losses will be reduced to 8.7% of energy supplied (close to 8.5% lower than those in 2009). 4. Boundary Conditions and Description of the Model Electricity demand forecasts in a BAU scenario and oth- er specific criteria and data listed in [4] and [20] (the energy planning documents) have been taken into ac- count in order to define the intermediate level. For in- stance: demographic evolution; evolution of energy con- sumption at the industrial sector; or the possible massive introduction of electric vehicles (it has been included in the forecast on the basis of the available projections of pilot projects and initiatives, evaluating their progress throughout the pe riod under review, with the criteria and limits of [4]). The residential energy supply has been considered without TOUT, although all the existing electrome- chanical energy meters are supposed to be replaced by 2018, gradually during the analyzed period, by equip- ments with hourly data of energy and remote controlled. This will allow offering DRM to residential consumers, but there is no date, and may change the patterns of residential consumption at peaks of demand, as it is said in [27 ]. There is no record of specific actions in a next future (with the exception of grid losses reduction), in the Copyright © 2011 SciRes. EPE  F. MORENO541 field of energy efficiency, which may notably reduce the electricity consumption of devices and which may require specific simulation. For instance, most of the substitution of incandescent bulbs by energy saving bulbs has just been done in Spain and it is considered in the model. Various sectors of consumption have been different- tiated depending on data availability (with a criterion similar to [24]). The sectors selected are formed by groups of consumers in mainland Spain with similar level of voltage and TOUT. The structure of supply is shown in Figure 2 for the Spanish mainland market in 2009 and the forecasted in the intermediate level by 2020. For each year of the period analyzed, the load curves for those sectors are obtained with (1), collected at [37] and currently used to estimate the load profiles that 18% 22% 7% 32% 4% 17% 2009 17% 21% 8% 32% 4% 18% H V > = 36 kV -TO U 6PHV > = 36 kV -TO U 6P HV < 36 kV -TO U 3PLV wi t hout TO U LV -TOU 2PLV -TOU 3P 2020 Figure 2. Structure of electricity supply in Spain 2009 (up) and forecasted in 2020 (down) taking into account voltage and periods of pricing (P) of TOUT. Source: CNE’s bulle- tins (www.cne.es) and own calculations. will be used for the liquidation of hourly energy meas- ures at the Spanish electricity market. Equation (1) is applied here to those consumers without TOUT (TOUT with 1 period) and TOUT with 2 or 3 periods of pricing (see Figure 2). ,, ,,,, ,,,, ,, 1 m ic mdhjtJT p ci mdhp dt mJ dD mJ mJ i mdh mjdtmjhp dmj PMC MCH P (1) ,,,, ci mdhp: Calculated hourly measure for sectorial consumption “c”, with profile “i”, in the hour “h”, of day “d”, month “m” corresponding to the energy of period “p” recorded by the measurement equipment. i MCH ,,mdh P: Profile for sectorial consumption “i”, month “m”, day “d” and hour “h”, which represents th e rela- tive weight of that hour in the year. It has been ob- tained for the year 2009 from www.ree.es. c ,, , , tJTp MC : Incremental energy measured for cus- tomer “c”, between the day “t” of the month “j” and the day “T” month “J” for the period “p”. The neces- sary information has been obtained or estimated from CNE’s bulletins (www.cne.es). Dm: number of days in month “m”. The hourly electricity demand of the HV segment, with voltage higher than 36 kV and TOU tariffs with 6 periods of pricing, was determined as the average load in each period. Many large industrial consumers have load curves with very little hourly and seasonal varia- tion, so that its characterization in the model should be consid ered includ ed in tha t segment. Finally, for the year 2009, the load curve of the de- mand in HV, with voltage less than 36 kV and TOU tariffs with 6 periods of pricing, was determined by subtrac ting, to the tota l demand, the calcu lated de mand of the other sectors. Finally, it is projected with the results o f the intermedi a te leve l. This consu mp tio n s eg - ment represents large industrial customers with hourly and seasonal variation of load. Additionally, this con- sumption segment absorbs defects of allocation of consumption of the other sectors. Figure 3 shows those curves for the week when the winter peak is registered in 2009. Their aggregation, hour by hour, is the Spanish electricity system’s load curve for that week. 5. Results and Validation The validation of the model has been done comparing projections of peaks of demand in the period 2000-20103 with the data of Table 1. In this way, the fitting of the model to the reality of the Span ish electricity system can 3Some preliminary data of the year 2010 were av ailable. Copyright © 2011 SciRes. EPE  F. MORENO 542 Figure 3. Load curves of each group of consumption (Fig- ure 2). Winter peak week in 2009 (ene = January). Source: Own calculations. be analyzed. The results are shown in Figure 4; they show a similar trend with the records of peaks of demand (Table 1), both in winter (annual) and in summer. The biggest discrepancies in the estimated annual maxima are observed in the periods 2002 and 2005, with a deviation of –4.2% and –2.9% respectively, and with a tendency to reduce the deficit with the proximity to the base period (Figure 5). The trend in the difference between the estimated peak and annual peak of demand may be justified by the introduction of efficiency measures reducing the energy needs in the winter maximum. Another reason fo r th is trend may lie in the gradual disappearance of the regulated tariffs for industrial consumers (tariffs that ensured a maximum price of energy and were fixed by the government), a process that ended in 2008. This ef- fect was parallel to the contracting of supply of these consumers with free agents, paying a higher price for energy at peak than the price they paid for the former regulated tariffs, forcing them to optimize their processes and displacing consumption to valley hours, if it was possible. The largest discrepancy in the estimation of summer peak corresponds to the year s 2006 and 2010, –0 .7% and Figure 4. Annual evolution of maxima of electricity demand in winter and in summer compared with the estimations of the model for the same period. Source: [4], [14], [33] y [36] and own calculations. Figure 5. Deviation of the outputs of the model versus the winter and summer peaks of demand observed in the pe- riod 2000-2010. Source: Own calculations. –1.0%, respectively ( Figure 5). The trend of th e summer deficit is reversed to that observed with the annual peak of demand. The reasoning may come from the growing use of cooling equipment in the summer, which does not seem to have yet reached the saturation point (for in- stance, this tendency has been po inted out in [26] fo r The Nederlands). Although, in general, the outputs are satisfactory, the goodness of the results will depend on climatic patterns in the base year (2009). Other factors to take into account for future demand forecasts are, for instance, effective efficiency measures, extension of RTP or massive in troduction of TOU tariffs in the residential sector. Future improvements on these matters may be included in the model. The introduction of some corrections in the model must be considered in order to estimate correctly the summer peak of demand. The most desirable would be the introduction of patterns of consumption by end use because of the rising electricity demand for cooling. That action would correct the natural tendency of the model in this case, the underestimation, but requires further study. This trend in the summer peak could be reversed or sta- bilized by the introduction of appropriate measures and/or patterns of energy efficiency. Figure 6 shows the results of peaks of electricity de- mand and those included in [4] and [36], all of them re- lated to the scenario of annual electricity demand used in Copyright © 2011 SciRes. EPE  F. MORENO543 Figure 6. Outputs of the model compared with in [4] and [36] forecasts related to the annual demand of electricity. the forecasting. The tendencies observed in Figure 5 for the annual (winter) peak and the summer peak, are in- cluded in Figure 6, correcting the results of the model: along the period analyzed, a progressive decline of 4% for the winter peak and a progressive increase of 3% at the peak of summer have been considered. By 2020, 58.1 GW and 53.0 GW are expected, respectively, as winter and summer peaks in a BAU scenario. If the observed tendencies continue, former values can go down to 55.5 GW in winter and go up to 54.7 GW in summer. Another application of the methodology is the fore- casting of minimum demand of mainland Spain’s elec- tricity system. That would allow plann ing in advance the need for base power required for continuous operation most of the 8760 hours of a year. Results have been compared with historical records of minimum electricity demand throughout the period 2003-2010 (less data are available for the valley of demand). For the decade 2011-2020 forecasts of minima of demand have not been found. The minima of electricity demand are also related to working patterns and temperature patterns, and also have a strong dependence on the economic cycle (the mini- mum of electricity demand in 2009, 17.9 GW, represents a decline of 6.1% over that in 2008, something con- firmed by the model’s outputs; this decline is due, almost totally, to the reduction in industrial demand). By the year 2020, the annual valley of demand will rise 5.5 GW (compared to minimum of demand of the base year), up to 23.4 GW. The relocation of consumption from the efficiency trend at winter peak may involve an increase of the valley; this aspect requires further study and the redistribution of the shape of the load curve (the term “” in (1). ,, The comparison of annual minima of electricity de- mand with historical data for the period 2003-2010 shows interesting results (Figure 7). The outputs fit finely with those years close to the base year. For the rest of the period (from 2003 to 2007), a downward trend of overestimation is observed, which can be ascribed to an improvement in consumption patterns of industries (per- haps they have moved a part of their consumption to off-peak hours, more economical because they are sup- plied under TOU tariffs). i mdh P Another reason for that trend may also lie in the grad- ual disappearance of the regulated tariffs for industrial consumers as it has previously been said for the trend of the winter peak. In any case, both explanations would be directly associated with the tendency which has previ- ously been called as “efficiency” when the peaks of de- mand were desc ri bed. A study referred in [38], looking at 87 large Spanish customers supplied with TOU tariffs, revealed that re- ducing production to make savings on their electricity bill was not profitable for industrial customers. The trends observed in the winter peak and in the annual minimum of demand may contradict that study, and con- firm for the Spanish electricity system the ideas ex- pressed in [39]: customers will respond to higher prices of electricity by purchasing more efficient appliances and taking other efficiency measures. 6. Aplication to the Spanish Energy Sector in the Decade 2011-2020 Along the period 2011-2020, the Spanish energy sector will face an ambitious renewable energy deployment [20]. As objectives for 2020, 38.0 GW of wind power, Figure 7. Minima of electricity demand in the decade 2000-2010; results for the period 2000-2020; and deviation for the period 2003-2010. Source: REE (www.ree.es/opera- cion/simel.asp) and own calculations. Copyright © 2011 SciRes. EPE  F. MORENO 544 more than 8.3 GW of photovoltaic and 5.0 GW of con- centrated solar-thermal may be installed. In addition, close to 3.5 GW of new power in combined heat and power (CHP) are expected by 2020. Renewable energies offer a limited contribution to se- curity of supply from the point of view that it is impossi- ble to guarantee they will work at a certain power a cer- tain date. Therefore, the fo recasting in electricity systems with a high penetration of renewable energy must in- clude both, electricity demand and renewable generation in order to meet properly demand and generation It must be noted that renewable energy plants (with the very minor exception of solar thermal units with th ermal energy storage) are unable to contribute to stabilization and regulation of the electric systems, because they can not be fully governed. The back-up power for renewables is going to be a critical point for the security of supply and the quality of supply. From the point of view of finding a suitable type of plant for backing-up the de- ployment of main renewable energies (wind and solar), GFCC seem to be the best choice, for a number of rea- sons: 1) technical flexibility to increase power at a fast speed if they are already working over the technical minimum; 2) short construction times; 3) actually the lowest specific investment cost. On the contrary, there are some negative effects that must be cited: 1) short number of working hours, which is a drawback for re- covering the investment; 2) dependence on the gas price, which is the main component of the variable cost; and 3) the high number of start-up s (up to 100 or more in a year) that means a lower efficiency for GFCC, greater need of maintenance and reduction of the life time of many components. By 2020, in a BAU scenario of generation of renew- ables and CHP at peak of demand, may be needed 8-9 GW of additional power (related to the base year). The growing expectations for the minimum of elec- tricity demand (5.5 GW) may require installation of new base load power plants. In a BAU scenario at valley of demand, the new power of CHP and manageable renew- ables (for instance, biomass) would only cover a third of that increase. GFCC are also suitable for base load op- eration because of the good efficiency rate, but as a negative aspect, they have high and volatile operating costs related with natural gas price. Coal and nuclear power plants may also be economically competitive at base load working. They are less able to regulate load and they have longer periods of construction, but as an advantage, they usually have lower operating costs. No- wadays in Spain, coal plants work as backup power for renewables with a low load factor (34% in 2009) and lots of starts-ups and stops per year. Nuclear power plants operate continuously (except for refuelling and mainte- nance) as the base of the system, and operate without power reduction even if the demand is too low for the total power available of renewables plus nuclear. Existing coal power plants in Spain may assume a part of the minimum demand growth, as base load facilities, without investing in new infrastructure (at least in the medium-term), if GFCC are used as backup power of renewables because of their better technical fit for that role. Taking into account the low load factor of coal plants and combined cycles (in 2009), the expected growth of the minimum of electricity demand until the year 2020 and the planned deployment of renewables, it does not seem necessary investing on base load power plants, such as nuclear power plants. However, if in the decade 2021-2030 the forecasts of growth for the minimum of electricity demand continue, the installation of this type of unit, with high power per group (up to 1.5 GW each nuclear plant) might be considered in order to reduce operating costs of base load generation in the Spanish electricity system. Environmental and social aspects may also be consid- ered in the choice of generation technologies, for base load generation, to meet peaks of demand or as a backup power for renewable energy. 7. Summary and Future Work This paper presents a methodology for estimating peaks of electricity demand. It has been validated by comparing its outputs with historical records of demand (peak and valley) in the period 2000-2010 and with available fore- casts since 2011. The results of both comparisons have been satisfactory. The maximum discrepancy in the forecast, compared to historical records, is 4.2% (under- estimation) in the winter peak of the year 2005. This dif- ference may be attributable to more extreme temperature patterns in that year than those observed in the base pe- riod. It has also been observed a possible tendency to the reduction of the winter maximum of demand driven by the introduction of efficiency patterns. The observed tendency to overestimate the valley of demand in the period 2003-20 10, which is redu ced for those years clos e to the base year, may confirm the relocation of demand from peak hour to off-peak hours. These trends may lie on two reasons: the first one, an efficient use of the TOU tariffs by high voltage consumers; the second one, the end of the liberalization process of electricity in Spain for high voltage consumers, which concludes in 2008. With regard to the summer peak of demand, the maxi- mum discrepancy predicted by the model stands at 1.7% in the period 2010. The explanation for this discrepancy in the forecast may also lie in the temperature patterns. In Copyright © 2011 SciRes. EPE  F. MORENO545 any case, there has also been observed a trend toward increase in the summer peak of demand compared to the values estimated, which seems related to a growing de- mand for cool ing. By 2020, 58.1 GW and 53.0 GW are expected, re- specttively, as winter and summer peaks in a busi- ness-as-usual scenario. If the observed tendencies con- tinue, former values can go down to 55.5 GW in winter and go up to 54.7 GW in summer. If both trends are con- firmed and the trend in the summer peak is not corrected, by the year 2022, the summer peak may be close to the winter one and both seasons will beco me critical periods for electricity demand. The valley of annual demand may increase 5.5 GW (related to the base year) up to 23.4 GW in a BAU scenario. The trends highlighted in this paper, deserve a further study to be addressed in future works. Detailed predictions of this analysis can be very useful to identify the types of power plants needed to have an optimum structure in the electricity industry. As a prac- tical application of this study on mainland Spain’s elec- tricity system, it can be said that in th e decad e 2011-2020 no new power plants would be needed for base load op- eration because the existing coal power plants may as- sume that role, although this policy would not comply with the objective of reducing CO2 emissions, but it would be the cheapest one. It goes without saying that life extension of nuclear power plants has already been assumed as part of the principles of the electricity Indus- try in some countries; others, as Germany, are discussing the shutdown of nuclear power by 2022, as a cones- quence of the nuclear incident at Fukusima, after the tsunami on the 5th of March of 2011. However, due to the limited contribu tion of renewables to security of sup - ply, 8 - 9 GW of additional power will be needed in Spain to meet peak demand with a safety margin similar to that registered in the base year. Environmental and social aspects may also be considered in the choice of generation technologies, for base load generation, to meet peaks of demand or as a backup power for renew- able energy. 8. Acknowledgements Guidance of Prof. J.M. Martínez-Val, from ETSII-UPM, is highly recognized. The help from CNE’s staff is also gratefully acknowledged. 9. References [1] C. García-Ascanio and C. Maté, “Electric Power Demand Forecasting Using Interval Time Series: A Comparison between VAR and iMLP,” Energy Policy, Vol. 38, No. 2, 2010, pp. 715-725. doi:10.1016/j.enpol.2009.10.007 [2] W. Soontornrangson, D. G. Evans, R. J. Fullerc and D. F. Stewart, “Scenario Planning for Electricity Supply,” En- ergy Policy, Vol. 31, No. 15, 2003, pp. 1647-1659. doi:10.1016/S0301-4215(02)00231-8 [3] M. Mehra and A. Bharadwaj, “Demand Forecasting for Electricity. Tata Energy Research Institute, New Delhi, India,” Proceedings of the National Conference on Regu- lation in Infrastructure Services: Progress and Way For- ward, New Delhi, 14-15 November 2000. [4] Spanish Industry Office, “Planning of electricity and gas 2008-2016. Development of transmission networks”, 2008. http://www.mityc.es/energia/planificacion/Planificacionel ectricidadygas/Desarrollo2008/DocTransportes/planifi- cacion2008_2016.pdf [5] Spanish Industry Office, “Royal Decree 325/2008 and Royal Decree 326/2008, Februa ry 29th, 2008”. Spain’s Of- ficial Journal, BOE No. 55, March 4th, 2008, pp. 13079- 13091. http://www.boe.es/boe/dias/2011/02/25/pdfs/BOE-A-2011 -3693.pdf [6] Spanish Industry Office, “Royal Decree 661/2007, May 25th, 2007”. Spain’s Official Journal, BOE No. 126, May, 26th, 2007, pp. 22846-22886. http://www.boe.es/boe/dias/2007/05/26/pdfs/A22846-228 86.pdf [7] Spanish Industry Office, “Order ITC/2794/2007, Sep- tember 27th, 2007”. Spain’s Official Journal, BOE No. 234, September 29th, 2007, pp. 39690-39698. http://www.boe.es/boe/dias/2007/09/29/pdfs/A39690-396 98.pdf [8] F. Castro-Rodríguez, P. L. Marín and G. Siotis, “Capacity Choices in Liberalized Electricity Markets,” Energy Pol- icy, Vol. 37, No. 7, 2009, pp. 2574-2581. doi:10.1016/j.enpol.2009.01.038 [9] L. de Vries and P. Heijnen, “The Impact of Electricity Market Design upon Investment under Uncertainty: The Effectiveness of Capacity Mechanisms,” Utilities Policy, Vol. 16, No 3, 2008, 215-227. doi:10.1016/j.jup.2007.12.002 [10] Spanish Industry Office, “Order ITC/3801/ 2008, De- cember 26th, 2008”. Spain’s Official Journal, BOE No. 315, December 31st, 2008, pp. 52672-52685. http://www.boe.es/boe/dias/2008/12/31/pdfs/A52672-526 85.pdf [11] Spanish Industry Office, “Order ITC/1723/2009, June 26th, 2009”. Spain’s Official Journal, BOE No. 156, June 29th, 2009, pp. 53812-53821. http://www.boe.es/boe/dias/2009/06/29/pdfs/BOE-A-200 9-10670.pdf [12] Spanish Industry Office, “Royal Decree 1634/2006, De- cember 29th, 2006”. Spain’s Official Journal, BOE No. 312, December 30th, 2006, pp. 46656-46679. http://www.boe.es/boe/dias/2006/12/30/pdfs/A46656-466 79.pdf [13] Spanish Industry Office, “Order ITC/2370/2007, July 26th, 2009”. Spain’s Official Journal, BOE No. 185, Au- gust 3rd, 2007, pp. 33442-33451. www.boe.es/boe/dias/2007/08/03/pdfs/A33442-33451.pdf Copyright © 2011 SciRes. EPE  F. MORENO Copyright © 2011 SciRes. EPE 546 [14] Spanish Electricity System Operator (Red Eléctrica de España, S.A.), “Spanish electricity system 09”, 2010. http://www.ree.es/sistema_electrico/pdf/infosis/Inf_Sis_E lec_REE_2009.pdf [15] N. Hopper, C. Goldman, R. Bharvirkar and D. Engel, “The Summer of 2006: A Milestone in the Ongoing Maturation of Demand Response,” The Electricity Jour- nal, Vol. 20, No. 5, 2007, pp. 62-75. doi:10.1016/j.tej.2007.04.007 [16] H.-P. Chao, “Price-Responsive Demand Management for a Smart Grid World,” The Electricity Journal, Vol. 23, No. 1, 2010, pp. 7-20. doi:10.1016/j.tej.2009.12.007 [17] H. Fraser, “The Importance of an Active Demand Side in the Electricity Industry,” The Electricit y Journal, Vol. 14, No. 9, 2001, pp. 52-73. doi:10.1016/S1040-6190(01)00249-4 [18] A. Sheffrin, H. Yoshimura, D. LaPlante and B. Neenan, “Harnessing the Power of Demand,” The Electricity Journal, Vol. 21, No. 2, 2008, pp. 39-50. doi:10.1016/j.tej.2008.02.002 [19] C. Rochlin, “The Alchemy of Demand Response: Turn- ing Demand into Supply,” The Electricity Journal, Vol. 22, No. 9, 2009, pp. 10-25. doi:10.1016/j.tej.2009.09.004 [20] Spanish Institute for Energy Diversification and Saving (IDAE) “National Action Plan for Renewable Energy in Spain (PANER) 2011-2020”, 2010. http://www.idae.es/index.php/mod.documentos/mem.desc arga?file=/documentos_20100630_PANER_Espana_vers ion_final_[1]_cdb842de.pdf [21] C. von Hirschhausen and M. Andres, “Long-Term Elec- tricity Demand in China—From Quantitative to Quali- tative Growth?” Energy Policy, Vol. 28, No. 4, 2000, pp. 231-241. doi:10.1016/S0301-4215(00)00014-8 [22] R. Mamlook, O. Badran and E. Abdulhadi, “A Fuzzy In- Ference Model for Short-Term Load Forecasting,” En- ergy Policy, Vol. 37, No. 4, 2009, pp. 1239-1248. doi:10.1016/j.enpol.2008.10.051 [23] J.-S. Huang and J.-H. Wu, “A Portfolio Risk Analysis on Electricity Supply Planning,” Energy Policy, Vol. 36, No. 2, 2008, pp. 627-641. doi:10.1016/j.enpol.2007.10.004 [24] Spanish Electricity System Operator (Red Eléctrica de España, S.A.), “INDEL Project. Atlas of Spanish elec- tricity demand, 1998. http://www.ree.es/sistema_electrico/pdf/indel/atlas_indel _ree.pdf. [25] D. Keles, D. Möst and W. Fichtner, “The Development of the German Energy Market until 2030-A Critical Survey of Selected Scenarios,” Energy Policy, Vol. 39, No. 2, 2011, pp. 812-825. doi:10.1016/j.enpol.2010.10.055 [26] M. Hekkenberg, R. M. J. Benders, H. C. Moll and A. J. M. S. Uiterkamp, “Indications for a Changing Electricity Demand Pattern: The Temperature Dependence of Elec- tricity Demand in the Netherlands,” Energy Policy, Vol. 37, No. 4, 2009, pp. 1542-1551. doi:10.1016/j.enpol.2008.12.030 [27] D. C. Mountain and E. L. Lawson, “Some Initial Evi- dence of Canadian Responsiveness to Time-of-Use Elec- tricity Rates: Detailed Daily and Monthly Analysis,” Re- source and Energy Economics, Vol. 17, No. 2, 1995, pp. 189-212. doi:10.1016/0928-7655(94)00025-F [28] Spanish Industry Office, “Royal Decree 1164/2001, Oc- tober 26th, 2001”. Spain’s Official Journal, BOE No. 268, November 8th, 2001, pp. 40618-40629. http://www.boe.es/boe/dias/2001/11/08/pdfs/A40618-406 29.pdf [29] E. González-Romera, M. A. Jaramillo-Maron and D. Carmona-Fernández, “Forecasting of the Electric Energy Demand Trend and Monthly Fluctuation with Neural Net- Work,” Computers and Industrial Engineering, Vol. 52, No. 3, 2007, pp. 336-343. doi:10.1016/j.cie.2006.12.010 [30] Spanish Gas System Operator (ENAGAS), “The Spanish gas sytem. 2009 report”, 2010. http://www.enagas.es/cs/Satellite?blobcol=urldata&blobh eader=application%2Fpdf&blobkey=id&blobtable=Mung oBlobs&blobwhere=1146251952834&ssbinary=true. [31] National Meteorological Agency, “2009, the Third Warm- est Year”, 2010. http://www.aemet.es/en/noticias/2009/12/avanceclima09 [32] Spanish Association of Electricity Industries (UNESA), “Electricity Report—Activity Report—Statistical Report 2009 http://www.unesa.es/documentos_biblioteca/memoria_est adistica/cap_0_2008.pdf. [33] Spanish Electricity System Operator (Red Eléctrica de España, S.A.), “Spanish Electricity System. Advance of 2010 Report”, 2010. http://www.ree.es/sistema_electrico/pdf/infosis/Avance_ REE_2010.pdf [34] P. Narayan and S. Popp, “Can the Electricity Market be Characterised by Asymmetric Behaviour?” Energy Policy, Vol. 37, No. 11, 2009, pp. 4364-4372. doi:10.1016/j.enpol.2009.05.051 [35] Spanish Secretary of State for Energy, Industrial Devel- opment and Small and Medium Enterprises, “Resolution, March 17th, 2004”. Spain’s Official Journal, BOE No. 92, April 16th, 2004, pp. 15890-15916. http://www.boe.es/boe/dias/2004/04/16/pdfs/A15890-159 16.pdf [36] Spanish National Energy Comission, “Informe Marco Sobre la Demanda de Energía Eléctrica y Gas Natural, y su Cobertura”, years 2005, 2009 and 2011.http://www.cne.es [37] Spanish General Directorate of Energy Policy and Mines, “Resolution, December 19th, 2008”. Spain’s Official Journal, BOE No. 314, December 30th, 2009, pp. 52435- 52435. http://www.boe.es/boe/dias/2008/12/30/pdfs/A52435-524 35.pdf [38] J. Torriti, M. G. Hassan and M. Leach, “Demand Re- sponse Experience in Europe: Policies, Programmes and Implementation,” Energy, Vol. 35, No. 4, 2009, pp. 1575-1583. doi:10.1016/j.energy.2009.05.021 [39] K. Spees and L. B. Lave, “Demand Response and Elec- tricity Market Efficiency,” The Electricity Journal, Vol. 20, No. 3, 2007, pp. 69-85. doi:10.1016/j.tej.2007.01.006
|