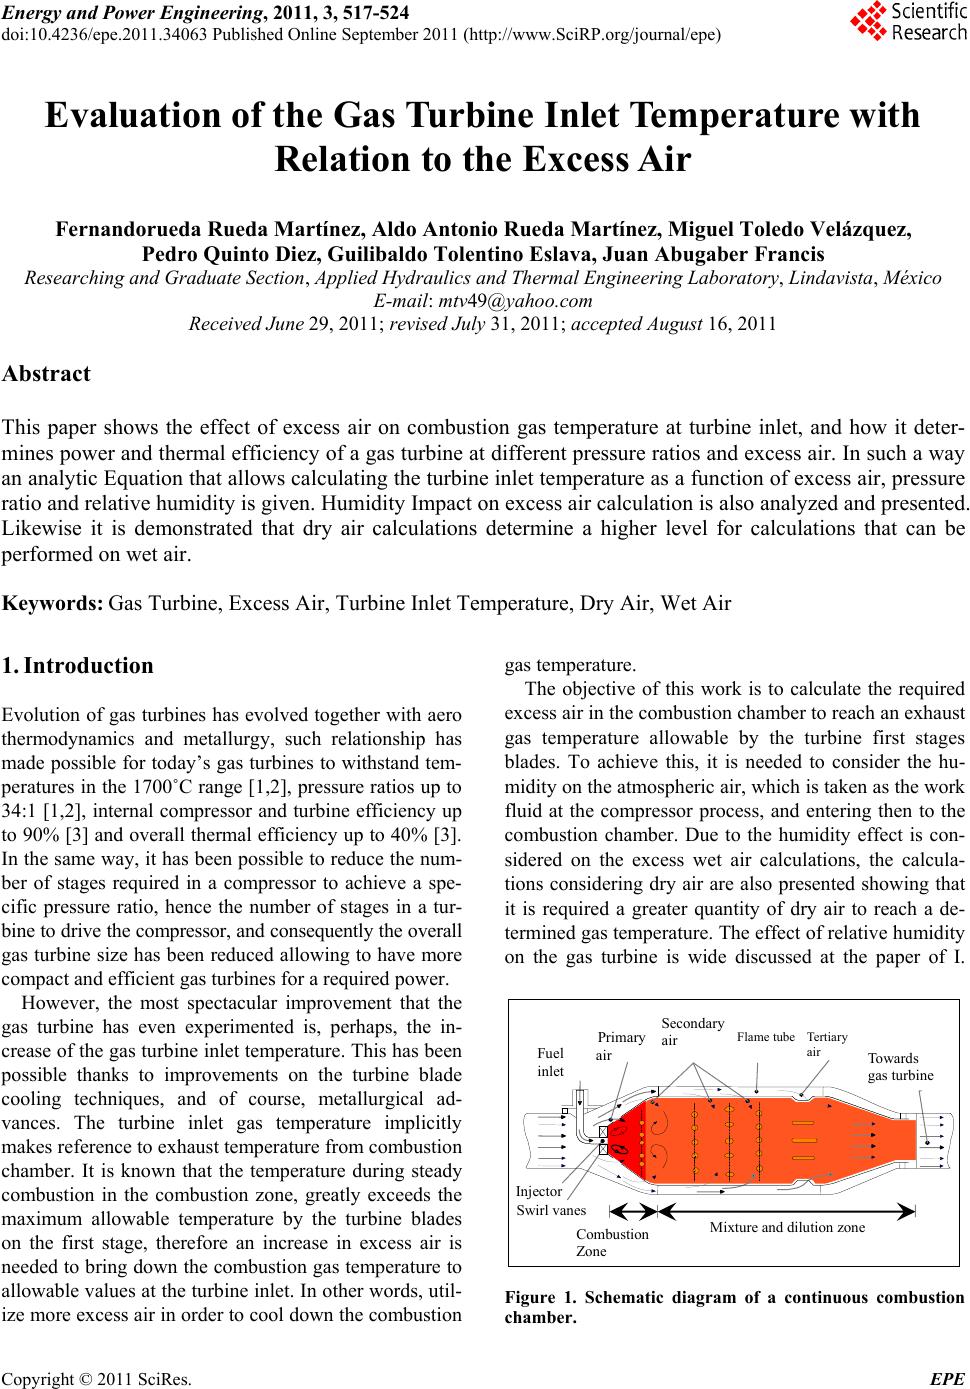
 Energy and Power En gi neering, 2011, 3, 517-524 doi:10.4236/epe.2011.34063 Published Online September 2011 (http://www.SciRP.org/journal/epe) Copyright © 2011 SciRes. EPE Evaluation of the G as Turbine Inlet Temperature wi th Relation to the Excess Air Fernandorueda Rueda Martínez, Aldo Antonio Rueda Martínez, Miguel Toledo Velázquez, Pedro Quinto Diez, Guilibaldo Tolentino Eslava, Juan Abugaber Francis Researching and Graduate Section, Applied Hydraulics and Thermal Engineering Laboratory, Lindavista, México E-mail: mtv49@yahoo.com Received June 29, 2011; revised July 31, 2011; accepted August 16, 2011 Abstract This paper shows the effect of excess air on combustion gas temperature at turbine inlet, and how it deter- mines power and thermal efficiency of a gas turbine at different pressure ratios and excess air. In such a way an analytic Equation that allows calculating the turbine inlet temperature as a function of excess air, pressure ratio and relative humidity is given. Humidity Impact on excess air calculation is also analyzed and presented. Likewise it is demonstrated that dry air calculations determine a higher level for calculations that can be performed on wet air. Keywords: Gas Turbine, Excess Air, Turbine Inlet Temperature, Dry Air, Wet Air 1. Introduction Evolution of gas turbines has evolved together with aero thermodynamics and metallurgy, such relationship has made possible for today’s gas turbines to withstand tem- peratures in the 1700˚C range [1,2], pressure ratios up to 34:1 [1,2], internal compressor and turbine efficiency up to 90% [3] and overall thermal efficiency up to 40% [3]. In the same way, it has been possible to reduce the num- ber of stages required in a compressor to achieve a spe- cific pressure ratio, hence the number of stages in a tur- bine to drive the compressor, and consequently the overall gas turbine size has been reduced allowing to have more compact and efficient gas turbines for a required power. However, the most spectacular improvement that the gas turbine has even experimented is, perhaps, the in- crease of the gas turbine inlet temperature. This has been possible thanks to improvements on the turbine blade cooling techniques, and of course, metallurgical ad- vances. The turbine inlet gas temperature implicitly makes reference to exhaust temperature from combustion chamber. It is known that the temperature during steady combustion in the combustion zone, greatly exceeds the maximum allowable temperature by the turbine blades on the first stage, therefore an increase in excess air is needed to bring down the combustion gas temperature to allowable values at the turbine inlet. In other words, util- ize more excess air in order to cool down the combustion gas temperature. The objective of this work is to calculate the required excess air in the combustion chamber to reach an exhaust gas temperature allowable by the turbine first stages blades. To achieve this, it is needed to consider the hu- midity on the atmospheric air, which is taken as the work fluid at the compressor process, and entering then to the combustion chamber. Due to the humidity effect is con- sidered on the excess wet air calculations, the calcula- tions considering dry air are also presented showing that it is required a greater quantity of dry air to reach a de- termined gas temperature. The effect of relative humidity on the gas turbine is wide discussed at the paper of I. Fuel inlet Injector Swirl vanes Prim ary air Secondary air Tertiary air Flame tube Combustion Zone Mixture and dilution zone Towards gas turbine Figure 1. Schematic diagram of a continuous combustion chamber. 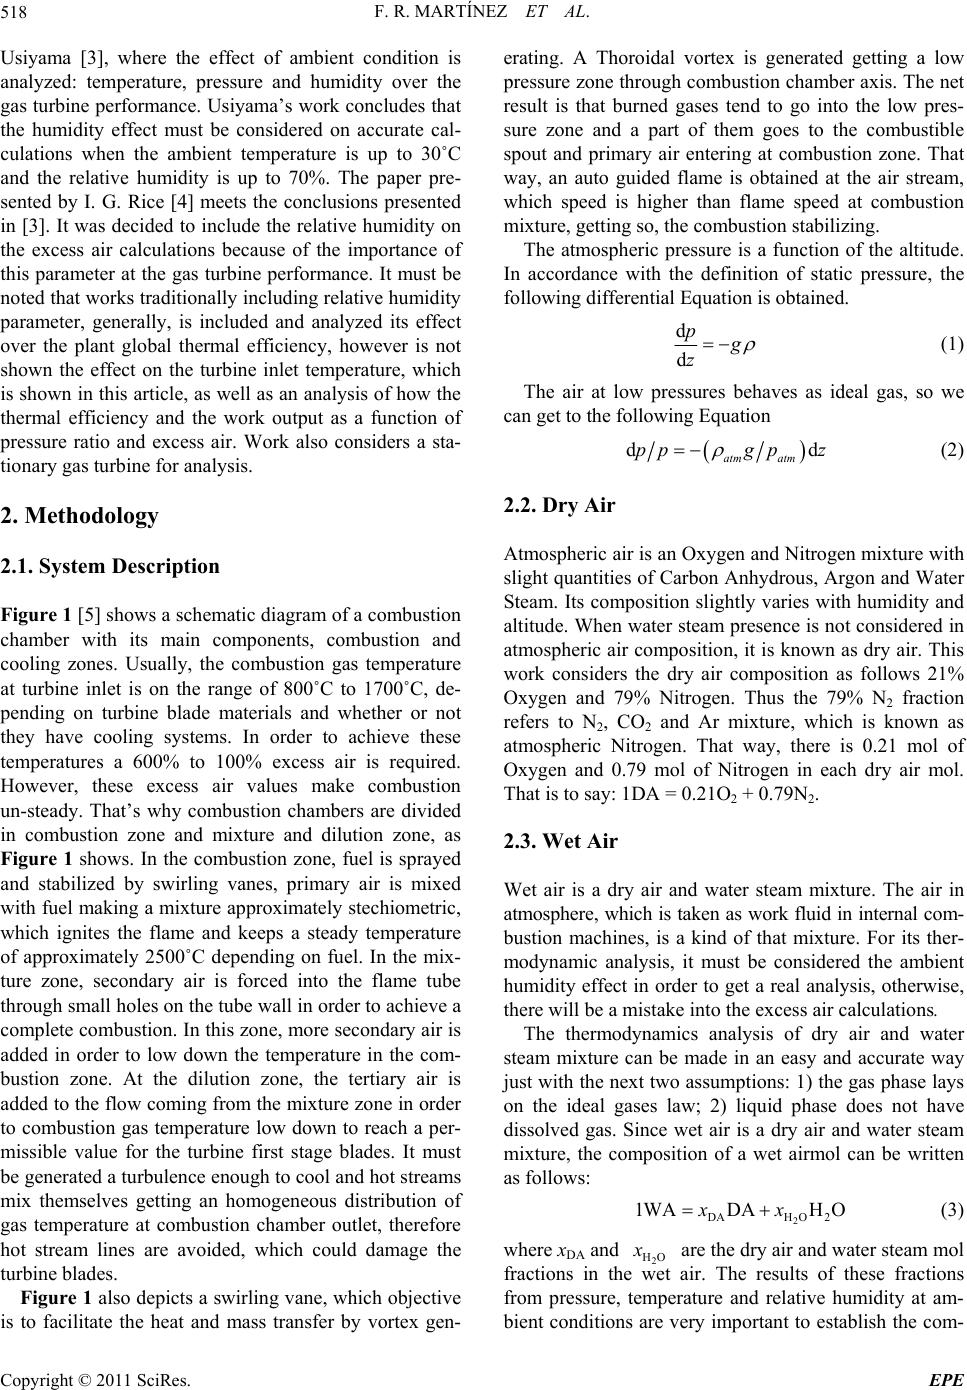 F. R. MARTÍNEZ ET AL. 518 Usiyama [3], where the effect of ambient condition is analyzed: temperature, pressure and humidity over the gas turbine performance. Usiyama’s work concludes that the humidity effect must be considered on accurate cal- culations when the ambient temperature is up to 30˚C and the relative humidity is up to 70%. The paper pre- sented by I. G. Rice [4] meets the conclusions presented in [3]. It was decided to include the relative humidity on the excess air calculations because of the importance of this parameter at the gas turbine performance. It must be noted that works traditionally including relative humidity parameter, generally, is included and analyzed its effect over the plant global thermal efficiency, however is not shown the effect on the turbine inlet temperature, which is shown in this article, as well as an analysis of how the thermal efficiency and the work output as a function of pressure ratio and excess air. Work also considers a sta- tionary gas turbine for analysis. 2. Methodology 2.1. System Description Figure 1 [5] shows a schematic diagram of a combustion chamber with its main components, combustion and cooling zones. Usually, the combustion gas temperature at turbine inlet is on the range of 800˚C to 1700˚C, de- pending on turbine blade materials and whether or not they have cooling systems. In order to achieve these temperatures a 600% to 100% excess air is required. However, these excess air values make combustion un-steady. That’s why combustion chambers are divided in combustion zone and mixture and dilution zone, as Figure 1 shows. In the combustion zone, fuel is sprayed and stabilized by swirling vanes, primary air is mixed with fuel making a mixture approximately stechiometric, which ignites the flame and keeps a steady temperature of approximately 2500˚C depending on fuel. In the mix- ture zone, secondary air is forced into the flame tube through small holes on the tube wall in order to achieve a complete combustion. In this zone, more secondary air is added in order to low down the temperature in the com- bustion zone. At the dilution zone, the tertiary air is added to the flow coming from the mixture zone in order to combustion gas temperature low down to reach a per- missible value for the turbine first stage blades. It must be generated a turbulence enough to cool and hot streams mix themselves getting an homogeneous distribution of gas temperature at combustion chamber outlet, therefore hot stream lines are avoided, which could damage the turbine blades. Figure 1 also depicts a swirling vane, which objective is to facilitate the heat and mass transfer by vortex gen- erating. A Thoroidal vortex is generated getting a low pressure zone through combustion chamber axis. The net result is that burned gases tend to go into the low pres- sure zone and a part of them goes to the combustible spout and primary air entering at combustion zone. That way, an auto guided flame is obtained at the air stream, which speed is higher than flame speed at combustion mixture, getting so, the combustion stabilizing. The atmospheric pressure is a function of the altitude. In accordance with the definition of static pressure, the following differential Equation is obtained. d d p z (1) The air at low pressures behaves as ideal gas, so we can get to the following Equation dd atm atm ppgp z (2) 2.2. Dry Air Atmospheric air is an Oxygen and Nitrogen mixture with slight quantities of Carbon Anhydrous, Argon and Water Steam. Its composition slightly varies with humidity and altitude. When water steam presence is not considered in atmospheric air composition, it is known as dry air. This work considers the dry air composition as follows 21% Oxygen and 79% Nitrogen. Thus the 79% N2 fraction refers to N2, CO2 and Ar mixture, which is known as atmospheric Nitrogen. That way, there is 0.21 mol of Oxygen and 0.79 mol of Nitrogen in each dry air mol. That is to say: 1DA = 0.21O2 + 0.79N2. 2.3. Wet Air Wet air is a dry air and water steam mixture. The air in atmosphere, which is taken as work fluid in internal com- bustion machines, is a kind of that mixture. For its ther- modynamic analysis, it must be considered the ambient humidity effect in order to get a real analysis, otherwise, there will be a mistake into the excess air calculations. The thermodynamics analysis of dry air and water steam mixture can be made in an easy and accurate way just with the next two assumptions: 1) the gas phase lays on the ideal gases law; 2) liquid phase does not have dissolved gas. Since wet air is a dry air and water steam mixture, the composition of a wet airmol can be written as follows: 2 DAH O2 1WADAH Oxx (3) where xDA and 2 HO are the dry air and water steam mol fractions in the wet air. The results of these fractions from pressure, temperature and relative humidity at am- bient conditions are very important to establish the com- Copyright © 2011 SciRes. EPE 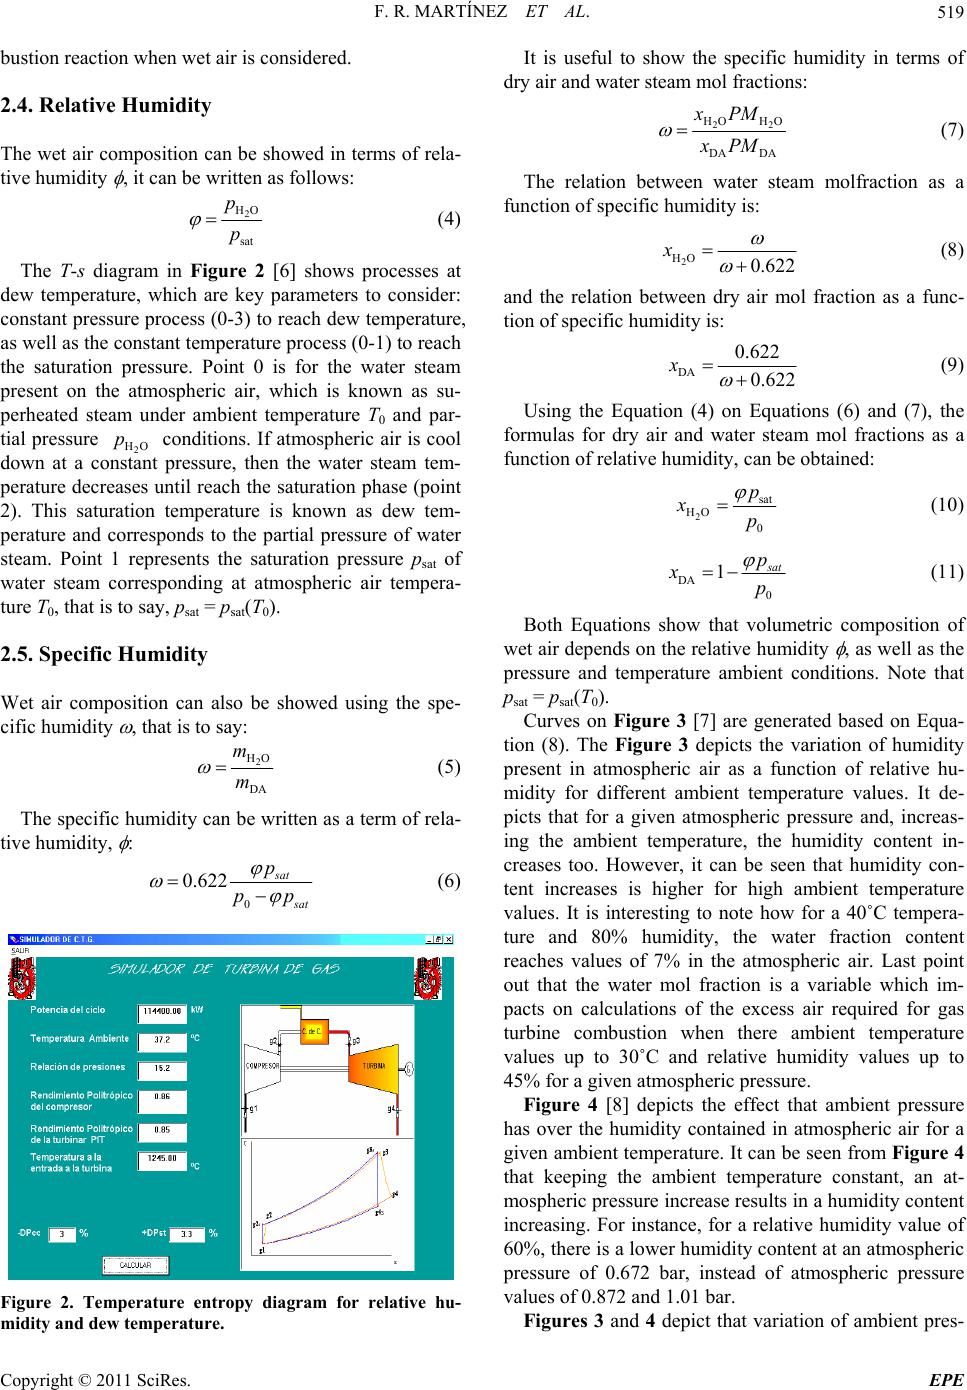 F. R. MARTÍNEZ ET AL.519 bustion reaction when wet air is considered. 2.4. Relative Humidity The wet air composition can be showed in terms of rela- tive humidity , it can be written as follows: 2 HO sat p p (4) The T-s diagram in Figure 2 [6] shows processes at dew temperature, which are key parameters to consider: constant pressure process (0-3) to reach dew temperature, as well as the constant temperature process (0-1) to reach the saturation pressure. Point 0 is for the water steam present on the atmospheric air, which is known as su- perheated steam under ambient temperature T0 and par- tial pressure 2 HO conditions. If atmospheric air is cool down at a constant pressure, then the water steam tem- perature decreases until reach the saturation phase (point 2). This saturation temperature is known as dew tem- perature and corresponds to the partial pressure of water steam. Point 1 represents the saturation pressure psat of water steam corresponding at atmospheric air tempera- ture T0, that is to say, psat = psat(T0). p 2.5. Specific Humidity Wet air composition can also be showed using the spe- cific humidity , that is to say: 2 HO DA m m (5) The specific humidity can be written as a term of rela- tive humidity, : 0 0.622 sat at p pp (6) Figure 2. Temperature entropy diagram for relative hu- midity and dew temperature. It is useful to show the specific humidity in terms of dry air and water steam mol fractions: 2 HO HO DA DA xPM xPM 2 (7) The relation between water steam molfraction as a function of specific humidity is: 2 HO 0.622 x (8) and the relation between dry air mol fraction as a func- tion of specific humidity is: DA 0.622 0.622 x (9) Using the Equation (4) on Equations (6) and (7), the formulas for dry air and water steam mol fractions as a function of relative humidity, can be obtained: 2 sat HO 0 p xp (10) DA 0 1 at p xp (11) Both Equations show that volumetric composition of wet air depends on the relative humidity , as well as the pressure and temperature ambient conditions. Note that psat = psat(T0). Curves on Figure 3 [7] are generated based on Equa- tion (8). The Figure 3 depicts the variation of humidity present in atmospheric air as a function of relative hu- midity for different ambient temperature values. It de- picts that for a given atmospheric pressure and, increas- ing the ambient temperature, the humidity content in- creases too. However, it can be seen that humidity con- tent increases is higher for high ambient temperature values. It is interesting to note how for a 40˚C tempera- ture and 80% humidity, the water fraction content reaches values of 7% in the atmospheric air. Last point out that the water mol fraction is a variable which im- pacts on calculations of the excess air required for gas turbine combustion when there ambient temperature values up to 30˚C and relative humidity values up to 45% for a given atmospheric pressure. Figure 4 [8] depicts the effect that ambient pressure has over the humidity contained in atmospheric air for a given ambient temperature. It can be seen from Figure 4 that keeping the ambient temperature constant, an at- mospheric pressure increase results in a humidity content increasing. For instance, for a relative humidity value of 60%, there is a lower humidity content at an atmospheric pressure of 0.672 bar, instead of atmospheric pressure values of 0.872 and 1.01 bar. Figures 3 and 4 depict that variation of ambient pres- Copyright © 2011 SciRes. EPE 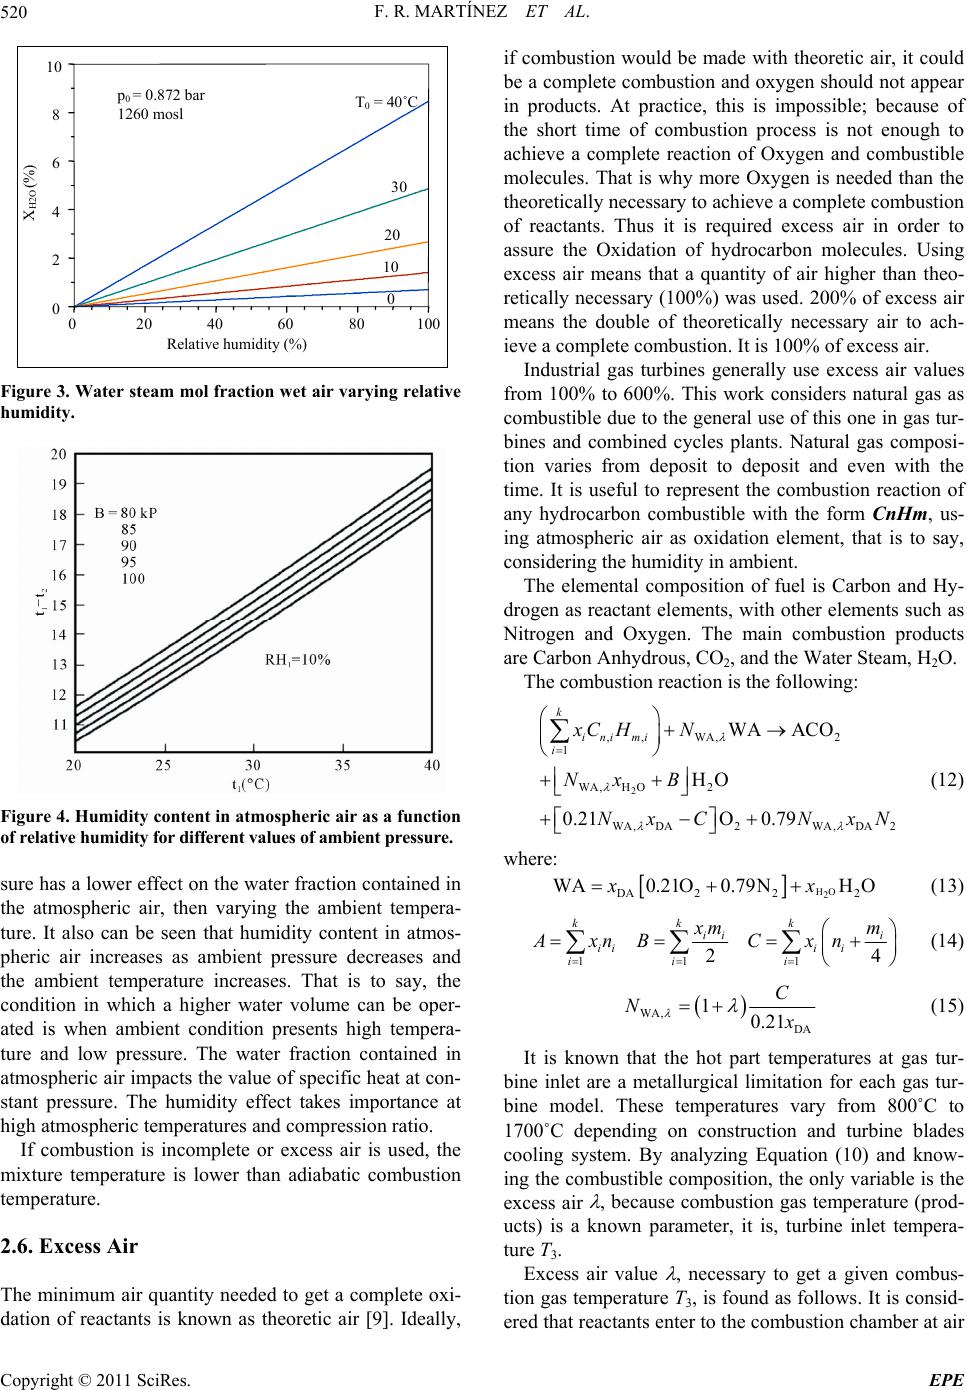 F. R. MARTÍNEZ ET AL. 520 0 20 40 60 80 100 0 2 4 6 8 10 Relative humidity (%) X H2O (%) 0 10 20 30 T 0 = 40˚C p 0 = 0.872 bar 1260 mosl Figure 3. Water steam mol fraction wet air varying relative humidity. Figure 4. Humidity content in atmospheric air as a function of relative humidity for different values of ambient pressure. sure has a lower effect on the water fraction contained in the atmospheric air, then varying the ambient tempera- ture. It also can be seen that humidity content in atmos- pheric air increases as ambient pressure decreases and the ambient temperature increases. That is to say, the condition in which a higher water volume can be oper- ated is when ambient condition presents high tempera- ture and low pressure. The water fraction contained in atmospheric air impacts the value of specific heat at con- stant pressure. The humidity effect takes importance at high atmospheric temperatures and compression ratio. If combustion is incomplete or excess air is used, the mixture temperature is lower than adiabatic combustion temperature. 2.6. Excess Air The minimum air quantity needed to get a complete oxi- dation of reactants is known as theoretic air [9]. Ideally, if combustion would be made with theoretic air, it could be a complete combustion and oxygen should not appear in products. At practice, this is impossible; because of the short time of combustion process is not enough to achieve a complete reaction of Oxygen and combustible molecules. That is why more Oxygen is needed than the theoretically necessary to achieve a complete combustion of reactants. Thus it is required excess air in order to assure the Oxidation of hydrocarbon molecules. Using excess air means that a quantity of air higher than theo- retically necessary (100%) was used. 200% of excess air means the double of theoretically necessary air to ach- ieve a complete combustion. It is 100% of excess air. Industrial gas turbines generally use excess air values from 100% to 600%. This work considers natural gas as combustible due to the general use of this one in gas tur- bines and combined cycles plants. Natural gas composi- tion varies from deposit to deposit and even with the time. It is useful to represent the combustion reaction of any hydrocarbon combustible with the form CnHm, us- ing atmospheric air as oxidation element, that is to say, considering the humidity in ambient. The elemental composition of fuel is Carbon and Hy- drogen as reactant elements, with other elements such as Nitrogen and Oxygen. The main combustion products are Carbon Anhydrous, CO2, and the Water Steam, H2O. The combustion reaction is the following: 2 ,, WA,2 1 WA,H O2 WA,DA 2WA,DA2 WA ACO HO 0.21O 0.79 k ini mi i xC HN Nx B NxC NxN (12) where: HO 2 DA 222 WA0.21O0.79NH Oxx (13) 11 1 24 kk k ii i iii i ii i mm AxnB Cxn (14) WA, DA 10.21 C N (15) It is known that the hot part temperatures at gas tur- bine inlet are a metallurgical limitation for each gas tur- bine model. These temperatures vary from 800˚C to 1700˚C depending on construction and turbine blades cooling system. By analyzing Equation (10) and know- ing the combustible composition, the only variable is the excess air , because combustion gas temperature (prod- ucts) is a known parameter, it is, turbine inlet tempera- ture T3. Excess air value , necessary to get a given combus- tion gas temperature T3, is found as follows. It is consid- ered that reactants enter to the combustion chamber at air Copyright © 2011 SciRes. EPE 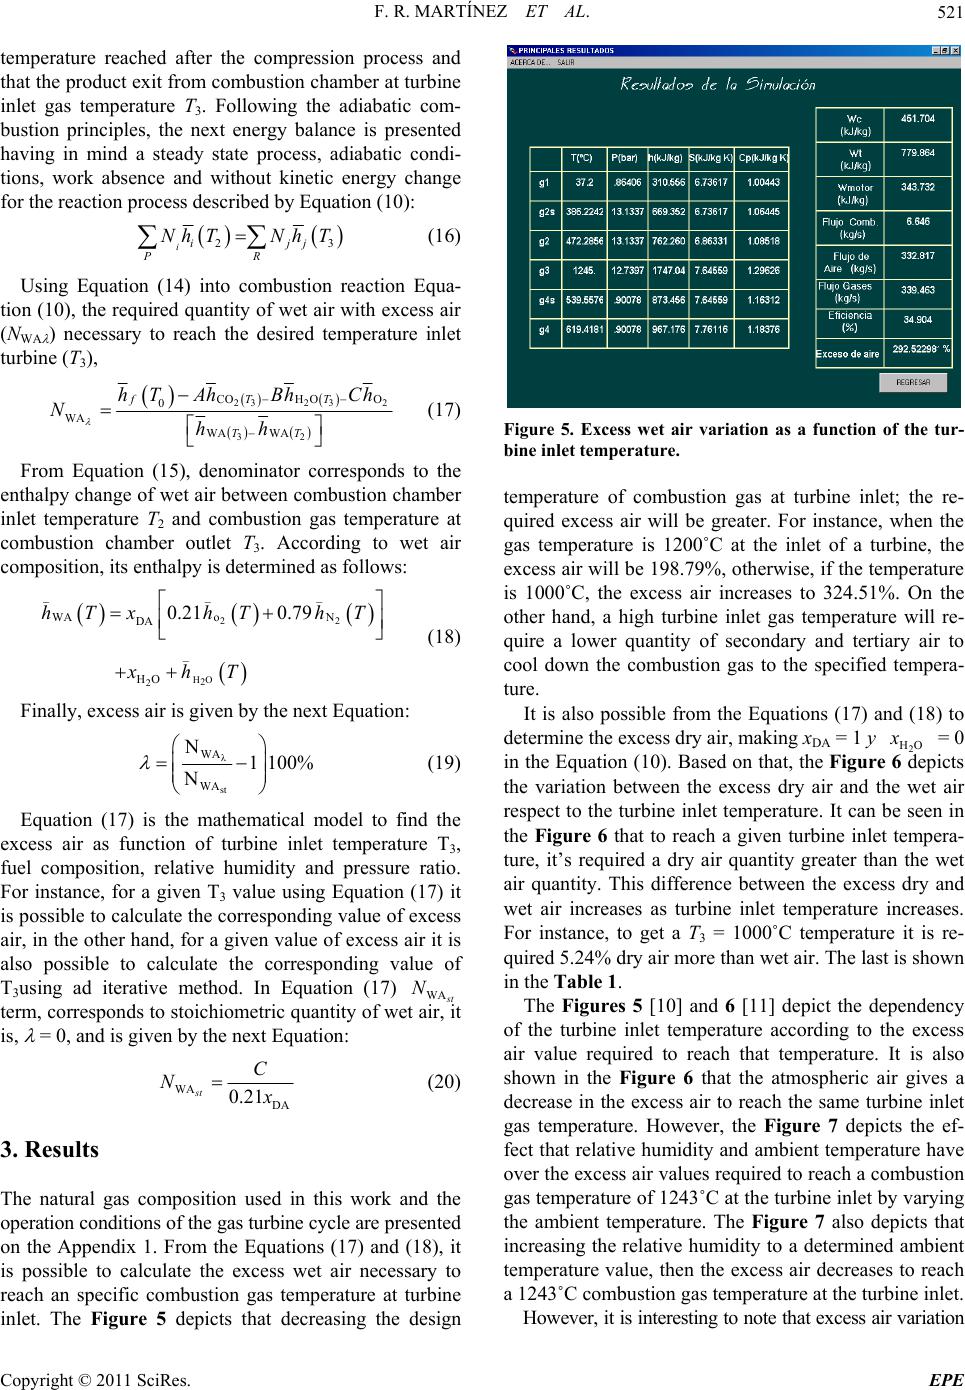 F. R. MARTÍNEZ ET AL.521 temperature reached after the compression process and that the product exit from combustion chamber at turbine inlet gas temperature T3. Following the adiabatic com- bustion principles, the next energy balance is presented having in mind a steady state process, adiabatic condi- tions, work absence and without kinetic energy change for the reaction process described by Equation (10): 2 iijj PR Nh TNhT 3 (16) Using Equation (14) into combustion reaction Equa- tion (10), the required quantity of wet air with excess air (NWA ) necessary to reach the desired temperature inlet turbine (T3), 232 32 32 COHOO 0 WA WA WA fTT TT hT AhBhCh Nhh (17) From Equation (15), denominator corresponds to the enthalpy change of wet air between combustion chamber inlet temperature T2 and combustion gas temperature at combustion chamber outlet T3. According to wet air composition, its enthalpy is determined as follows: 22 HO 2 2 __ WAo N DA _ HO 0.21 0.79hTxhT hT xhT _ (18) Finally, excess air is given by the next Equation: λ st WA WA N1100% N (19) Equation (17) is the mathematical model to find the excess air as function of turbine inlet temperature T3, fuel composition, relative humidity and pressure ratio. For instance, for a given T3 value using Equation (17) it is possible to calculate the corresponding value of excess air, in the other hand, for a given value of excess air it is also possible to calculate the corresponding value of T3using ad iterative method. In Equation (17) WA t term, corresponds to stoichiometric quantity of wet air, it is, = 0, and is given by the next Equation: N WA DA 0.21 st C N (20) 3. Results The natural gas composition used in this work and the operation conditions of the gas turbine cycle are presented on the Appendix 1. From the Equations (17) and (18), it is possible to calculate the excess wet air necessary to reach an specific combustion gas temperature at turbine inlet. The Figure 5 depicts that decreasing the design Figure 5. Excess wet air variation as a function of the tur- bine inlet temperature. temperature of combustion gas at turbine inlet; the re- quired excess air will be greater. For instance, when the gas temperature is 1200˚C at the inlet of a turbine, the excess air will be 198.79%, otherwise, if the temperature is 1000˚C, the excess air increases to 324.51%. On the other hand, a high turbine inlet gas temperature will re- quire a lower quantity of secondary and tertiary air to cool down the combustion gas to the specified tempera- ture. It is also possible from the Equations (17) and (18) to determine the excess dry air, making xDA = 1 y 2 HO = 0 in the Equation (10). Based on that, the Figure 6 depicts the variation between the excess dry air and the wet air respect to the turbine inlet temperature. It can be seen in the Figure 6 that to reach a given turbine inlet tempera- ture, it’s required a dry air quantity greater than the wet air quantity. This difference between the excess dry and wet air increases as turbine inlet temperature increases. For instance, to get a T3 = 1000˚C temperature it is re- quired 5.24% dry air more than wet air. The last is shown in the Table 1. The Figures 5 [10] and 6 [11] depict the dependency of the turbine inlet temperature according to the excess air value required to reach that temperature. It is also shown in the Figure 6 that the atmospheric air gives a decrease in the excess air to reach the same turbine inlet gas temperature. However, the Figure 7 depicts the ef- fect that relative humidity and ambient temperature have over the excess air values required to reach a combustion gas temperature of 1243˚C at the turbine inlet by varying the ambient temperature. The Figure 7 also depicts that increasing the relative humidity to a determined ambient temperature value, then the excess air decreases to reach a 1243˚C combustion gas temperature at the turbine inlet. However, it is interesting to note that excess air variation Copyright © 2011 SciRes. EPE 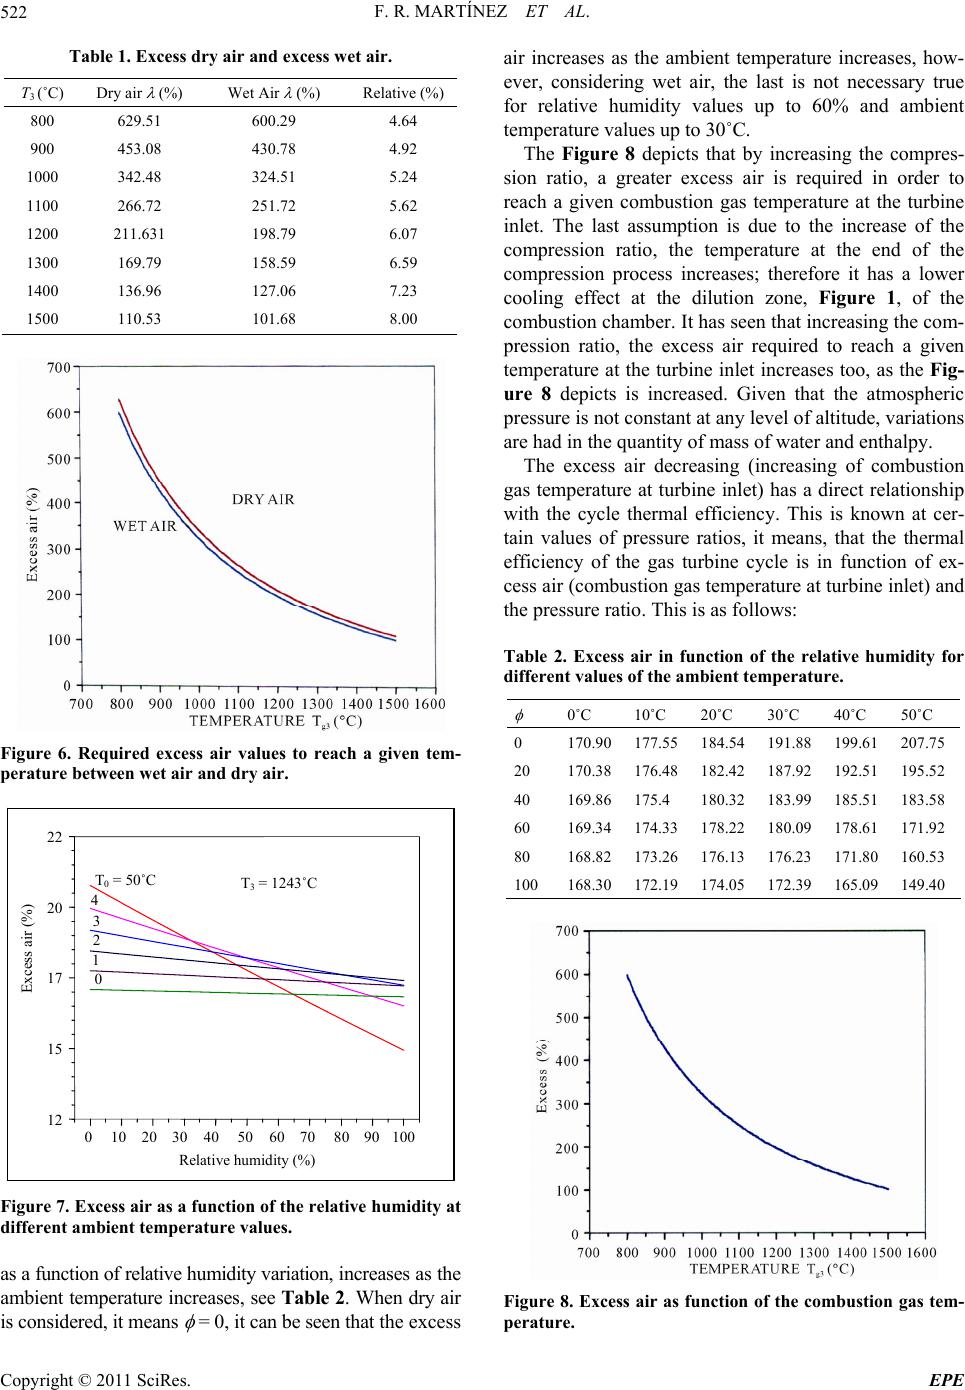 F. R. MARTÍNEZ ET AL. 522 Table 1. Excess dry air and excess wet air. T3 (˚C) Dry air (%) Wet Air (%) Relative (%) 800 629.51 600.29 4.64 900 453.08 430.78 4.92 1000 342.48 324.51 5.24 1100 266.72 251.72 5.62 1200 211.631 198.79 6.07 1300 169.79 158.59 6.59 1400 136.96 127.06 7.23 1500 110.53 101.68 8.00 Figure 6. Required excess air values to reach a given tem- perature between wet air and dry air. 010 20 30 40 5060 70 80 90100 Relative humidity (%) 12 15 17 20 22 Excess air (%) T 0 = 50˚C 0 4 3 2 1 T 3 = 1243˚C Figure 7. Excess air as a function of the relative humidity at different ambient temperature values. as a function of relative humidity variation, increases as the ambient temperature increases, see Table 2 . When dry air is considered, it means = 0, it can be seen that the excess air increases as the ambient temperature increases, how- ever, considering wet air, the last is not necessary true for relative humidity values up to 60% and ambient temperature values up to 30˚C. The Figure 8 depicts that by increasing the compres- sion ratio, a greater excess air is required in order to reach a given combustion gas temperature at the turbine inlet. The last assumption is due to the increase of the compression ratio, the temperature at the end of the compression process increases; therefore it has a lower cooling effect at the dilution zone, Figure 1, of the combustion chamber. It has seen that increasing the com- pression ratio, the excess air required to reach a given temperature at the turbine inlet increases too, as the Fig- ure 8 depicts is increased. Given that the atmospheric pressure is not constant at any level of altitude, variations are had in the quantity of mass of water and enthalpy. The excess air decreasing (increasing of combustion gas temperature at turbine inlet) has a direct relationship with the cycle thermal efficiency. This is known at cer- tain values of pressure ratios, it means, that the thermal efficiency of the gas turbine cycle is in function of ex- cess air (combustion gas temperature at turbine inlet) and the pressure ratio. This is as follows: Table 2. Excess air in function of the relative humidity for different values of the ambient temperature. 0˚C 10˚C 20˚C 30˚C 40˚C 50˚C 0 170.90177.55184.54 191.88 199.61 207.75 20 170.38176.48182.42 187.92 192.51 195.52 40 169.86175.4 180.32 183.99 185.51183.58 60 169.34174.33178.22 180.09 178.61 171.92 80 168.82173.26176.13 176.23 171.80 160.53 100 168.30172.19174.05 172.39 165.09 149.40 Figure 8. Excess air as function of the combustion gas tem- perature. Copyright © 2011 SciRes. EPE 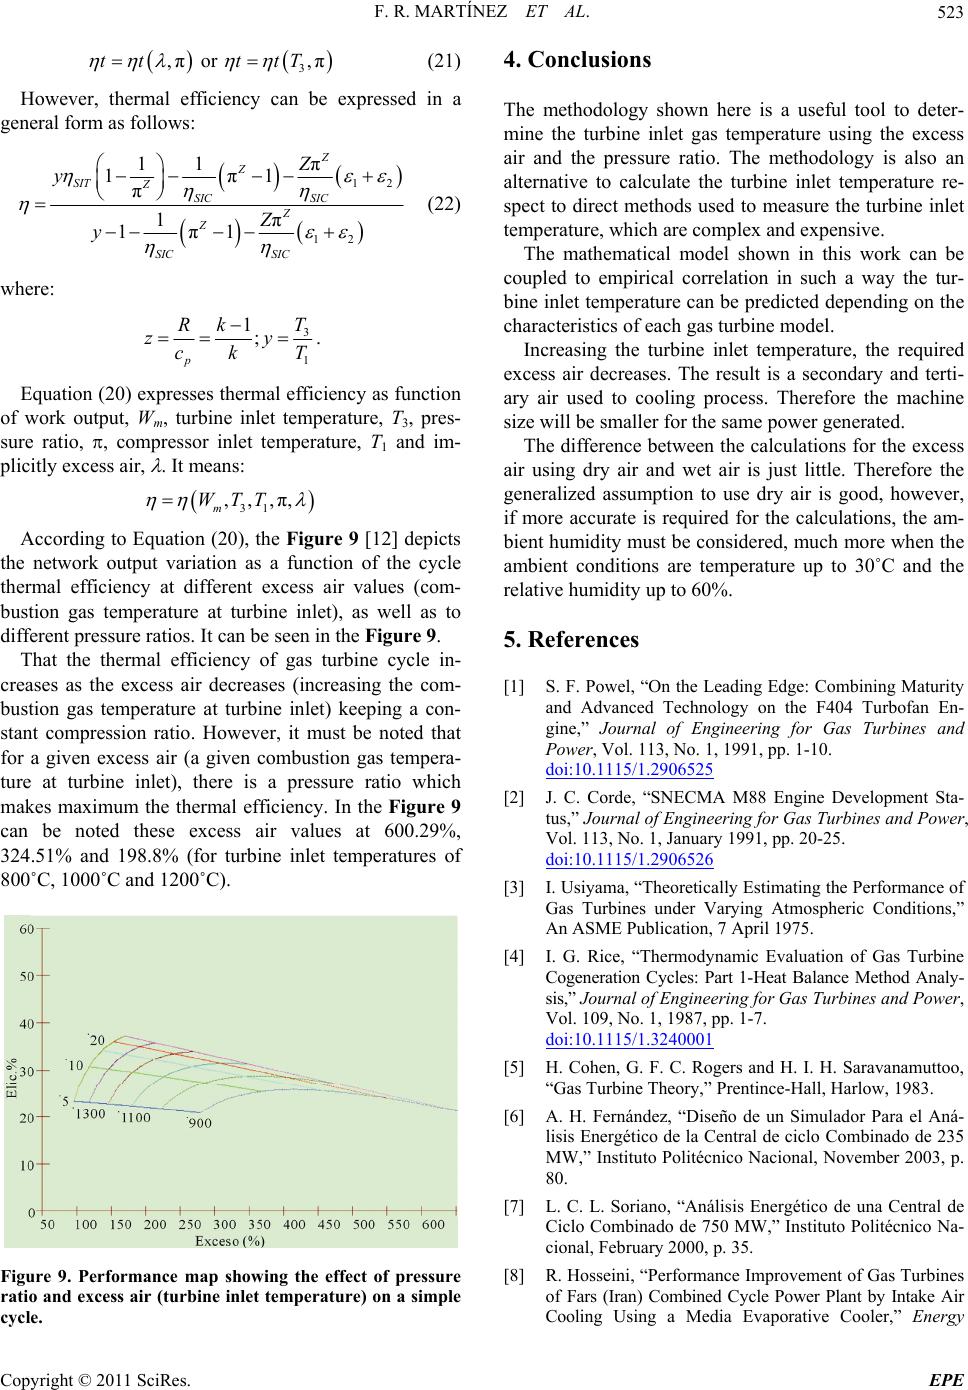 F. R. MARTÍNEZ ET AL.523 3 ,π or ,πtt ttT (21) However, thermal efficiency can be expressed in a general form as follows: 12 12 11 π 1π1 π 1π 1π1 Z Z SIT ZSIC SIC Z Z SIC SIC Z y Z y (22) where: 3 1 1; p T Rk zy ck T . Equation (20) expresses thermal efficiency as function of work output, Wm, turbine inlet temperature, T3, pres- sure ratio, , compressor inlet temperature, T1 and im- plicitly excess air, . It means: 31 ,,,π, m WTT According to Equation (20), the Figure 9 [12] depicts the network output variation as a function of the cycle thermal efficiency at different excess air values (com- bustion gas temperature at turbine inlet), as well as to different pressure ratios. It can be seen in the Figure 9. That the thermal efficiency of gas turbine cycle in- creases as the excess air decreases (increasing the com- bustion gas temperature at turbine inlet) keeping a con- stant compression ratio. However, it must be noted that for a given excess air (a given combustion gas tempera- ture at turbine inlet), there is a pressure ratio which makes maximum the thermal efficiency. In the Figure 9 can be noted these excess air values at 600.29%, 324.51% and 198.8% (for turbine inlet temperatures of 800˚C, 1000˚C and 1200˚C). Figure 9. Performance map showing the effect of pressure ratio and excess air (turbine inlet temperature) on a simple cycle. 4. Conclusions The methodology shown here is a useful tool to deter- mine the turbine inlet gas temperature using the excess air and the pressure ratio. The methodology is also an alternative to calculate the turbine inlet temperature re- spect to direct methods used to measure the turbine inlet temperature, which are complex and expensive. The mathematical model shown in this work can be coupled to empirical correlation in such a way the tur- bine inlet temperature can be predicted depending on the characteristics of each gas turbine model. Increasing the turbine inlet temperature, the required excess air decreases. The result is a secondary and terti- ary air used to cooling process. Therefore the machine size will be smaller for the same power generated. The difference between the calculations for the excess air using dry air and wet air is just little. Therefore the generalized assumption to use dry air is good, however, if more accurate is required for the calculations, the am- bient humidity must be considered, much more when the ambient conditions are temperature up to 30˚C and the relative humidity up to 60%. 5. References [1] S. F. Powel, “On the Leading Edge: Combining Maturity and Advanced Technology on the F404 Turbofan En- gine,” Journal of Engineering for Gas Turbines and Power, Vol. 113, No. 1, 1991, pp. 1-10. doi:10.1115/1.2906525 [2] J. C. Corde, “SNECMA M88 Engine Development Sta- tus,” Journal of Engineering for Gas Turbines and Power, Vol. 113, No. 1, January 1991, pp. 20-25. doi:10.1115/1.2906526 [3] I. Usiyama, “Theoretically Estimating the Performance of Gas Turbines under Varying Atmospheric Conditions,” An ASME Publication, 7 April 1975. [4] I. G. Rice, “Thermodynamic Evaluation of Gas Turbine Cogeneration Cycles: Part 1-Heat Balance Method Analy- sis,” Journal of Engineering for Gas Turbines and Power, Vol. 109, No. 1, 1987, pp. 1-7. doi:10.1115/1.3240001 [5] H. Cohen, G. F. C. Rogers and H. I. H. Saravanamuttoo, “Gas Turbine Theory,” Prentince-Hall, Harlow, 1983. [6] A. H. Fernández, “Diseño de un Simulador Para el Aná- lisis Energético de la Central de ciclo Combinado de 235 MW,” Instituto Politécnico Nacional, November 2003, p. 80. [7] L. C. L. Soriano, “Análisis Energético de una Central de Ciclo Combinado de 750 MW,” Instituto Politécnico Na- cional, February 2000, p. 35. [8] R. Hosseini, “Performance Improvement of Gas Turbines of Fars (Iran) Combined Cycle Power Plant by Intake Air Cooling Using a Media Evaporative Cooler,” Energy Copyright © 2011 SciRes. EPE 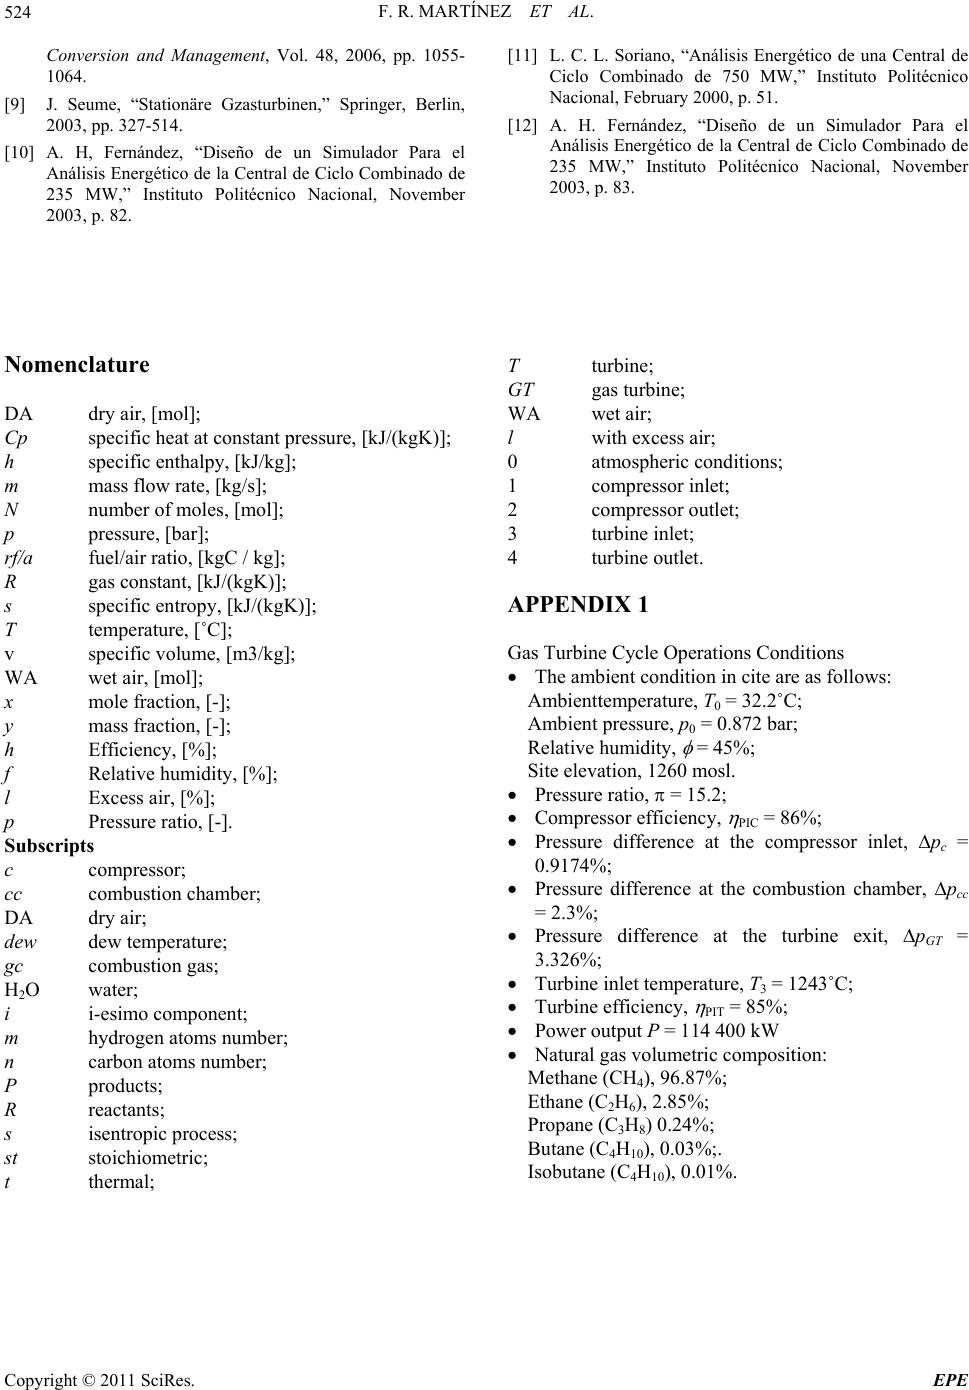 F. R. MARTÍNEZ ET AL. Copyright © 2011 SciRes. EPE 524 Conversion and Management, Vol. 48, 2006, pp. 1055- 1064. [9] J. Seume, “Stationäre Gzasturbinen,” Springer, Berlin, 2003, pp. 327-514. [10] A. H, Fernández, “Diseño de un Simulador Para el Análisis Energético de la Central de Ciclo Combinado de 235 MW,” Instituto Politécnico Nacional, November 2003, p. 82. [11] L. C. L. Soriano, “Análisis Energético de una Central de Ciclo Combinado de 750 MW,” Instituto Politécnico Nacional, February 2000, p. 51. [12] A. H. Fernández, “Diseño de un Simulador Para el Análisis Energético de la Central de Ciclo Combinado de 235 MW,” Instituto Politécnico Nacional, November 2003, p. 83. Nomenclature DA dry air, [mol]; Cp specific heat at constant pressure, [kJ/(kgK)]; h specific enthalpy, [kJ/kg]; m mass flow rate, [kg/s]; N number of moles, [mol]; p pressure, [bar]; rf/a fuel/air ratio, [kgC / kg]; R gas constant, [kJ/(kgK)]; s specific entropy, [kJ/(kgK)]; T temperature, [˚C]; v specific volume, [m3/kg]; WA wet air, [mol]; x mole fraction, [-]; y mass fraction, [-]; h Efficiency, [%]; f Relative humidity, [%]; l Excess air, [%]; p Pressure ratio, [-]. Subscripts c compressor; cc combustion chamber; DA dry air; dew dew temperature; gc combustion gas; H2O water; i i-esimo component; m hydrogen atoms number; n carbon atoms number; P products; R reactants; s isentropic process; st stoichiometric; t thermal; T turbine; GT gas turbine; WA wet air; l with excess air; 0 atmospheric conditions; 1 compressor inlet; 2 compressor outlet; 3 turbine inlet; 4 turbine outlet. APPENDIX 1 Gas Turbine Cycle Operations Conditions The ambient condition in cite are as follows: Ambienttemperature, T0 = 32.2˚C; Ambient pressure, p0 = 0.872 bar; Relative humidity, = 45%; Site elevation, 1260 mosl. Pressure ratio, = 15.2; Compressor efficiency, PIC = 86%; Pressure difference at the compressor inlet, pc = 0.9174%; Pressure difference at the combustion chamber, pcc = 2.3%; Pressure difference at the turbine exit, pGT = 3.326%; Turbine inlet temperature, T3 = 1243˚C; Turbine efficiency, PIT = 85%; Power output P = 114 400 kW Natural gas volumetric composition: Methane (CH4), 96.87%; Ethane (C2H6), 2.85%; Propane (C3H8) 0.24%; Butane (C4H10), 0.03%;. Isobutane (C4H10), 0.01%.
|