Energy and Power En gi neering, 2011, 3, 490-498
doi:10.4236/epe.2011.34059 Published Online September 2011 (http://www.SciRP.org/journal/epe)
Copyright © 2011 SciRes. EPE
Mechanism Analysis on Str e ss Accumulation in Cylindrical
Vertical-Placed Metal Hydride Reactor
Xiaochen Hu, Zhaogang Qi, Feng Qin, Jiangping Chen
Institute of Refrigeration and Cryogenics Engineering,
Shanghai Jiao Tong University, Shanghai, China
E-mail: sissi.xiaochenhu@gmail.com
Received June 29, 2011; revised July 30, 2011; accepted August 15, 2011
Abstract
It’s known that the pulverization-densification mechanism of metal hydride may cause the stress accumula-
tion in metal hydrides reactors. In this paper, this idea is proved based on granulometry and a new idea of
cycling compression effect is presented, which is caused by the friction between wall and metal hydrides.
Through theoretical analysis, the cycling compression effects is shown to increase the localized packing rate
from top to down in vertical-placed reactors and thus lead to the maximum deformation in the bottom of re-
actors, proving that it is the interaction of pulverization-densification effect and cycling compression effect
resulting in the stress problems of vertical-placed reactors. Further study points that the effective methods
relieving the cycling compress effect are to decrease hydrogen absorption/desorption cycle number, slender-
ness ratio of reactor, wall friction factor and initial packing rate, or to lower the thermal conductivity and the
volume expansion coefficient of metal hydrides.
Keywords: Metal Hydride, Stress Accumulation, Pulverization, Densification
1. Introduction
The pulverization and expansion of metal hydrides during
its absorption/desorption cycles could decrease the reliabil-
ity of the reactor directly and greatly, becoming one of the
key obstacles to the development and application of hy-
drogen energy. Many studies have been done to explain
and solve this problem. In Nakamura Y. et al.’s study, the
expansion ratio for AB5 type metal hydrides can be larger
than 1.2 during the hydrogen absorption, being the domi-
nant factors in the intrinsic powder degradation [1]. B. Y.
Ao et al. also found in their test that the LaNi5 alloy’s vol-
ume expansion ratio was up to 24% after absorbing hydro-
gen, causing the density of alloy from the top to bottom of
the bed higher and higher and thus the stress greater and
greater after several cycles [2]. They indicated that the in-
crease of initial packing rate and decrease of the wall
thickness could help relieving the stress accumulation. Na-
sako K. et al. presented that the localized stress would be
generated at the bottom of the reactor with an alloy packing
rate of 40% (v/v), and increased with each absorption/de-
sorption cycle [3]. They then proved that the stress accu-
mulation depend on the amount of hydrogen absorption/
desorption cycles and on the initial packing rate. Other
experimental studies also proved that the actual stress could
rise up acutely with the increase of localized relative den-
sity, depth of reactor and cycle number et al. [4-6]. As a
conclusion, the pulverization-densification mechanism is
proposed and widely accepted: during the process of hy-
drogen absorption/desorption cycles, since the metal hy-
drides powder is crushing up gradually, the finer and finer
particles becomes gathering into to the bottom of the reac-
tor under the pull of gravity, which finally cause the local-
ize relative density of metal hydrides powder to increase
and self-densification to take place after several repeated
manner [4]. Hence, in order to smooth the expansion of
metal hydrides and the congestion of stress, researchers
have carried out a lot of attempt, for example, designing
special construction of reactor, like “rabloc” and “free
space” in the reactor advised by Block F. R. et al. [7] and
Bernauer O. et al. [8], respectively.
Although a lot of investigations have indicated that the
stress accumulation is clarified by the pulverization-
densification of metal hydrides and the absorption/de-
sorption cycles, few surveys have been presented about
the reason how the absorption/desorption cycles could
help the concentration of stress. In this study, a new idea
of cycling compression effect is proposed to explain the
principle of absorption/desorption cycles on the stress
accumulation. Cycling compression effect is caused by
X. C. HU ET AL.491
the friction between bed wall and metal hydrides powder.
Through the model simulation, its mechanism has been
described and the factors which perform influence to the
effect have been also studied.
2. Experimental
Figure 1 shows the structure of the metal hydrides reac-
tor. The reactor made of stainless steel was filled with
La0.6Y0.4Ni4.8Mn0.2. The alloy was prepared in a vacuum
arc remelting furnace under argon (99% pure) atmos-
phere. The purity of the metal used is as follows: La is
99% pure, Y and Ni is 99.5% pure, Mn is 99.7% pure.
The alloys were annealed at 1323 K for 12 h in the vac-
uumed quartz tubes. They were then activated in the
method of surface modification.
In the first step, the distribution of metal hydrides
powder in different location was measured using micro-
scope and 25 hydrogen absorption/desorption cycles
were processing in the vertical-placed reactor with 51.5
vol% initial packing rate. After each cycle, the particle
distribution was measured with the metal hydrides sam-
ple extracted in the location of 10 mm, 63 mm and 78
mm away from the bottom of the bed, using B-spline
curve to smooth the histogram data. The particle distri-
bution after 25th cycles using the metal hydrides powder
with initial size ranging from 212 μm to 380 μm was
considered as the basis set for comparison
The hydrogen absorption/desorption cycles was tested
in the measurement as Figure 2. And the reactor was
placed vertically. The absorption stage and desorption
Figure 1. Structure of thin-wall cylindrical reactor. (A:
Hydrogen entrance; B: Stainless steel sintered filter; C:
Alloy; D: Stainless steel cylinder; E: End cap; F: Joint
socket).
Figure 2. The reactor cycling strain test bench. (A: Hydro-
gen cylinder; B: Pressure regulator; C: Ball valve; D: Hy-
drogen reference cylinder; E: Pressure sensor; F: Vacuum
pump; G: Thermostatic water bath; H: Pt100 RTD; I:
Thin-wall sample vessel; J: Compensating vessel; K: Biaxial,
90° stacked rosettes; L: Strain amplifier; M: Data acquisi-
tion system; N: Computer).
stage were lasting for one hour each. The hydrogen-inlet
pressure and water bath temperature were 3 MPa and 313
K, respectively, ensuring the maximum hydrogen content
per mass alloy around 1 molmol1.
3. The Pulverization-Densification Effect
Figure 3 shows the metal hydride particle size distribu-
tions at different height in the reactor. With the sampling
point’s dropping, a left shift is found in the distribution
curve obviously, which means the proportion increase of
fine particles. The cumulative distribution at 10 mm, 63
mm and 78 mm height is 24.6%, 16.2% and 9.4% in the
range of 1 to 5 μm particle diameter and 11.1%, 21.9%
and 21.1% in the range of 20 to 80 μm, when the distri-
bution at the basis set is 11.6% and 28.8%, respectively.
The above kind of distribution is mainly caused by the
pulverization and particle sedimentation of metal hydride.
During the absorption/desorption cycles, gravity pro-
vides a driving force for the sedimentation of particles.
At the same time, the extrusion, stretching, isolation and
fragmentation between particles as well as the frequent
110100
0
4
8
12
16
Differential volume fraction (%)
Particle diameter (
m)
10 mm
63 mm
78 mm
Baseline
40
30
20
42 5035
Figure 3. Particle size distributions at different height in the
reactor.
Copyright © 2011 SciRes. EPE
X. C. HU ET AL.
492
scaling of particle distance led by absorption/desorption
cycles accelerate the particle deposition. However, the
particles of large and medium size are easily blocked
during the sinking process, while the fine particles can
sink sufficiently because of its small size. In the test, the
fully sedimentation of fine particles whose diameter is
less than 5 μm from the middle and top of the bed leads
to the proportion increase of fine particles in the bottom
of the bed. On the other hand, the proportion of the me-
dium size particles from 10 to 20 μm increases in the
middle of the bed because of their inadequate sedimenta-
tion, making the curves of 63 mm and 78 mm distribute
between those of 10 mm and basis set. From the results,
the effect of particles sedimentation performs more ob-
viously with the increasing height in the bed. And in the
bottom of the bed, since the packing rate is increased as
the sink of more and more fine particles, the appearance
of stress accumulation presents more prominent than
those in the top and middle of the bed. So to decrease the
height of metal hydrides filled can be an effective
method to reduce the stresses in the bed.
4. The Effect of Cycling Compression
4.1. The Ideal Model of Cycling Compression
Effect
Before analysis, various assumptions made for the sim-
plified modeling are given below.
The relative density of metal hydrides is assumed
constant in the radial direction and axial-variable
relative density is considered only.
Considering the mass of hydrogen absorbed/desorbed
in the process, the “alloy composition packing den-
sity” ρa is defined as the mass of both metal hydrides
and hydrogen per unit volume in the bed. That is, af-
ter the desorption process has finished completely, the
ρa is then consistent with the packing density of metal
hydrides in the bed.
During the cycle, the process of absorption/desorp-
tion is assumed synchronous in each part, which
means the localized alloy composition packing den-
sity and localized packing density are homogeneous
in the same area.
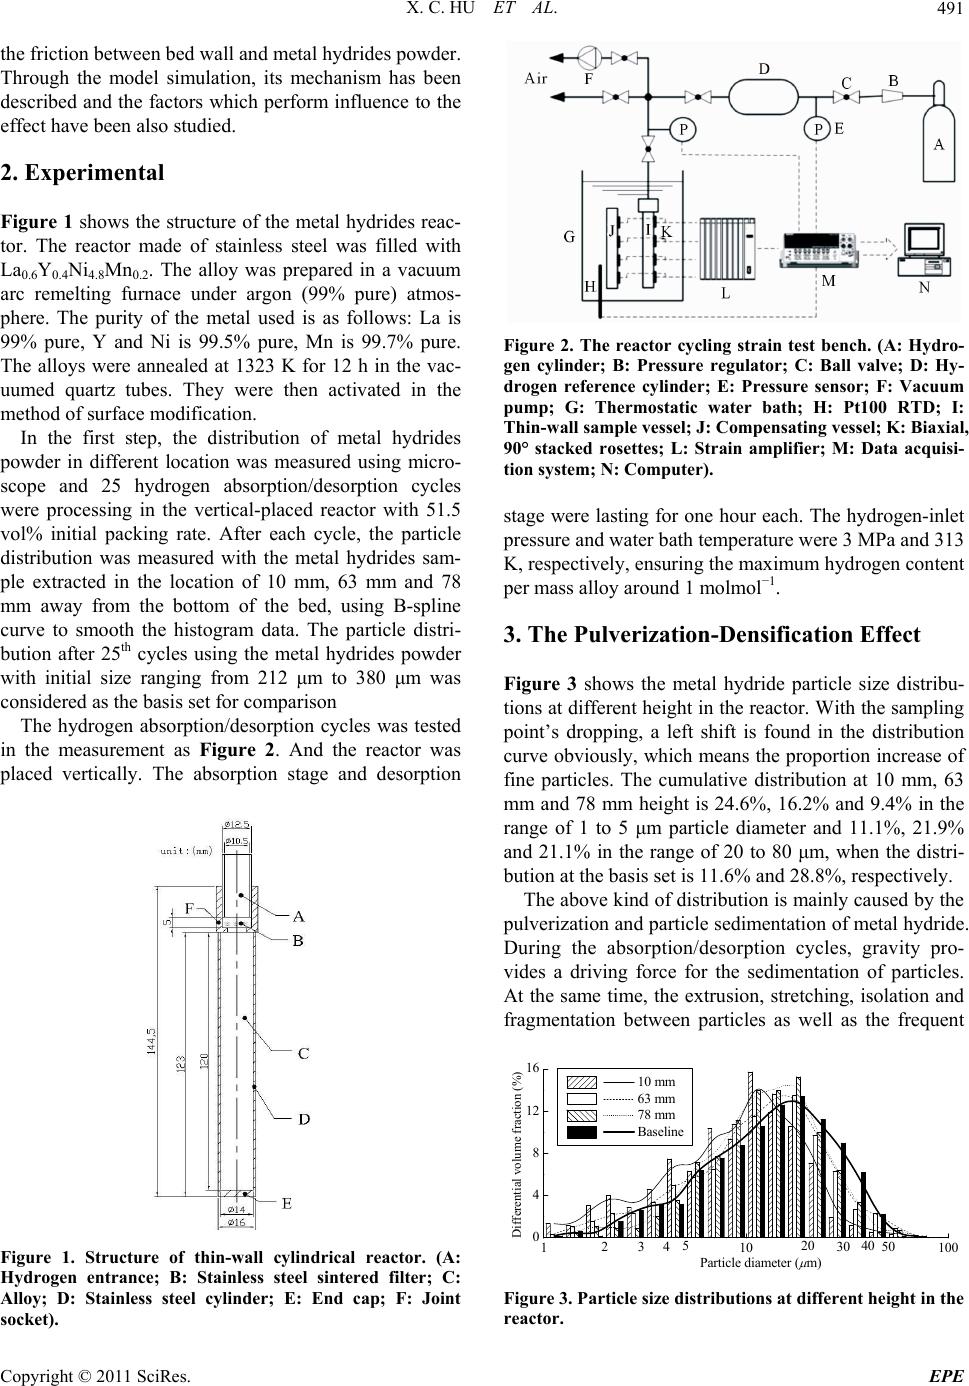
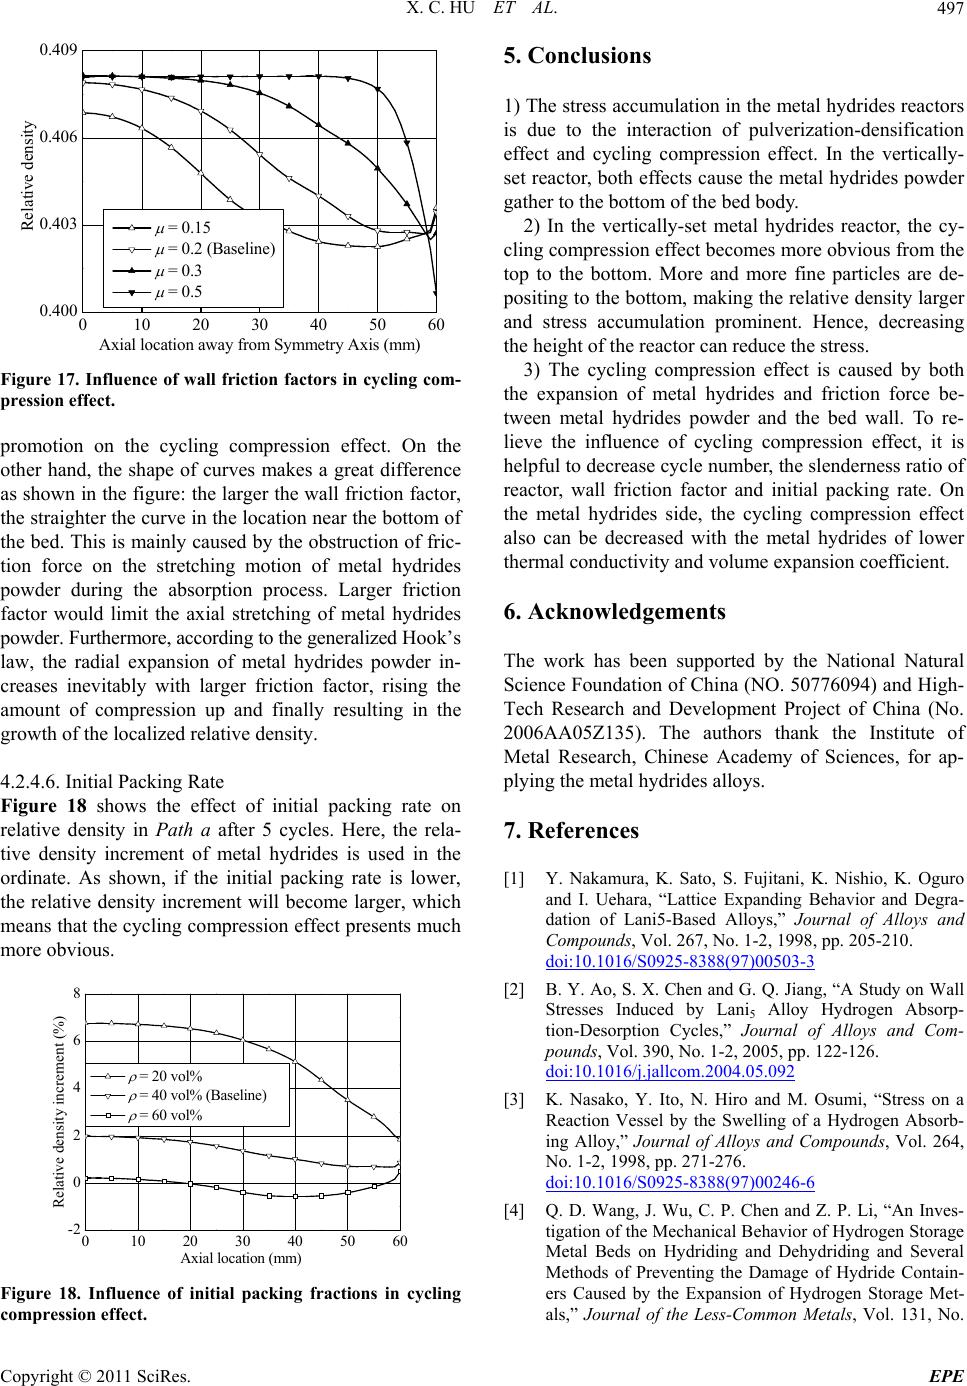
Figure 4 shows the ideal process of cycling compres-
sion effect in one absorption/desorption cycle. The metal
hydrides in the bed are divided into two parts: Part A
near the hydrogen-inlet and Part B far away the hydro-
gen-inlet, with black spots showing the density of alloys
approximately. Since the absorbing/desorbing velocity of
metal hydrides is quite fast, it is suitable to argue that the
absorption/desorption in Part A is processing earlier than
that in Part B. On step a, metal hydrides in two parts are
all loose and uniform. As the absorption process is start-
ing up (step b), metal hydrides in Part A begin to absorb
hydrogen, then expand and squeeze those in Part B,
which leading to the increase of ρa in Part B and the de-
crease of ρa in Part A. The compression deformation of
metal hydrides happened in Part B includes irreversible
plastic deformation and reversible elastic deformation [2].
And then metal hydrides in Part B start the process of
absorption, expansion and reversion (step c) which make
the ρa in Part B decrease and the ρa in Part A recovery
appreciably. However, this recovery procedure is hin-
dered by the friction force produced between fully-ex-
pansive metal hydrides in Part A and the bed wall. The ρa
in both parts can’t resume to the initial state before ab-
sorption and the ρa in Part B still keeps larger than that in
Part A (step d). During the desorption process on step e,
metal hydrides in Part A is starting to shrink firstly when
those in Part B is keeping on recovering its elastic de-
formation part, which is also held back by the friction
force occurring between fully-expansive metal hydrides
in Part B and the bed wall. Along with the progress of
cycle, metal hydrides in Part B are then desorbing hy-
drogen, shrinking and finally retain the plastic deforma-
tion with no hydrogen. Compared with the status of
pre-cycle, the interface of two parts is downward shifting
and the localized packing rate of metal hydrides in Part B
is higher than that in Part A. That is, for the metal hy-
dride reactor bed, the cycling compression effect would
cause the localized packing rate of alloys growing from
the hydrogen-inlet to the bottom of the bed.
4.2. The Modeling for the Practical Process of
Cycling Compression Effect
4.2.1. The Calculation Principle
In order to get quantitative verification and analysis on
the cycling compression effect, the absorption and de-
sorption processes of metal hydrides in the reactor bed
Figure 4. The ideal process of cycling compression effect.
(Step (a) initial state before absorption; (b) absorption of
Part A; (c) absorption of Part B; (d) after absorption; (e)
desorption process; (f) after desorption).
Copyright © 2011 SciRes. EPE
X. C. HU ET AL.
Copyright © 2011 SciRes. EPE
493
ption cycles, respectively. It can be observed that after
multiple cycles the localized relative density of metal
hydrides is growing from the hydrogen-inlet (right side)
to another closed bottom (left side) and on the radial di-
rection, the localized relative density of left-part metal
hydrides is increasing while that of right-part is decreas-
ing. The maximum localized relative density appears in
the corner where the metal hydrides powder is transiting
to the bottom of the bed (top left corner in Figure 7) and
the minimum value is on the top right corner near the
hydrogen inlet. In additional, compared with that after 5
cycles, the localized relative density after 50 cycles is
obviously higher in each part of the bed. These results
are consistent with the above analysis on the ideal model.
So it can be proved that there exists the cycling compres-
sion effect caused by the friction force between ex-
panded metal hydrides powder and the bed wall in the
reactor.
were modeled on the finite element analysis software
MSC. MARC. It uses the Shima yield function to de-
scribe the plastic yield phenomenon of metal hydrides
powders approximately [9]:
1/2
2
2
13
2y
p
F





(1)
where σy is the unidirectional yield stress,
is the de-
viatoric stress tensor and p is the iso-static pressure. β
and γ are the related parameters of metal hydrides. They
can be determined through uniaxial compression test and
iso-static pressure test.
To the metal hydride powder, its plastic yield is occur-
ring in the hydrogen absorption process. However, its
expansion during hydrogen absorbing stage is a chemical
reaction process, making it hard to establish the model
directly. Considering the similarity between mass trans-
fer and heat transfer process in the reactor bed, it is pro-
posed to replace the hydrogen source with heat source
and use the thermal expansion coefficient instead of the
volume expansion coefficient in the model. The influ-
ence law of absorption and desorption cycle on localized
packing rate of metal hydrides in the bed is studied in
this simulation model, without regard to the effect of
pulverization-densification.
Study on the localized relative density in selected
spots has been carried out, too. Shown on Figure 8, six
paths are chosen in the model: Path a is from the bottom
to the hydrogen-inlet along the symmetry axis; Path r1 to
Path r5 are pointing to the bed wall along the radial di-
rection, whose spacing with the bottom of bed is 1, 15,
Table 1. Parameters of initial condition and metal hydrides.
4.2.2. Model and Boundary Co ndi tions Fraction coefficient 0.2
Thermal conductivity of metal hydride 20 W/(m·K)
Initial packing rate of metal hydrides 40 vol%
Thermal expansion rate 20 vol%
Linear expansion coefficient 0.000333/˚C
Since it is assumed that the effect of cycling compression
is axisymmetric in the cylindrical reactor, only half of
the reactor has been modeled as shown in Figure 5.
Defining the inner wall as rough wall surface, the fric-
tion force exists between metal hydrides powder and
medial surface of the reactor bed. The parameters of ini-
tial condition and system are given in Table 1. In the
model, a temperature constraint shown in Figure 5 is
also added on the right side of metal hydrides to simulate
the process that hydrogen starts to go into the powder
from the inlet on the right side of the reactor bed. Figure
6 gives the constraint of time on temperature. The high-
est temperature of heat source is 200˚C.
4.2.3. Simulati on C oncl usi o n and Di scussi o n
Figure 7 shows the contour map on localized relative
density of metal hydrides after 5 and 50 absorption/desor- Figure 6. Temperature constraint of time in the model.
Figure 5. Calculation model of cycling compression effect.
X. C. HU ET AL.
494
(a)
(b)
Figure 7. The contour map of localized relative density. (a) After 5 cycles. (b) After 50 cycles.
Figure 8. Analysis spots and analysis paths for the packed alloy.
30, 45 and 59 mm, respectively. Meanwhile, seven spots
are selected in the paths.
0 102030405060
0.40
0.41
0.42
0.43
Axial location (mm)
Relative density
1st cycle
5th cycle
10th cycle
25th cycle
50th cycle
Figure 8 shows the localized relative density in each
path. In Figure 9(a), it is observed that the localized
relative density in Path a is decreasing from the bottom
to the inlet where exists fluctuation within a narrow
range and as the increase of the cycle numbers it is
growing up with different amplitude in all locations of
Path a. It is mainly due to the radial compression of
metal hydrides powder and since the cycling compres-
sion effect is reacting on the symmetry axis, the increase
amplitude of the localized relative density at the bottom
is higher than that near the inlet. Figure 9(b) reveals the
distribution of localized relative density on Path r1 to
Path r5 after 5 cycles and the localized relative density
increases radially along Path r1 to Path r3 contrary to
that along Path 4 and Path 5. This is the result of the
friction force between metal hydrides powder and the
bed wall, which make the cycling compression effect
reacting on the regions near the bed wall more signifi-
cantly.
(a)
01234567
0.399
0.401
0.403
0.405
0.407
0.409
Relative density
Radial location (mm)
Path r1
Path r2
Path r3
Path r4
Path r5
Figure 10 shows the localized relative density time
history curves on #a1 and #a5 spot, presenting an obvi-
ous rise of localized relative density in the bottom. Fig-
ure 11 indicates another time history curves of axial and
radial displacement on spot #e5 near the inlet and with
the progress of cycling metal hydrides at the terminal
point of each cycle are keep shrinking in the radial direc-
tion under compressing and keep stretching in the axial
direction caused by radial compressing as well as axial
(b)
Figure 9. Distribution of localized relative density on alloy
analysis paths. (a) Path a; (b) Path r1 to Path r5 after 5 cy-
cles.
Copyright © 2011 SciRes. EPE
X. C. HU ET AL.495
06001200 1800 2400 3000
0.396
0.400
0.404
0.408
0.34
0.36
0.39
0.41
#a5 Localized relative density
#a1 Localized relative density
Time (s)
# a1
# a5
2400 2550 2700 2850 3000
-1.0x10⁵
-8.0x10⁴
-6.0x10⁴
-4.0x10⁴
-2.0x10⁴
0.0
2.0x10⁴
4.0x10⁴
Contact friction force (Pa)
Time (s)
# e1
# e2
# e3
# e4
# e5
Figure 10. Time history curves of localized relative density
on spot #a1 and #a5.
06001200 1800 2400 3000
0.0
0.5
1.0
1.5
2.0
-0.055
-0.040
-0.025
-0.010
0.005
Time (s)
Radial displacement (mm)
Axial displacement (mm)
Axial displacement
Radial displacement
Figure 11. Time history curves of displacement on spot #e5.
rubbing until they separate with the bed wall. Further, the
time history of friction force in spots #e1 to #e5 in the
fifth cycle is studied as shown on Figure 12. The friction
force performs more notable in the spots near the inlet,
where the friction force is negative during the absorption
process and reaching the maximum in the end of the ab-
sorbing stage, being an obstacle to the stretch of metal
hydrides powder. In the desorption process, the friction
force is decreasing gradually and transiting to be positive
in the middle stage, indicating that the friction force is
turning to an obstacle to the shrinkage of metal hydrides
powder. These results are also consentaneous compared
with the above theoretical analysis on cycling compres-
sion effect. Moreover, a negative peak of friction force
appears on spots #e2 and #e3 in the later desorption stage
and the time node of negative peak is delaying with the
left shift of test spots. This is because the stress release
process of metal hydrides during desorption is asyn-
chrony on the radial direction. After 2900 seconds the
friction force on each spot becomes zero, meaning that
the metal hydrides powder is separated from the bed wall
in the later stage of cycle, confirming the displacement
change on radial direction of #e5 on Figure 11.
4.2.4. Influencing Factor of the Cycling Compression
Effect
4.2.4.1. Slenderness Ratio of Reactor
It has been proved that an effective method of decreasing
Figure 12. Time history curves of friction force on spots #e1
to #e5 in the fifth cycle.
the stress is to reduce the vertical height of reactor
[10,11]. Considering the deformation of metal hydrides
powder on the radial direction as above analysis, the
slenderness ratio of reactor is used as a structural factor
of the cycling compression effect. Figure 13 shows the
distribution of localized relative density on Path a with
different reactor slenderness ratios after 5 cycles, whose
abscissa is relative location (relative location is the ratio
of test spot coordinate and total metal hydrides powder
length). It is observed that with the increasing of reactor
slenderness ratio the localized relative density is growing
up remarkably but its amplitude is slowdown. It is be-
cause the contact area of metal hydrides powder and re-
actor is increasing with the slenderness ratio, making the
effect of friction more obviously and the localized rela-
tive density larger. However, the increase of friction and
reactor length also has the hysteresis effect on the de-
veloping process of the cycling compression effect.
Hence, to decrease the slenderness ratio of reactor ap-
propriately can help relieve the cycling compression ef-
fect.
4.2.4.2. Cycle Number of Times
Figure 14 shows the effect of cycle number on the cy-
cling compression effect. In Figure 14(a), it is shown
that the relative density of metal hydrides is increasing
with the cycle number of times on spots #a1 and #a5.
Similarly, the axial and radial displacement of spot #e5
shown in Figure 14(b) is also increasing. These two re-
sults present that the cycling compression effect increase
with the cycle number and it may cause that the localized
relative density in the bottom of reactor exceed the al-
lowed value after a certain cycle number.
4.2.4.3. Thermal Conductivity of Metal Hydrides
Figure 15 shows the distribution of relative density in
Path a after 5 cycles with changing thermal conductivity
Copyright © 2011 SciRes. EPE
X. C. HU ET AL.
496
0.0 0.1 0.2 0.30.4 0.5 0.6 0.7 0.8 0.9 1.0
0.402
0.403
0.404
0.405
0.406
0.407
0.408
0.409
Relative density
Relative locatio
n
l /d=2.33
l /d=3.26
l /d=4.29
l /d=5.40
l /d=6.60
Figure 13. Localized relative density on Path a with differ-
ent reactor slenderness ratios after 5 cycles.
0 102030405
0.40
0.41
0.42
0.43
0
Relative density
Cycle number of times
# a1
# a5
(a)
0 1020304050
0.0
0.7
1.4
2.1
2.8
3.5
-0.25
-0.20
-0.15
-0.10
-0.05
0.00
Cycle number of times
Radial displacement (mm)
Axial displacement (mm)
Axial
Radial
(b)
Figure 14. Influence of cycle number of times in cycling
compression effect. (a) Spots #a1 and #a5; (b) Spot #e5.
of metal hydrides. As is shown, the relative density in the
same location increase with the thermal conductivity but
the rising amplitude is decreasing gradually. This is be-
cause the lower mass-transfer velocity made the axial
expansion of metal hydrides powder develop completely
before the friction force between expanded metal hy-
drides powder and the bed wall becomes strong, de-
creasing the axial plastic deformation of metal hydrides
powder. Therefore, to choose a reasonable mass-transfer
velocity of metal hydrides can help inhibit the cycling
compression effect.
4.2.4.4. Volume Expansion Coefficient of Metal
Hydrides
Figure 16 presents the distribution of relative density in
Path a after 5 cycles with volume expansion coefficient
of metal hydrides. Obviously, the cycling compression
effect was strengthened with the increase of volume ex-
pansion coefficient.
4.2.4.5. Wall Friction Factor
Figure 17 shows the distribution of relative density in
Path a after 5 cycles with different wall friction factor
between metal hydrides powder and the bed wall. These
distribution curves present a decreasing tendency basi-
cally and the localized relative density of metal hydrides
powder in the same location increased with the wall fric-
tion factor. It indicates that the wall friction factor has
0 10203040506
0.400
0.402
0.404
0.406
0.408
0.410
0
k = 10 w/(m
k = 20 w/(m (Baseline)
k = 50 w/(m
Axial location away from Symmetry Axis (mm)
Relative density
Figure 15. Influence of alloy thermal conductivity (mass
transfer rate) in cycling compression effect.
0 10203040506
0.400
0.403
0.406
0.409
0.412
0.415
0
a= 10 vol%
a= 20 vol% (Baseline)
a= 30 vol%
Axial location away from Symmetry Axis (mm)
Relative density
Figure 16. Influence of alloy expansion in cycling compres-
sion effect.
Copyright © 2011 SciRes. EPE
X. C. HU ET AL.497
0 10203040506
0.400
0.403
0.406
0.409
0
Relative density
Axial location away from Symmetry Axis (mm)
= 0.15
= 0.2 (Baseline)
= 0.3
= 0.5
Figure 17. Influence of wall friction factors in cycling com-
pression effect.
promotion on the cycling compression effect. On the
other hand, the shape of curves makes a great difference
as shown in the figure: the larger the wall friction factor,
the straighter the curve in the location near the bottom of
the bed. This is mainly caused by the obstruction of fric-
tion force on the stretching motion of metal hydrides
powder during the absorption process. Larger friction
factor would limit the axial stretching of metal hydrides
powder. Furthermore, according to the generalized Hook’s
law, the radial expansion of metal hydrides powder in-
creases inevitably with larger friction factor, rising the
amount of compression up and finally resulting in the
growth of the localized relative density.
4.2.4.6. Initial Packing Rate
Figure 18 shows the effect of initial packing rate on
relative density in Path a after 5 cycles. Here, the rela-
tive density increment of metal hydrides is used in the
ordinate. As shown, if the initial packing rate is lower,
the relative density increment will become larger, which
means that the cycling compression effect presents much
more obvious.
0 10203040506
-2
0
2
4
6
8
0
Relative density increment (%)
= 20 vol%
= 40 vol% (Baseline)
= 60 vol%
Axial location (mm)
Figure 18. Influence of initial packing fractions in cycling
compression effect.
5. Conclusions
1) The stress accumulation in the metal hydrides reactors
is due to the interaction of pulverization-densification
effect and cycling compression effect. In the vertically-
set reactor, both effects cause the metal hydrides powder
gather to the bottom of the bed body.
2) In the vertically-set metal hydrides reactor, the cy-
cling compression effect becomes more obvious from the
top to the bottom. More and more fine particles are de-
positing to the bottom, making the relative density larger
and stress accumulation prominent. Hence, decreasing
the height of the reactor can reduce the stress.
3) The cycling compression effect is caused by both
the expansion of metal hydrides and friction force be-
tween metal hydrides powder and the bed wall. To re-
lieve the influence of cycling compression effect, it is
helpful to decrease cycle number, the slenderness ratio of
reactor, wall friction factor and initial packing rate. On
the metal hydrides side, the cycling compression effect
also can be decreased with the metal hydrides of lower
thermal conductivity and volume expansion coefficient.
6. Acknowledgements
The work has been supported by the National Natural
Science Foundation of China (NO. 50776094) and High-
Tech Research and Development Project of China (No.
2006AA05Z135). The authors thank the Institute of
Metal Research, Chinese Academy of Sciences, for ap-
plying the metal hydrides alloys.
7. References
[1] Y. Nakamura, K. Sato, S. Fujitani, K. Nishio, K. Oguro
and I. Uehara, “Lattice Expanding Behavior and Degra-
dation of Lani5-Based Alloys,” Journal of Alloys and
Compounds, Vol. 267, No. 1-2, 1998, pp. 205-210.
doi:10.1016/S0925-8388(97)00503-3
[2] B. Y. Ao, S. X. Chen and G. Q. Jiang, “A Study on Wall
Stresses Induced by Lani5 Alloy Hydrogen Absorp-
tion-Desorption Cycles,” Journal of Alloys and Com-
pounds, Vol. 390, No. 1-2, 2005, pp. 122-126.
doi:10.1016/j.jallcom.2004.05.092
[3] K. Nasako, Y. Ito, N. Hiro and M. Osumi, “Stress on a
Reaction Vessel by the Swelling of a Hydrogen Absorb-
ing Alloy,” Journal of Alloys and Compounds, Vol. 264,
No. 1-2, 1998, pp. 271-276.
doi:10.1016/S0925-8388(97)00246-6
[4] Q. D. Wang, J. Wu, C. P. Chen and Z. P. Li, “An Inves-
tigation of the Mechanical Behavior of Hydrogen Storage
Metal Beds on Hydriding and Dehydriding and Several
Methods of Preventing the Damage of Hydride Contain-
ers Caused by the Expansion of Hydrogen Storage Met-
als,” Journal of the Less-Common Metals, Vol. 131, No.
Copyright © 2011 SciRes. EPE
X. C. HU ET AL.
Copyright © 2011 SciRes. EPE
498
1-2. 1987, pp. 399-407.
doi:10.1016/0022-5088(87)90539-X
[5] T. Saito, K. Suwa and T. Kawamura, “Influence of Ex-
pansion of Metal Hydride during Hydriding-Dehydriding
Cycles,” Journal of Alloys and Compounds, Vol. 253-254,
1997, pp. 682-685. doi:10.1016/S0925-8388(96)02893-9
[6] K. Nasakao, Y. Ito, N. Hirot and M. Osumit, “Relaxation
of Internal Stress Generated in Hydrogen Absorbing Al-
loy Vessels,” International Journal of Hydrogen Energy,
Vol. 23, No. 10, 1998, pp. 921-929.
doi:10.1016/S0360-3199(97)00158-4
[7] F. T. Block, A. Dey, H. Kappes and K. Reith, “Hydrogen
Purification with Metal Hydrides in a New Kind of Re-
actor,” Journal of the Less-Common Metals, Vol. 131, No.
1-2, 1987, pp. 329-335.
doi:10.1016/0022-5088(87)90532-7
[8] O. Bernauer and C. Halene, “Properties of Metal Hy-
drides for Use in Industrial Applications,” Journal of the
Less-Common Metals, Vol. 131, No. 1-2, 1987, pp. 213-
224. doi:10.1016/0022-5088(87)90521-2
[9] MSC. Software Corporation, “MSC.Marc Volume A:
Theory and User Information,” Santa Ana, MSC. Soft-
ware Corporation, 2004.
[10] G. M. Ram and M. S. Srinivasa, “Experiments on a
Metal Hydride Cooling System Working with ZrMnFe/
MmNi4.5Al0.5pair,” International Journal of Refrigeration,
Vol. 22, No. 2, 1999, pp. 137-149.
[11] F. Qin, L. H. Guo, J. P. Chen and Z. J. Chen, “Pulveriza-
tion, Expansion of La0.6Y0.4Ni4.8Mn0.2 during Hydrogen
Absorption-Desorption Cycles and Their Influences in
Thin-Wall Reactors,” International Journal of Hydrogen
Energy, Vol. 33, No. 2, 2008, pp. 709-717.
doi:10.1016/j.ijhydene.2007.10.029