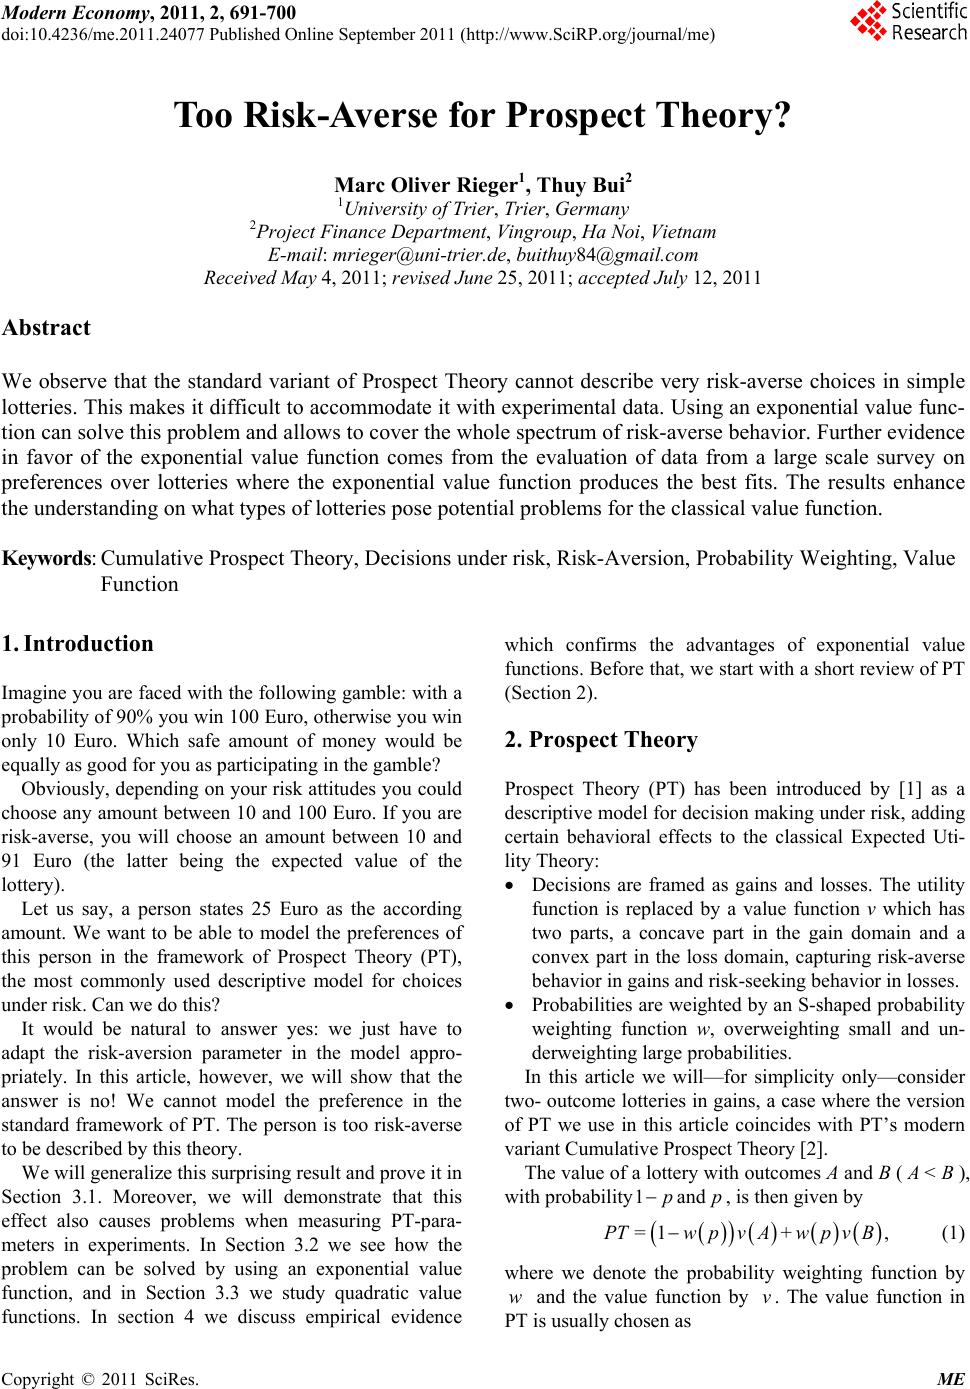
 Modern Economy, 2011, 2, 691-700 doi:10.4236/me.2011.24077 Published Online September 2011 (http://www.SciRP.org/journal/me) Copyright © 2011 SciRes. ME Too Risk-Averse for Prospect T h e o ry? Marc Oliver Rieger1, Thuy Bui2 1University of Trier, Trier, Germany 2Project Finance Department, Vingroup, Ha Noi, Vietnam E-mail: mrieger@uni-trier.de, buithuy84@gmail.com Received May 4, 2011; revised June 25, 2011; accepted July 12, 2011 Abstract We observe that the standard variant of Prospect Theory cannot describe very risk-averse choices in simple lotteries. This makes it difficult to accommodate it with experimental data. Using an exponential value func- tion can solve this problem and allows to cover the whole spectrum of risk-averse behavior. Further evidence in favor of the exponential value function comes from the evaluation of data from a large scale survey on preferences over lotteries where the exponential value function produces the best fits. The results enhance the understanding on what types of lotteries pose potential problems for the classical value function. Keywords: Cumulative Prospect Theory, Decisions under risk, Risk-Aversion, Probability Weighting, Value Function 1. Introduction Imagine you are faced with the following gamble: with a probability of 90% you win 100 Euro, otherwise you win only 10 Euro. Which safe amount of money would be equally as good for you as participating in the gamble? Obviously, depending on your risk attitudes you could choose any amount between 10 and 100 Euro. If you are risk-averse, you will choose an amount between 10 and 91 Euro (the latter being the expected value of the lottery). Let us say, a person states 25 Euro as the according amount. We want to be able to model the preferences of this person in the framework of Prospect Theory (PT), the most commonly used descriptive model for choices under risk. Can we do this? It would be natural to answer yes: we just have to adapt the risk-aversion parameter in the model appro- priately. In this article, however, we will show that the answer is no! We cannot model the preference in the standard framework of PT. The person is too risk-averse to be described by this theory. We will generalize this surprising result and prove it in Section 3.1. Moreover, we will demonstrate that this effect also causes problems when measuring PT-para- meters in experiments. In Section 3.2 we see how the problem can be solved by using an exponential value function, and in Section 3.3 we study quadratic value functions. In section 4 we discuss empirical evidence which confirms the advantages of exponential value functions. Before that, we start with a short review of PT (Section 2). 2. Prospect Theory Prospect Theory (PT) has been introduced by [1] as a descriptive model for decision making under risk, adding certain behavioral effects to the classical Expected Uti- lity Theory: Decisions are framed as gains and losses. The utility function is replaced by a value function v which has two parts, a concave part in the gain domain and a convex part in the loss domain, capturing risk-averse behavior in gains and risk-seeking behavior in losses. Probabilities are weighted by an S-shaped probability weighting function w, overweighting small and un- derweighting large probabilities. In this article we will—for simplicity only—consider two- outcome lotteries in gains, a case where the version of PT we use in this article coincides with PT’s modern variant Cumulative Prospect Theory [2]. The value of a lottery with outcomes A and B ( <B), with probability1p and , is then given by p 1, T=w pv A+wpvB (1) where we denote the probability weighting function by and the value function by . The value function in PT is usually chosen as w v  M. O. RIEGER ET AL. 692 0 , 0 () , 0 xx vx xx (2) where (the value measured by [2]) is called the “loss-aversion” coefficient, and describe the risk-attitudes for gains and losses. It should be mentioned that coefficients of α, which are fre- quently used in expected utility theory, cannot be used in prospect theory, since the function would diverge to 2.25λ ,αβ 0< at zero and hence could not be extended to negative outcomes (losses). The standard weighting function is 1 := 1 γ γ γ γ p wp p+ p (3) with the parameter describing the amount of over- and underweighting. γ Although PT as a whole is nowadays the most successful theory to describe decisions under risk, the specific choice of the functions and has been criticized for various reasons: v w First, it is important to keep in mind that a certain proportion of subjects (around 20%) shows no sign of probability weighting at all and could be better mo- deled by expected utility theory [3]. The standard probability weighting function w be- comes non-monotone for small values of γ [4,5].1 The classic value function v leads to non-existence of equilibria in a financial market of PT-maximizers, a problem that can be solved by using exponential value functions [4]. The interplay of value and weighting functions causes problems akin to the St. Petersburg Paradox, which can either be solved by using an exponential value function or a modified probability weighting function [5]. Loss aversion cannot be defined when α [9]. This problem can be solved by using an alternative value function, e.g. an exponential value function. In this article we provide more evidence in favor of an exponential value function instead of the typical power function (2): we show that the standard choice of a value function severely limits the amount of risk-aversion that can be explained with PT (see Proposition 1). As we have already pointed out, people might show a degree of risk-aversion that cannot be modeled within the standard version of PT. This makes it difficult to fit the theory to some of the experimental data (Section 3.1). The quadratic utility function, which has played a prominent role in finance, displays the same limitation (Section 3.3). We demonstrate that an exponential value function does not show this problem (Section 3.2). Finally we report results from a large-scale survey that confirms some fitting advantage of the exponential value function. May- be more important is that the survey also demonstrates in what cases an advantage of an exponential value function is most visible and—particularly—where not (Section 4). 3. Limits to Risk-Av ersion in Prospect Theory 3.1. Standard Value Function Let us neglect for a moment the effects of probability weighting. Then the parameter 01α, in the defi- nition of the value function describes the risk-aversion of a person: a small corresponds to a high risk aversion, a large is a sign for low risk-aversion, corre- sponds to risk-neutral behavior. α α1α= If we undertake simultaneous probability weighting, the interplay between the parameters becomes more in- volved. Nevertheless, the rule remains so that decreasing values of will increase the risk-aversion. More precisely, for a given two-outcome lottery, the certainty equivalence (CE) of the lottery will decrease, when we decrease . α α In the following we assume that a person, who decides about the CE of a two-outcome lottery, will respect “in-betweenness”, i.e. never choose a CE outside the interval between A and B.2 When faced with a two- outcome lottery with positive outcomes A and B (where <B), a person’s CE is therefore bounded from below by A. However, the CE could a priori be arbitrarily close to A, if the person is strongly risk-averse. Is it possible to model such behavior in the standard form of PT? Surprisingly, the following proposition gives a negative answer: Proposition 1. In the standard form of PT, a two- outcome lottery with positive outcomes A and B (where <B 1wp ) has a CE that is always larger than wp B , where p is the probability of the outcome B. This bound is in particular strictly larger than A. The proof of this proposition can be found in the appendix. Proposition 1 implies that even an extremely risk- averse person with close to zero can never show a CE close to A. In fact, the CE of this person must still be considerably above A. As a numerical example we use the lottery from the introduction where A = 10, B = 100 and p = 0.9 and assume that (which is α 0.9 0.5w= 2Cumulative Prospect Theory (and therefore also the form of PT we use in this article for two-outcome lotteries) satisfies this assumption inde- endently from the choice of the value- and weighting function, thus we will never get a CE outside the interval (A,B) [14]. 1Alternative formulations for w that do not have this problem has been suggested for CPT, e.g., in [6] and for PT, e.g., in [7] and [8]. Copyright © 2011 SciRes. ME  M. O. RIEGER ET AL.693 probably a low estimate3). Then 132 wp wp AB=AB . A person with a CE below 32 is too risk-averse to be described by PT, whatever “risk-aversion” we choose! Is this surprising im- plication of the standard PT-model compatible with experiments? α Firstly, we note that many experiments involve only one positive outcome, i.e. A=0. In this case, , thus the problem does not arise. There are, however, also experimental data for 10 wp wp AB 0 >. Such lotteries can already be found in the article of [2]. It is, of course, possible to circumvent the problem by shifting the reference point to the lower outcome, thus effectively only considering gambles with A = 0 (with respect to the reference point). With this trick any amount of risk-averseness can be explained within the framework of standard PT for two-outcome lotteries. There are, however, two major concerns about this ad hoc method: First, one might complain that this would not be problem solving, but rather “sweeping the pro- blem under the carpet” by arbitrarily changing the re- ference point. Second, the question of what to do if there is a third outcome arises, e.g. 0, with a very low pro- bability. Then the trick is not applicable and we are left in the same situation as before. In short, it is difficult or impossible to define a consistent rule to choose the re- ference point that circumvents the problem we have encountered. Therefore, we decided to refrain from changing the reference point. But we still haven’t seen whether the theoretical bound of risk-averseness is a practical problem. In other words: are there people who are so risk-averse that their behavior cannot be explained within the standard for- mulation of PT? To check this, we had a look at the lotteries with 0 > in the data of [2] and computed the lower bound for the CE in their model with their parameters (in- cluding their probability weighting parameter) for all lotteries with outcomes . Then we compared the results with the median answer of their respondents. Moreover, we computed the percentage of respondents who gave a CE below the theoretical threshold. In other words: the percentage of participants for each question who could not be described by the standard form of PT. (The detailed results are given in the appendix, see Table 1). 0<A<B For many answers (a total of 28%, but for some questions up to 48%) the standard form of PT cannot describe the high levels of risk-aversion measured in this experiment. Only due to the asymmetry of the weighting function (i.e. 11wp wp ) the standard form of PT can at least describe the median level of risk-aversion: if we omit the probability weighting and take a look at the cases where (i.e. we assume a symmetric ), we get lower bounds for the CE which are above the measured median CEs. In other words, asymmetric pro- bability weighting is in fact needed to “repair” the pro- blems induced by the value function. 0.5p= B w We summarize this in the following remark: Remark 1. Proposition 1 is also relevant regarding probability weighting, since it induces an asymmetric choice of . The variable assigns smaller weights to the larger outcome and larger weights to the smaller outcome w w , to bring the bound 1wp wp B closer to . In other words, has to be consis- tently smaller than and hence to be asymmetric. Given our analysis above, it is not surprising that our experiments have mostly shown that this asymmetry is in fact needed, although conceptually, a symmetric function may be more appealing. wp p The effect shown in the data of Tversky and Kahne- man, becomes even more visible when we consider lotte- ries where the probability for the higher outcome is very large, and at the same time p is relatively small. We encountered this problem in data with undergraduate students, which will be discussed in detail in the next section. We used two lottery questions of this type, where we asked for the willingness to pay, and the majority of students reported a CE below the theoretical threshold, even for small values of . (The weighting function becomes non-monotone for too small values of , hence it is not possible to set smaller than appro- ximately 0.4.) We report the most important findings from our preliminary data in the appendix, see Table 2. 5,185N= γ γ γ These results underline once more the gravity of the problem when measuring PT-values experimentally. 3.2. Exponential Value Functions Obviously, it would be better to have an index for risk- aversion that covers the full range of possible risk-averse behavior, i.e. can be chosen so that in the above two- outcome lottery every CE larger than can be reached. In this section we show that this is possible if we only change the value function and use -instead of the standard version- an exponential function, as suggested by e.g. [4] and [9]. Let us define 1 :=vx e, 0, e, 0, x x x x (4) 3If we use (3) with γ = 0.4, we obtain w(0.9) ≈ 0.45. This is already close to the lowest possible value for γ [11], and much smaller than typical measurements. where 0α, and 0β, . Copyright © 2011 SciRes. ME 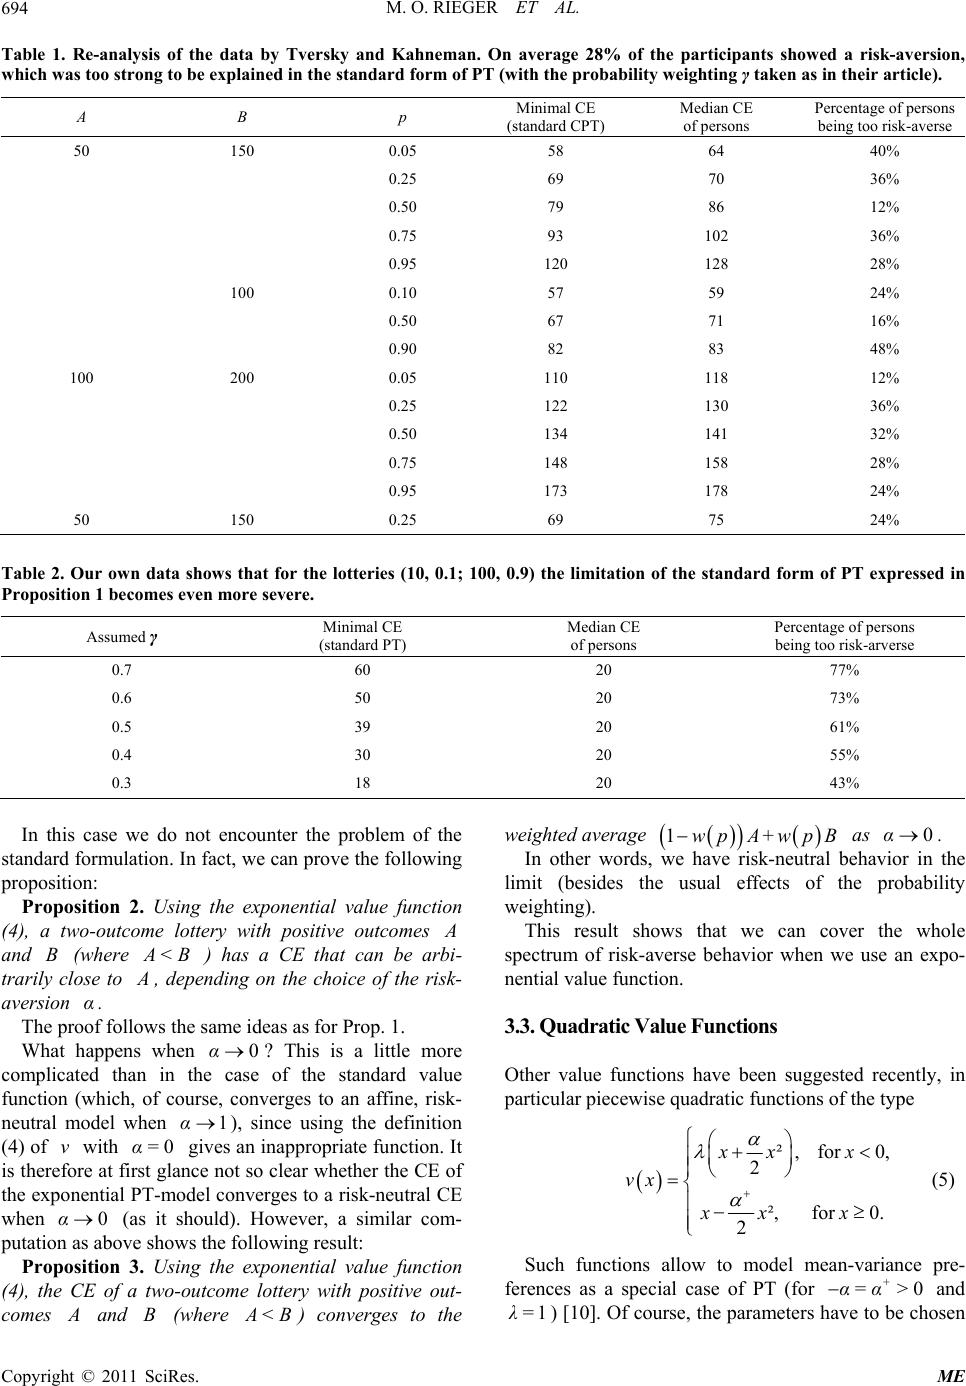 M. O. RIEGER ET AL. Copyright © 2011 SciRes. ME 694 Table 1. Re-analysis of the data by Tversky and Kahneman. On average 28% of the participants showed a risk-aversion, which was too strong to be explained in the standard form of PT (with the probability weighting γ taken as in their article). A B p Minimal CE (standard CPT) Median CE of persons Percentage of persons being too risk-averse 50 150 0.05 58 64 40% 0.25 69 70 36% 0.50 79 86 12% 0.75 93 102 36% 0.95 120 128 28% 100 0.10 57 59 24% 0.50 67 71 16% 0.90 82 83 48% 100 200 0.05 110 118 12% 0.25 122 130 36% 0.50 134 141 32% 0.75 148 158 28% 0.95 173 178 24% 50 150 0.25 69 75 24% Table 2. Our own data shows that for the lotteries (10, 0.1; 100, 0.9) the limitation of the standard form of PT expressed in Proposition 1 becomes even more severe. Assumed γ Minimal CE (standard PT) Median CE of persons Percentage of persons being too risk-arverse 0.7 60 20 77% 0.6 50 20 73% 0.5 39 20 61% 0.4 30 20 55% 0.3 18 20 43% In this case we do not encounter the problem of the standard formulation. In fact, we can prove the following proposition: Proposition 2. Using the exponential value function (4), a two-outcome lottery with positive outcomes and (where B <B ) has a CE that can be arbi- trarily close to , depending on the choice of the risk- aversion . α The proof follows the same ideas as for Prop. 1. What happens when ? This is a little more complicated than in the case of the standard value function (which, of course, converges to an affine, risk- neutral model when ), since using the definition (4) of with gives an inappropriate function. It is therefore at first glance not so clear whether the CE of the exponential PT-model converges to a risk-neutral CE when (as it should). However, a similar com- putation as above shows the following result: 0α 1α v α 0α= 0 Proposition 3. Using the exponential value function (4), the CE of a two-outcome lottery with positive out- comes and (where B <B) converges to the weighted average 1wp A+wpB as . 0α In other words, we have risk-neutral behavior in the limit (besides the usual effects of the probability weighting). This result shows that we can cover the whole spectrum of risk-averse behavior when we use an expo- nential value function. 3.3. Quadratic Value Functions Other value functions have been suggested recently, in particular piecewise quadratic functions of the type ², for 0, 0. +0α> 2 ², for 2 xx x vx xx x (5) Such functions allow to model mean-variance pre- ferences as a special case of PT (for and ) [10]. Of course, the parameters have to be chosen α= 1λ= 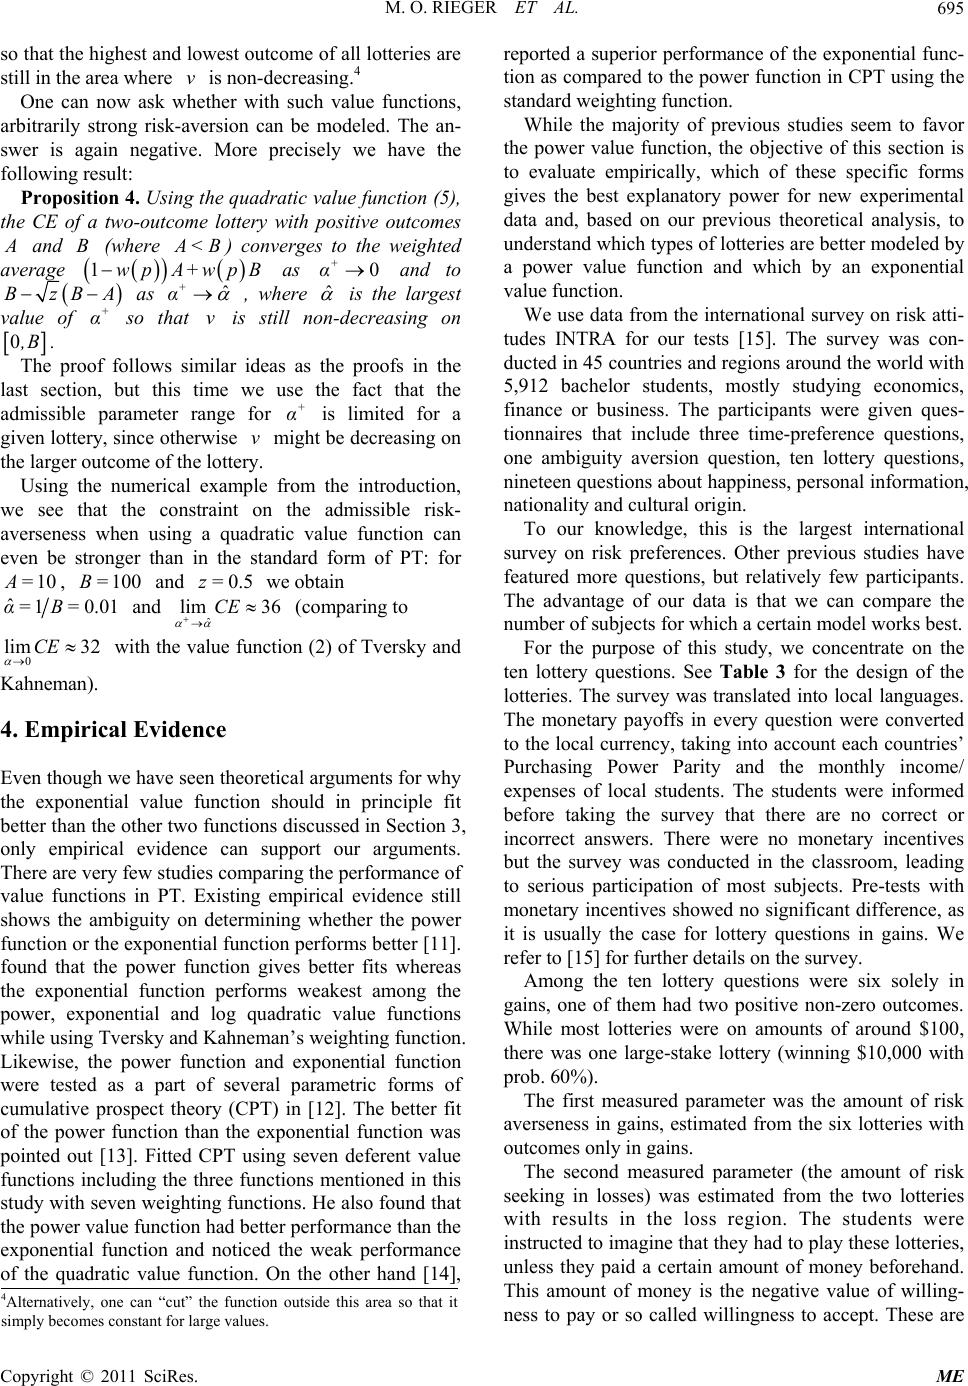 M. O. RIEGER ET AL.695 so that the highest and lowest outcome of all lotteries are still in the area where is non-decreasing.4 v One can now ask whether with such value functions, arbitrarily strong risk-aversion can be modeled. The an- swer is again negative. More precisely we have the following result: Proposition 4. Using the quadratic value function (5), the CE of a two-outcome lottery with positive outcomes and (where B <B w ) converges to the weighted average as and to wp pB1A+ +0α A+ˆ α BzB as , where ˆ is the largest value of so that is still non-decreasing on + αv 0,B . The proof follows similar ideas as the proofs in the last section, but this time we use the fact that the admissible parameter range for is limited for a given lottery, since otherwise might be decreasing on the larger outcome of the lottery. + α v Using the numerical example from the introduction, we see that the constraint on the admissible risk- averseness when using a quadratic value function can even be stronger than in the standard form of PT: for 10 =, and we obtain 100B= 0.5z= ˆ10.0α=B= 1 and ˆ 36CE lim (comparing to 0 lim 32CE with the value function (2) of Tversky and Kahneman). 4. Empirical Evidence Even though we have seen theoretical arguments for why the exponential value function should in principle fit better than the other two functions discussed in Section 3, only empirical evidence can support our arguments. There are very few studies comparing the performance of value functions in PT. Existing empirical evidence still shows the ambiguity on determining whether the power function or the exponential function performs better [11]. found that the power function gives better fits whereas the exponential function performs weakest among the power, exponential and log quadratic value functions while using Tversky and Kahneman’s weighting function. Likewise, the power function and exponential function were tested as a part of several parametric forms of cumulative prospect theory (CPT) in [12]. The better fit of the power function than the exponential function was pointed out [13]. Fitted CPT using seven deferent value functions including the three functions mentioned in this study with seven weighting functions. He also found that the power value function had better performance than the exponential function and noticed the weak performance of the quadratic value function. On the other hand [14], reported a superior performance of the exponential func- tion as compared to the power function in CPT using the standard weighting function. While the majority of previous studies seem to favor the power value function, the objective of this section is to evaluate empirically, which of these specific forms gives the best explanatory power for new experimental data and, based on our previous theoretical analysis, to understand which types of lotteries are better modeled by a power value function and which by an exponential value function. We use data from the international survey on risk atti- tudes INTRA for our tests [15]. The survey was con- ducted in 45 countries and regions around the world with 5,912 bachelor students, mostly studying economics, finance or business. The participants were given ques- tionnaires that include three time-preference questions, one ambiguity aversion question, ten lottery questions, nineteen questions about happiness, personal information, nationality and cultural origin. To our knowledge, this is the largest international survey on risk preferences. Other previous studies have featured more questions, but relatively few participants. The advantage of our data is that we can compare the number of subjects for which a certain model works best. For the purpose of this study, we concentrate on the ten lottery questions. See Table 3 for the design of the lotteries. The survey was translated into local languages. The monetary payoffs in every question were converted to the local currency, taking into account each countries’ Purchasing Power Parity and the monthly income/ expenses of local students. The students were informed before taking the survey that there are no correct or incorrect answers. There were no monetary incentives but the survey was conducted in the classroom, leading to serious participation of most subjects. Pre-tests with monetary incentives showed no significant difference, as it is usually the case for lottery questions in gains. We refer to [15] for further details on the survey. Among the ten lottery questions were six solely in gains, one of them had two positive non-zero outcomes. While most lotteries were on amounts of around $100, there was one large-stake lottery (winning $10,000 with prob. 60%). The first measured parameter was the amount of risk averseness in gains, estimated from the six lotteries with outcomes only in gains. The second measured parameter (the amount of risk seeking in losses) was estimated from the two lotteries with results in the loss region. The students were instructed to imagine that they had to play these lotteries, unless they paid a certain amount of money beforehand. This amount of money is the negative value of willing- ness to pay or so called willingness to accept. These are 4Alternatively, one can “cut” the function outside this area so that it simply becomes constant for large values. Copyright © 2011 SciRes. ME  M. O. RIEGER ET AL. Copyright © 2011 SciRes. ME 696 Table 3. Design for the ten lotteries in INTRA. Lottery Outcome A($) Prob(A) Outcome B($) Prob(B) Average Value($) 1* 10 0.1 100 0.9 91 2 0 0.4 100 0.6 60 3 0 0.1 100 0.9 90 4** 0 0.4 10,000 0.6 6000 5 0 0.9 100 0.1 10 6 0 0.4 400 0.6 240 7 –80 0.6 0 0.4 –48 8 –100 0.6 0 0.4 –60 9 –25 0.5 - 0.5 - 10 –100 0.5 - 0.5 - *type A-lottery (two positive outcomes); **type B-lottery (large stake). lottery 6 and lottery 7 in Table 3. The third measured parameter was the loss-aversion parameter, based on the two last lotteries by the following question: In the following lotteries you have a 50% chance to win or lose money. The potential loss is given. Please state the minimum amount $X for which you would be willing to accept the lottery. We excluded those individuals who had not completed all the lotteries, leaving 5,185 subjects for our analysis. We used the grid search method to estimate all the parameters for the weighting function and value functions by minimizing the sum of normalized errors, where the parameter values of α, varied from 0 to 1 for the standard value function, from 0 to 0.1 for the exponential function and from 0 to .005 for the quadratic value function5, and varied from 0 to 1. Parameters were predicted on an individual level to each of three models to access the functional performance individually. The error function was defined as the sum of the absolute differences between the CE and the maximum outcomes of the lotteries. The normalized errors are the proportion of those differences and the lottery’s maximum outcome for each lottery. γ To study the specific effect of lotteries with two positive outcomes (type A) and of large-stake lotteries (type B), we computed the best fitting models for three scenarios: No lotteries of type A and B. / No lottery of type B. / All lotteries. According to our theoretical results, type A lotteries should favor exponential value functions as might type B lotteries. The results are shown in Figure 1. We can see that when removing the type A lottery (with two positive outcomes) and the type B lottery (with large outcome) the power value function works better than the exponential function. However, the exponential value function outperforms the power value function when plugging in the lottery with two positive outcomes, or both the lottery with two positive outcomes and the lottery with the large outcome. A paired t-test of the average ranks to collate the performance of power and exponential value functions is highly significant at 5184 11.13t= with 6, which shows that in this case the exponential function is better. The frequency, in which the quadratic value function works best, is very low (about 1%). 0.0001p< The important lesson to learn from this result is that the optimal choice of the value function strongly depends on the lotteries in the experiment! 5. Conclusions We have seen that the standard form of PT faces severe problems when people show strong risk-aversion, since the smallest possible CE according to this theory is still substantially above the lowest lottery outcome, when considering lotteries with two positive outcomes. This makes it impossible to describe very risk-averse behavior correctly. Experimental data shows that such degree of risk-aversion is quite frequent and not a marginal pheno- menon. The problem is mitigated by the asymmetry of the weighting function and one can conjecture that it is the main reason for why this asymmetry is needed. The difficulties disappear completely when replacing the standard power value function by an exponential func- tion. This description allows to cover all degrees of risk- aversion which do not violate “in-betweenness”. Another advantage of experimental value functions can be found for large-stake gambles, as our empirical results show. As in many experiments, both types of lotteries (with 5The value has to be bounded from below to avoid non-monotonic value functions on the relevant range of outcomes. 6All models are ranked individually using the errors calculated as ex- lanatory performance 1 as best performance, 3 as worst performance.  M. O. RIEGER ET AL. Copyright © 2011 SciRes. ME 697 Figure 1. Frequency of best fitting mode l. two positive outcomes or with large outcomes) are miss- ing, the advantages of an experimental value function are often overlooked. These results have practical implications to the design and measurement of lotteries in PT and give further theoretical and empirical support in favor of an expo- nential value function. Our results carry over to the case of lotteries in losses. (Here, arbitrarily large risk-seeking behavior needs to be modeled. Since the value function is essentially anti- symmetric, the above computations can be reused.) The case of mixed lotteries (in gains and losses) is not of interest, since risk-seeking in losses and risk-averse- ness in gains cancel each other out to some degree, and loss-aversion can explain a large risk-aversion in such cases. It is also possible to extend our results to lotteries with several outcomes, which makes the computations a little more tedious, but does not change the main results and their arguments substantially. 6. Acknowledgments We thank Anke Gerber, Thorsten Hens, Mei Wang and Frank Riedel for their valuable input to this work. Finan- cial support by the Institute of Mathematical Economics at the University of Bielefeld, the National Centre of Competence in Research “Financial Valuation and Risk Management” (NCCR FINRISK), Project 3, “Evolution and Foundations of Financial Markets”, and by the Uni- versity Research Priority Program “Finance and Finacial Markets” of the University of Zurich is gratefully ac- knowledged. 7. References [1] D. Kahneman and A. Tversky, “Prospect Theory: An Analysis of Decision under Risk,” Econometrica, Vol. 47, No. 2, 1979, pp. 263-291. [2] A. Tversky and D. Kahneman, “Advances in Prospect Theory: Cumulative representation of Uncertainty,” Jour- nal of Risk and Uncertainty, Vol. 5, No. 4, 1992, pp. 297-323. [3] A. Bruhin, H. Fehr-Duda and T. Epper, “Risk and ration- ality: Uncovering Heterogeneity in Probability Distor- tion,” Econometrica, Vol. 78, No. 4, 2010, pp. 1375-1412. [4] E. de Giorgi, H. Levy and T. Hens, “Existence of CAPM Equilibria with Prospect Theory Preferences,” Preprint 157, Institute for Empirical Economics, University of Zu- rich, 2004. doi:10.2139/ssrn.420184 [5] M. O. Rieger and M. Wang, “Cumulative Prospect The- ory and the St. Petersburg Paradox,” Economic Theory, Vol. 28, 2006, pp. 665-679. doi:10.1007/s00199-005-0641-6 [6] D. Prelec, “The Probability Weighting Function,” Econo- metrica, Vol. 66, 1998, pp. 497-527. [7] U. S. Karmarkar, “Subjectively Weighted Utility: A De- scriptive Extension of the Expected Utility Model,” Or- ganizational Behavior and Human Performance, Vol. 21, No. 1, 1978, pp. 61-72. doi:10.1016/0030-5073(78)90039-9 [8] M. O. Rieger and M. Wang, “Prospect Theory for Con- tinuous Distributions,” Journal of Risk and Uncertainty, Vol. 36, No. 1, 2008, pp. 83-102. doi:10.1007/s11166-007-9029-2 [9] V. Köbberling and P. P. Wakker, “An Index of Loss Aversion,” Journal of Economic Theory, Vol. 122, 2005,  M. O. RIEGER ET AL. 698 pp. 119-131. [10] V. Zakalmouline and S. Koekebakker, “A Generalization of the Mean-Variance Analysis,” SSRN Working Paper, 2008. [11] C. Camerer and T.-H. Ho, “Violations of the betweenness Axiom and Nonlinearity in Probability,” Journal of Risk and Uncertainty, Vol. 8, No. 2, 1994, pp. 167-196. [12] M. Birnbaum and A. Chavez, “Tests of Theories of Deci- sion Making: Violations of Branch Independence and Distribution Independence,” Organizational Behavior and Human Decision Processes, Vol. 71, No. 2, 1997, pp. 161-194. [13] H. Stott, “Cumulative Prospect Theory’S Functional Me- nagerie,” Journal of Risk and Uncertainty, Vol. 32, No. 2, 2006, pp. 101-130. doi:10.1007/s11166-006-8289-6 [14] S. Blondel, “Testing Theories of Choice under Risk: Es- timation of Individual Functionals,” Journal of Risk and Uncertainty, Vol. 24, No. 3, 2002, pp. 251-265. doi:10.1023/A:1015687502895 [15] M. Wang, M. O. Rieger and T. Hens, “Prospect Theory around the World,” SSRN Working Paper, 2011. [16] A. Mas-Colell, M. D. Whinston and J. R. Green, “Micro- economic Theory,” Oxford University Press, Oxford, 1995. Copyright © 2011 SciRes. ME  M. O. RIEGER ET AL.699 Appendix Proof of Proposition 1 Let the probability for the outcome be given by and denote . Then the CE of the lottery is in general given by B p :=zwp 11CE=vzvA+ zvB , where denotes the inverse map of , i.e. . 1 v x v 1 vv =x In the standard form of PT, this becomes 1 1a αα CE =zA+ zB. Although conceptually unrelated, this expression is mathematically equivalent to the CES (constant elasticity of substitution) utility function of two goods as given by 1 1211 22 ρρ ux,x =αx+αx (with constants , 2). The limit of the CES utility preferences for is the preference described by the Cobb-Douglas utility function 1 α ρ α 0 12 12 uxxx [16, page97]. This result implies Proposition 1. Alternatively, a direct proof can be given by computing the limit of the certainty equivalent for via a Taylor expansion. □ 0α Proof of Proposition 2 To prove this result, we first note that the new risk- aversion parameter α scales differently than before: high risk-aversion corresponds to a large value of , low risk-aversion corresponds to an close to zero. In fact, the CE decreases monotonically in which we can prove as follows: compute the CE of the lottery, set, as before, α α α :=zwp α , multiply (for computational con- venience) by and take the derivative with respect to to obtain α dd ln 1ee dd 1e e 1 =ln1ee1e e) AB AB AB AB CEz z Az Bz zz zz . Using the strict concavity of the logarithm and bring- ing both resulting terms on the some denominator, we arrive at 2222 2 eeeee d. d1e e1e e αAαBαBαAαAαB αAαBαAαB Azz+Bz zAzzBz zAB CEz z z+z z+z e Since and , this expression is negative, and thus the CE is monotonically decreasing in . We compute its limit as using the refor- mulation 01z,B>A αα 1ln 1ee 1 lne1e 1 lneln1e 1 =ln1e1. αAαB αBA αA αBA αA αBA CEz+ z α z+z α +z+z α A+z α Since and 0α> <B 1z< , we have , and therefore we obtain the following two inequalities, where we recall that and thus ln : e0 αBA , 1z> 1 ln 1ln 1e10. αBA z< +z< Inserting these inequalities into (6), we obtain bounds for the CE, namely: 1ln 1. <CE<A z α As , the right hand side converges to α , and thus and Proposition 2 is proved. □ limCE =A Proof of Proposition 3 We start from the CE and frstly expand the exponential function and then the logarithm: 2 2 1ln1 1ln 11 11 1. αAαB CEze+ ze α =+zAzBα+O α α zA zBα+Oα α =zA+zB+Oα The limit concludes the proof of Proposition 3. □ 0α Original Survey Questions The lottery questions in the INTRA survey were formu- lated as follows: Imagine you are offered the Lotteries below. Please indicate the maximum amount you are willing to pay for the lottery. Copyright © 2011 SciRes. ME  M. O. RIEGER ET AL. 700 Lottery 1 10% chance Win 4 £ 90% chance Win 40 £ I am willing to pay at most £____ to play the lottery. The lotteries themselves can be found in Table 3. Copyright © 2011 SciRes. ME
|