 Modern Economy, 2011, 2, 625-632 doi:10.4236/me.2011.24070 Published Online September 2011 (http://www.SciRP.org/journal/me) Copyright © 2011 SciRes. ME Performance of Family and Non-family Firms with Self-Selection: Evidence from Dubai Belaid Rettab1, Azzeddine Azzam1,2,3 1Dubai Chamber of Commerce & Industry, Dubai, UAE 2University of Dubai, Dubai, UAE 3University of Nebraska-Lincoln, Lincoln, Nebraska, USA E-mail: belaid.rettab@dubaichamber.ae Received April 24, 2011; revised June 20, 2011; accepted June 30, 2011 Abstract This paper contributes to the literature on comparative performance of family and non-family businesses by accounting for self-selection and by comparing performance within and across sectors. Using an extensive data set of Dubai businesses in the four different major sectors in the Dubai economy (construction, manu- facturing, services, and trading); we find that the sector matters. Family businesses outperform nonfamily businesses in trading, followed by construction as a far second. Performance of family businesses is weakest in manufacturing and services, only in trading did family businesses outperform nonfamily exporting busi- nesses in other sectors. Reasons for that are discussed and policy implications are drawn. We also find strong evidence of self-selection bias. Keywords: Business Comparative Performance, Family Businesses, Self-Selection, Sector Performance, Dubai Enterprises 1. Introduction In their overview of family business performance, Jackiewicz and Klein (2005) [1] report that of the 41 studies that compared family to nonfamily businesses, 25 find the former outperform the latter, 5 find the opposite, and 11 find no significant difference between the two types of firms. Dyer (2006) [2] argues that such differ- ences in results are not surprising given the differences in approaches and definitions of family enterprises (see also [3-7]). What is surprising, however, is that, as far as we know, none of the studies controlled for self-selection bias [8] and most do not assess differences in performance within and across industries. If selection bias is present, the ob- served differences in firm performance are attributed to business type when they may be due to differences be- tween the entrepreneurs who chose between the two types of business structures. Similarly, if a business’ amenability to family versus nonfamily management hinges on the type of industry, it is crucial to have indus- try an additional contextual variable. In this paper we use an extensive data set of Dubai businesses to test for differences in family versus non- family firms within and across the four major sectors in the Dubai economy (construction, manufacturing, ser- vices, and trading). Dubai is a particularly interesting and representative case study of the Gulf region, where, until the recent financial crisis, economic growth has been phenomenal and little is known about the relative per- formance of family businesses and thereby their relative contribution to such growth. Family businesses comprise most of the enterprises in the Gulf region [9]. They ac- count for over 90% of all commercial activities in the Gulf region, compared to rates ranging from 65% to 80% in other regions of the world. The remainder of the article is organized as follows. The next section reviews and discusses the literature on comparative performance of family and nonfamily firms. Section 3 defines a family business in general, and Sec- tion 4 develops a working definition for a family busi- ness in Dubai. Section 5 presents the data, method, and results. Section 6 summarizes and concludes. 2. Family versus Non-family Performance Casting comparative performance of firms in terms of family versus non-family businesses is a useful approach  B. RETTAB ET AL 626 to capturing the influence of business structure on busi- ness performance. One particularly important element of structure, discussed extensively in the literature, is the degree of ownership and management control [2,10-13]). It is generally accepted that concentration of control can bring about economic entrenchment and misalloca- tion of resources [14]. Misallocation is attributed to the well-known principle-agent problem but also to the prin- cipal-principal conflict emphasizing the problem of mi- nority shareholders [15,16]). The latter conflict is com- monly present in emerging economies with institutions that encourage control and tolerate bad corporate gov- ernance. In this context, does high concentration of con- trol, as exhibited by a family enterprise, affect firm per- formance? And what is the role of the supporting institu- tions operating in the background? On one hand, institutions are found to significantly determine business performance [17-20]. On the other hand, in the absence of sound institutions and regulatory framework, is ownership and control able to provide a less enforced, but equally potent, internal regulatory en- vironment for business? In China for example, it is re- ported that family businesses provide alternative frame- work for businesses to “reduce risk in uncertain, complex and potentially hostile environments” [21]. Furthermore, the degree of concentration of ownership and control is motivated by business strategies, strategies to manage risks stemming from surrounding institutions. Minority shareholders in publicly owned companies have, in general, highly diversified investment portfolios and are therefore considered more likely to accept potentially risky ventures in return for lucrative earnings. Con- versely, the owner of a family firm is likely to have a more concentrated investment portfolio, holding a high proportion of personal wealth within the own firm [11,22-24]). Consequently, does this excessive cautious behaviour hinder family firm performance [12,22], and results in sub-optimal capital asset structure and per- formance? Some researchers [3] suggest that due to corporate governance issues, such as the lack of transparency and accountability, family enterprises remain small and, therefore, have less access to capital. However, the evi- dence is inconclusive across samples. Jorissen et al. (2005) [25] report that once demographic differences are controlled for, family firms face more financing prob- lems than non-family firms with regards to long- term financing [4,23]. In this connection, Anderson and Reeb (2003) [4] contend that family owners are predominantly concerned with “stability and capital preservation” rather than firm growth, performance and size. However, if stability is used as an indicator of firm performance, Lee (2006) [26] would agree and Suehiro (2001) [27] would disagree that family firms are more stable in times of economic downturn than non-family enterprises. What transpires from the previous discussion is that, because of the several characteristics of family versus nonfamily firms and the interaction between those char- acteristics, there is no clear a priori expectation that one type of firm should outperform the other. That expecta- tion becomes less clear when considering contextual variables such as firm size and industry. Hence, relative performance of family versus non-family firms is an em- pirical question, and preponderance of evidence from different studies is what ultimately shapes the metaview of the superiority of one business over the other. Our empirical analysis for Dubai is a contribution to shaping that metaview. Our starting point is to discuss in the next section the different definitions for a family business used in the literature. After that we discuss our definition of what constitutes a family business in Dubai. 3. Definition of a Family Business The assortment of family business attributes outlined in section 2 has led to an assortment of definitions of a family business in the literature. In their survey of family business literature, Chua et al. (1999) [28] found 21 dif- ferent definitions. Basically, family business attributes are related to one of three components: family, ownership, and manage- ment; and the definition of a family business depends on the overlap of the three. This is illustrated in the Venn diagram in Figure 1. The three components plus the four overlapping areas constitute seven possible connections, with each connection tied to some degree of influence. Individuals with only one connection to the business would lie in 1, 2, or 3, and those with more than one connection would lie in any of the other intersections. For example, intersections 4, 5, and 7 identify family members who are directly involved in the business man- agement and its ownership. Intersections 2, 3, and 6 in- clude managers, employees and possible co-owners from outside the family. Several examples from the literature will serve to il- lustrate how different authors in different contexts have devised different definitions based on the overlapping components shown in the Venn diagram. Westhead and Cowling (1997) [6] suggested the following 7 definitions for a family business: 1) The enterprise is perceived by the chief executive, managing director, or chairman to be a family business. 2) More than 50% of ordinary voting shares are owned by members of the largest single-family group related by blood or marriage. 3) 1 and 2 4) 3 and one or more of the management team is Copyright © 2011 SciRes. ME  B. RETTAB ET AL627 Family Ownershi p Business 1 5 6 4 2 3 7 Figure 1. Overlapping Components of a Family Business. Source: Gersick et al., (1997) [29]. drawn from the largest family group that owns the busi- ness 5) 3 and 51% or more of the management team is drawn from the largest family group that owns the busi- ness 6) 4 and the enterprise is owned by second-generation or family members 7) 5 and the enterprise is owned by second-generation or family members 4. Definition of a Family Business in the Context of Dubai The preceding conceptual framework and applications not only require information on family membership, de- gree of ownership and management by family members; they also require establishing a cut-off point at which the degree of influence is significant enough to designate a business as a family business. Unfortunately, that infor- mation is not available for Dubai What is available is a categorization of family versus non-family businesses in Dubai devised by Rettab (2008) [30] (Table 1 ). The definition draws on UAE’s company law which requires 51% ownership of a business by UAE nationals, and on labour law regulating em- ployer-employee1 relationship. According to Table 1, a business that is more than 50% owned and managed by UAE nationals is defined as a family business, while all other businesses are defined as non-family businesses. The underlying rationale is as follows. A business that is fully owned by UAE nationals in almost all cases belongs to one single UAE national owner, regardless of the size of the business. Hence, all Table 1. Categories of UAE Owned Businesses in Dubai according to ownership, Management, and Number of Owners and Managers. Defini- tions1 Numbers of Owners and Managers Ownership Management Category 3 1 100% Family 100% Family One-Man Family Business 2 2 > 50% Family 100% Family or Shared Family Business 4 2 > 50% Family 100% Non-Family Non-Family Business (The Sponsorship System) 1 > 50% Family 100% Family or Shared 1st Category Family Business > 50% Family 100% Non-Family Non-Family Business (The Sponsorship System) < 50% Family 100% Family or Shared Non-Family Business 5 3 or more < 50% Family 100% Non-Family Non-Family Business 1 Numbers in column refer to the categories by Westhead and Cowling (1997) [6]. Source: Rettab (2008) [30]. fully UAE national owned businesses are family busi- nesses. Defining businesses with a share of foreign equity as non-family businesses is supported by the roles of the UAE partner in the day-to-day management of the busi- ness. There are three roles. One, in almost all small businesses (less than 10 workers) with foreign equity, the formal owner of the license is the so-called the UAE national sponsor or the silent partner. The partnership is a well established sponsorship system enforced by law. In this case, since the capital is wholly provided by the foreign partner(s) who attend to all activities and take all decisions related to the conduct of the business, the for- eign partners are the actual owners and the managers in full control. The UAE partner does not actively partici- pate in the day-to-day business management but spon- sorship is just an arrangement to conform to the Federal Company Law. Therefore, small businesses with foreign equity are classified as nonfamily businesses. Two, in medium-sized businesses (10 to 19 workers) with foreign equity, UAE nationals are more likely to be non-silent partners, but their presence in the firm is mostly for formality reasons and for facilitating access to local authorities and agencies, as well as monitoring lo- cal employees and local clientele. However, control and management remain in the hands of foreign partners. Three, large businesses (20 employees or more) with foreign equity are formally organized and ownership of capital and liabilities of owners are stipulated in legal documents. However, in most such businesses, although the UAE partner is a member of the board of directors 1Residency visa of all expat employees is dependent on employment contracts. Once a contract is terminated, the employee must either leave the country or find another employer. The Law also applies to CEOs. Copyright © 2011 SciRes. ME  B. RETTAB ET AL 628 because of his/her share in capital investment, deci- sion-makers are usually foreigners. Therefore, large businesses with foreign equity are also assumed to be non-family businesses. 5. Data and Analysis The data set we extract information from to examine the comparative performance of family versus nonfamily businesses comes from the 2005 Dubai Chamber’s membership database. The total number of members is 20,576; 10,597 are family businesses and 9979 are non- family businesses. Reported by each business are income, exports, number of owners, number of employees, paid-up capital, cohort (whether a business started opera- tion before or after 1990), location (whether or not a business is located in the free zone), and the industry category to which a business belongs. The industry categories are manufacturing, construction, trading, and services. Performance is represented by the following linear model: * ** *** *** nijki jkijknijk ijknijk ijknijk jk jk nijk ijk YBIEOWN CAP EMP BIij BEIE BIESS e (1) where Y is income, µ is the intercept, B is business type, I is industry category, E is export status, OWN is the number of owners, CAP is paid-up capital, EMP is num- ber employees, and SS is a measure of self-selection. The subscript nijk refers to nth firm, for n = 1,…20576; in the ith business, where i = 1 for a family business and i = 2 for a nonfamily business; in the jth sector, where j=1 for manufacturing (MAN), j = 2 for construction (CON), j = 3 for trading (TRD), and j = 5 for services (SRV). The subscript k is equal to 1 if the firm exports and 2 if it does not. Although the choice of variables is ex-post, as it is dictated by what is available in the data set, the variables capture the essence, although imperfectly, of some de- terminants of family versus non-family firms outlined in Section 2. The number of owners is a proxy for agency costs, i.e., the larger the number of owners the higher the agency costs. Paid-up capital is a proxy for risk and ex- tent of internal financing. The number of employees could, as has been assumed in past work, be an indicator of the size of the firm as well as agency costs. With a larger pool of employees, issues related to moral hazard take on crucial importance. The variable SS is the inverse mills ratio calculated from a Probit model as suggested by Heckman (1979) [8]. The ratio controls for selection. A positive (negative) γ that is statistically different from zero indicates presence of selection bias that overstates (understates) the effect family business structure on performance. The bias is overstated (understated) if stronger (weaker) “business people” chose to run a family business. The error enijk ~ iid N(0, σ2 ijk ) accounts for the error structure which al- lows for heterogeneous variances by business type, in- dustry, and export status. The Probit model explains belonging to a family or a nonfamily business (Bi) as a function of the number of owners (OWN), paid-up capital (CAP), number of em- ployees (EMP), Location (LOC), industry category (I), and an indicator (COH) which equals 1 if the business started before 1990 and zero after 1990. The period after 1990 represent the take-off growth period for Dubai. Results of the Probit model are presented in Table 2. What transpires from the Probit results is that firms with more owners are less likely to organize as family businesses, as were firms who started business after 1990, a period which witnessed strong FDI inflow to Dubai. The rest of the variables all increase the likelihood of a firm organizing itself as a family business. From the Probit results, we construct the mills ratio: ,,SSXX , where ,X is the density function, ,X is the distribution function, and θ is the vector of parameter estimates from the Probit model reported in Table 2. Before estimating the linear statistical model of per- formance (Equation (1)), we conducted a preliminary check of the distribution of the regressors through histo- grams. The check revealed that the regressors are highly skewed, with the largest values of some regressors often being the smallest values. A rule of thumb is that if the largest value is more than three times larger than the smallest value, a log transformation of the regressors is needed, mitigating the problem of extreme outliers [31]. The performance equation was estimated using the SAS Proc Mixed routine [32] by first transforming the variables Y, OWNERS, CAP, and EMP into loga- rithms and incorporating a different residual variance σ2 ijk for each business (i = 1,2) by industry ( j = 1,2,3,4) by export status combination (k = 1,2). Estimates of the Table 2. Parameter Estimates of the Probit Model Parameter EstimateStandard Error Chi-SquarePr > χ2 Intercept 0.6940.0897 59.96 < .0001 OWN –0.6500.0072 8133.68< .0001 CAP 0.0670.0110 38.21 < .0001 EMP 0.00050.0001 85.04 < .0001 LOC DUBAI1.1720.0856 187.50 < .0001 I CON0.1540.0393 15.53 < .0001 I MFG0.4540.0475 91.30 < .0001 I SRV0.675 0.0325 431.53 < .0001 COH AFTER 1990 –0.3800.0229 274.74 < .0001 Copyright © 2011 SciRes. ME  B. RETTAB ET AL Copyright © 2011 SciRes. ME 629 16 residual variances were obtained by performing a separate regression for each one of the 16 combinations. The solution for fixed effects yielded 93 parameter esti- mates, including the intercept. The first hypothesis of interest is self-selection bias. The coefficient γ for the variable controlling for selection is 0.239 and a standard error 0.049, indicating (statisti- cally) strong presence of self-selection bias that tends to overstate the effect of family business structure on per- formance. The implication is that analysis for compara- tive performance of family and nonfamily businesses in the Dubai case should account for self-selection bias. The next hypotheses of interest are those related to the statistical importance of the fixed effects, the covariates, and interactions thereof. Results are reported in Table 3. Individually, the fixed effects B, I and E are highly significant and so are the covariates OWN, EMP, and CAP. The interactions are all highly significant with three exceptions: business type by exports status (B*E), industry type by export status (I*E), and business type by industry by numbers of owners (OWN*B*I). Next we take a look at the comparative performance of family business vis-à-vis nonfamily businesses by indus- try and by export status. Table 4 compares mean per- formance of family and nonfamily businesses in the con- struction sector. The rows highlighted in gray indicate instances of superior performance of family businesses. The first highlighted row in gray is read as follows: a family business in the construction sector that does not export outperforms a nonfamily business in construction that does not export. The second highlighted row indi- cates that a family business in construction that does not export outperforms a nonfamily business in manufactur- ing that does not export. The rest of the rows can be read in a similar manner. Results for construction can be summarized as follows. Family businesses in construction outperformed non- family businesses in 44% of all cases, outperformed nonfamily businesses in the construction business only when nonfamily businesses are not exporters, and in no other instance did family businesses outperform non- family businesses who export. Results for manufacturing are in Table 5. It appears that family businesses in manufacturing outperform non- family businesses only in 25% of the cases, outper- formed nonfamily businesses in manufacturing only when nonfamily businesses in manufacturing are not exporters, and, as in construction; in no other instance did they outperform nonfamily businesses who export. In the services industry (Table 6), family businesses outperformed nonfamily business only in 25% of the cases, did not outperform nonfamily businesses in services only when the family business exports and the nonfamily busi- ness does not, and in no other instance did they outper- form nonfamily businesses in services who export. The outcome for the trading sector is radically differ- ent (Table 7). Family businesses outperform nonfamily business in 7% of the cases. Trading family businesses who do not export outperform only nonfamily businesses who do not export. However, trading family businesses Table 3. Type 3 Tests of Fixed Effects. Effect Num DF Den DF F Value Pr > F B 1 2114 17.26 < .0001 I 3 1677 8.99 < .0001 E 1 182 107.93 < .0001 B*I 3 1659 10.82 < .0001 B*E 1 182 0.01 0.9098 I*E 3 172 0.15 0.9300 B*I*E 3 172 3.12 0.0275 OWN 1 6011 63.12 < .0001 CAP 1 1824 3210.36 < .0001 EMP 1 1033 758.01 < .0001 OWN*B 1 2776 13.24 0.0003 CAP*B 1 1819 11.41 0.0007 EMP*B 1 1001 20.76 < .0001 OWN*I 3 2275 10.64 < .0001 CAP*I 3 1444 12.54 < .0001 EMP*I 3 1349 12.05 < .0001 OWN*B*I3 2290 1.49 0.2153 CAP*B*I3 1435 17.29 < .0001 EMP*B*I3 1342 6.47 0.0002 Table 4. Comparative performance of family businesses in construction. B I E B I E Estimate Standard ErrorDF t Value Pr > |t| FAM CON NO NFAM CON NO 0.2677 0.1000 1135 2.68 0.0076 FAM CON NO NFAM CON YES –0.02721 0.1483 584 –0.18 0.8545 FAM CON NO NFAM MFG NO 0.5384 0.1152 1158 4.67 < .0001 FAM CON NO NFAM MFG YES –0.1127 0.1224 1079 –0.92 0.3577 FAM CON NO NFAM SRV NO 0.2963 0.08637 794 3.43 0.0006 FAM CON NO NFAM SRV YES –0.04539 0.1362 508 –0.33 0.7390 FAM CON NO NFAM TRD NO –0.04079 0.07347 519 –0.56 0.5790 FAM CON NO NFAM TRD YES –0.3853 0.066 578 –5.77 < .0001 FAM CON YES NFAM CON NO 0.7182 0.2322 32.4 3.09 0.0041 FAM CON YES NFAM CON YES 0.4233 0.2619 49.5 1.62 0.1124 FAM CON YES NFAM MFG NO 0.9889 0.2389 36.3 4.14 0.0002 FAM CON YES NFAM MFG YES 0.3378 0.2481 40.2 1.36 0.1808 FAM CON YES NFAM SRV NO 0.7468 0.2259 29.2 3.31 0.0025 FAM CON YES NFAM SRV YES 0.4051 0.2546 44.5 1.59 0.1186 FAM CON YES NFAM TRD NO 0.4097 0.2222 27.3 1.84 0.0760 FAM CON YES NFAM TRD YES 0.06517 0.2261 27.8 0.29 0.7753 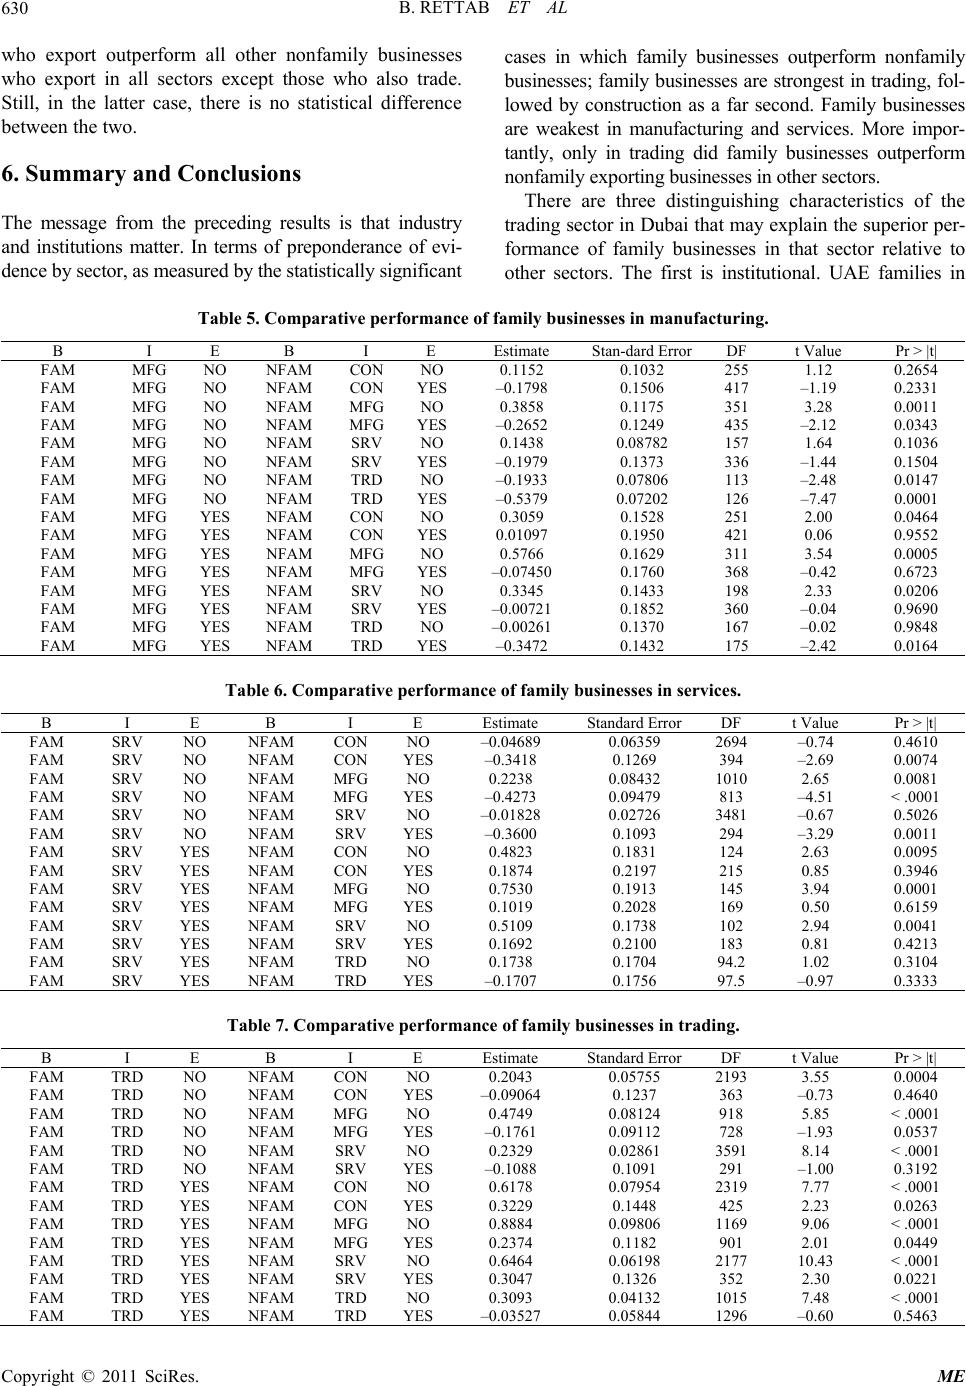 B. RETTAB ET AL Copyright © 2011 SciRes. ME 630 who export outperform all other nonfamily businesses who export in all sectors except those who also trade. Still, in the latter case, there is no statistical difference between the two. 6. Summary and Conclusions The message from the preceding results is that industry and institutions matter. In terms of preponderance of evi- ence by sector, as measured by the statistically significant d cases in which family businesses outperform nonfamily businesses; family businesses are strongest in trading, fol- lowed by construction as a far second. Family businesses are weakest in manufacturing and services. More impor- tantly, only in trading did family businesses outperform nonfamily exporting businesses in other sectors. There are three distinguishing characteristics of the trading sector in Dubai that may explain the superior per- formance of family businesses in that sector relative to other sectors. The first is institutional. UAE families in Table 5. Comparative performance of family businesses in manufacturing. B I E B I E Estimate Stan-dard ErrorDF t Value Pr > |t| FAM MFG NO NFAM CON NO 0.1152 0.1032 255 1.12 0.2654 FAM MFG NO NFAM CON YES –0.1798 0.1506 417 –1.19 0.2331 FAM MFG NO NFAM MFG NO 0.3858 0.1175 351 3.28 0.0011 FAM MFG NO NFAM MFG YES –0.2652 0.1249 435 –2.12 0.0343 FAM MFG NO NFAM SRV NO 0.1438 0.08782 157 1.64 0.1036 FAM MFG NO NFAM SRV YES –0.1979 0.1373 336 –1.44 0.1504 FAM MFG NO NFAM TRD NO –0.1933 0.07806 113 –2.48 0.0147 FAM MFG NO NFAM TRD YES –0.5379 0.07202 126 –7.47 0.0001 FAM MFG YES NFAM CON NO 0.3059 0.1528 251 2.00 0.0464 FAM MFG YES NFAM CON YES 0.01097 0.1950 421 0.06 0.9552 FAM MFG YES NFAM MFG NO 0.5766 0.1629 311 3.54 0.0005 FAM MFG YES NFAM MFG YES –0.07450 0.1760 368 –0.42 0.6723 FAM MFG YES NFAM SRV NO 0.3345 0.1433 198 2.33 0.0206 FAM MFG YES NFAM SRV YES –0.00721 0.1852 360 –0.04 0.9690 FAM MFG YES NFAM TRD NO –0.00261 0.1370 167 –0.02 0.9848 FAM MFG YES NFAM TRD YES –0.3472 0.1432 175 –2.42 0.0164 Table 6. Comparative performance of family businesses in services. B I E B I E Estimate Standard Error DF t Value Pr > |t| FAM SRV NO NFAM CON NO –0.04689 0.06359 2694 –0.74 0.4610 FAM SRV NO NFAM CON YES –0.3418 0.1269 394 –2.69 0.0074 FAM SRV NO NFAM MFG NO 0.2238 0.08432 1010 2.65 0.0081 FAM SRV NO NFAM MFG YES –0.4273 0.09479 813 –4.51 < .0001 FAM SRV NO NFAM SRV NO –0.01828 0.02726 3481 –0.67 0.5026 FAM SRV NO NFAM SRV YES –0.3600 0.1093 294 –3.29 0.0011 FAM SRV YES NFAM CON NO 0.4823 0.1831 124 2.63 0.0095 FAM SRV YES NFAM CON YES 0.1874 0.2197 215 0.85 0.3946 FAM SRV YES NFAM MFG NO 0.7530 0.1913 145 3.94 0.0001 FAM SRV YES NFAM MFG YES 0.1019 0.2028 169 0.50 0.6159 FAM SRV YES NFAM SRV NO 0.5109 0.1738 102 2.94 0.0041 FAM SRV YES NFAM SRV YES 0.1692 0.2100 183 0.81 0.4213 FAM SRV YES NFAM TRD NO 0.1738 0.1704 94.2 1.02 0.3104 FAM SRV YES NFAM TRD YES –0.1707 0.1756 97.5 –0.97 0.3333 Table 7. Comparative performance of family businesses in trading. B I E B I E Estimate Standard Error DF t Value Pr > |t| FAM TRD NO NFAM CON NO 0.2043 0.05755 2193 3.55 0.0004 FAM TRD NO NFAM CON YES –0.09064 0.1237 363 –0.73 0.4640 FAM TRD NO NFAM MFG NO 0.4749 0.08124 918 5.85 < .0001 FAM TRD NO NFAM MFG YES –0.1761 0.09112 728 –1.93 0.0537 FAM TRD NO NFAM SRV NO 0.2329 0.02861 3591 8.14 < .0001 FAM TRD NO NFAM SRV YES –0.1088 0.1091 291 –1.00 0.3192 FAM TRD YES NFAM CON NO 0.6178 0.07954 2319 7.77 < .0001 FAM TRD YES NFAM CON YES 0.3229 0.1448 425 2.23 0.0263 FAM TRD YES NFAM MFG NO 0.8884 0.09806 1169 9.06 < .0001 FAM TRD YES NFAM MFG YES 0.2374 0.1182 901 2.01 0.0449 FAM TRD YES NFAM SRV NO 0.6464 0.06198 2177 10.43 < .0001 FAM TRD YES NFAM SRV YES 0.3047 0.1326 352 2.30 0.0221 FAM TRD YES NFAM TRD NO 0.3093 0.04132 1015 7.48 < .0001 FAM TRD YES NFAM TRD YES –0.03527 0.05844 1296 –0.60 0.5463  B. RETTAB ET AL Copyright © 2011 SciRes. ME 631 the trading sector have historically been granted exclusive commercial licenses by the government. To the extent that such licenses might lead to monopoly power, the implications for performance are clear. Second, because successful trading has historically been and still is tied to strong family networks, the stronger performance of fam- ily businesses is a manifestation of the strength of those networks. The strength of family network also helps ex- plain why nonfamily businesses who export are on par with family businesses who also export. Nonfamily busi- nesses in the trading sector also rely on family and non- family networks in native countries of the owners of non- family businesses. Third, trading has the least techno- logical requirement, thus exposing UAE traders to less competition from the rest of the sectors, where the tech- nological requirements are relatively higher. The policy implication is that in order to bring Dubai family businesses on par with nonfamily businesses in the other more technologically demanding sectors, a technology adoption agenda needs to be targeted towards family businesses in those sectors. 7. References [1] P. Jaskiewicz and S. Klein. “Family Influence and Per- formance—Theoretical Concepts and Empirical Results,” Paper Presented at the FERC Conference, Portland, Ore- gon, 2005. [2] W. G. Dyer Jr., “Examining the ‘Family Effect’ on Firm Performance,” Family Business Review, Vol. 19, No. 4, 2006, pp. 253-273. doi:10.1111/j.1741-6248.2006.00074.x [3] B. Kotey, “Are Performance Differences between Family and Non-family SMEs Uniform across All Firm Sizes?” International Journal of Entrepreneurial Behaviour & Research, Vol. 11, No. 6, 2005, pp. 394-421. doi:10.1108/13552550510625168 [4] R. Anderson and D. Reeb, “Founding-Family Ownership and Firm Performance: Evidence from the S&P 500,” Journal of Finance, Vol. 58, No. 3, 2003, pp. 1301-1328. doi:10.1111/1540-6261.00567 [5] B. Lauterbach and A. Vaninsky, “Ownership Structure and Firm Performance: Evidence from Israel,” Journal of Management and Governance, Vol. 3, No. 2, 1999, pp. 189-201. doi:10.1023/A:1009990008724 [6] P. Westhead and M. Cowling, “Performance Contrasts Between Family and Non-family Unquoted Companies in the UK,” International Journal of Entrepreneurial Be- haviour & Research, Vol. 3, No. 1, 1997, pp. 30-52. doi:10.1108/13552559710170892 [7] C. Daily and M. Dollinger, “An Empirical Examination of Ownership Structure in Family and Professionally Managed Firms,” Family Business Review, Vol. 5, No. 2, 1992, pp. 117-136. doi:10.1111/j.1741-6248.1992.00117.x [8] J. J. Heckman, “Sample Selection Bias as Specification Error,” Econometrica, Vol. 47, No. 1, 1979, pp. 153-161. doi:10.2307/1912352 [9] J. Davis, E. Pitts and K. Cormier, “Challenges Facing the Family Companies in the Gulf Region,” SAMA (2006G): Saudi Arabian Monetary Agency, Forty-Second Annual Report, Research and Statistics Department, 1997. [10] A. Shleifer and R. Vishny, “Management Entrenchment: the Case of Manager-Specific Investment,” Journal of Financial Economics, Vol. 25, No. 1, 1997, pp. 123-139. doi:10.1016/0304-405X(89)90099-8 [11] M. Jensen and W. Meckling, “Theory of the Firm: Managerial Behavior, Agency Costs and Ownership Structure,” Journal of Financial Economics, Vol. 3, 1976, pp. 305-360. doi:10.1016/0304-405X(76)90026-X [12] C. Romano, G. Tanewski and K. Smyrnios, “Capital Structure Decision Making: A Model for Family Busi- ness,” Journal of Business Venturing, Vol. 16, No. 3, 2000, pp. 285-310. doi:10.1016/S0883-9026(99)00053-1 [13] M. Mustakallio, “Contractual and Relational Governance in Family Firms: Effects on Strategic Decision-Making Quality and Firm Performance,” Helsinki University of Technology, Doctoral Dissertations 2002/2, 2002. [14] R. Morck, D. Wolfenzon and B. Yeung, “Corporate Gov- ernance, Economic Entrenchment, and Growth,” Journal of Economic Literature, Vol. XLIII, 2005, pp. 655-720. doi:10.1257/002205105774431252 [15] N. M. Young, M. W. Peng, D. Ahlstrom, G. D. Bruton, and Y. Jiang, “Corporate Governance in Emerging Economies: A Review of the Principal-Principal Perspec- tive,” Journal of Management Studies, Vol. 45, No. 1, 2008, pp. 196-220. doi:10.1111/j.1467-6486.2007.00752.x [16] D. C. Mueller, “Corporate Governance and Economic Growth,” International Review of Applied Economics, Vol. 20, No. 5, 2006, pp. 623-643. doi:10.1080/02692170601005598 [17] R. Morck and B. Yeung, “Special Issues Relating to Corporate Governance and Family Control,” Global Corporate Governance Forum, Discussion Paper No. 1, Washington DC, 2004. [18] R. La Porta, F. Lopez-de-Silanes, A. Shleifer and R. Vishny, “Investor Protection and Corporate Governance,” Journal of Financial Economics, Vol. 58, 2000, pp. 3-27. doi:10.1016/S0304-405X(00)00065-9 [19] H. Demsetz and K. Lehn, “The Structure of Ownership: Causes and Consequences,” Journal of Political Eco- nomics, Vol. 93, No. 6, 1985, pp. 1155-1177. [20] M. Jagannathan, “Internal Control Mechanisms and Forced CEO Turnover: An Empirical Investigation,” PhD Dissertation, Virginia Polytechnic Institute and State University, 1996. [21] C. Erdener and D. Shapiro, “The International of Chinese Family Enterprises and Dunning’s Eclectic MNE para- digm,” Management and Organization Review, Vol. 1, No. 3, 2005, pp. 411-436.  B. RETTAB ET AL 632 doi:10.1111/j.1740-8784.2005.00021.x [22] W. Schulze and R. Dino, “The Impact of Distribution of Ownership on the Use of Financial Leverage in the Fam- ily Firms,” Proceedings of the 12th Annual Conference of the United States Association for Small Business and En- trepreneurship, 1998. [23] T. Zellweger, “Risk, Return and Value in the Family Firm,” Dissertation No. 3188, The University of Saint Gallen, 2006. [24] D. McConaughy C. Matthews and A. Fialko, “Founding Family Controlled Firms: Efficiency, Risk and Value,” Journal of Small Business Management, Vol. 39, No. 1, 2001, pp. 31-49. doi:10.1111/0447-2778.00004 [25] A. Jorissen, E. Laveren, R. Martens and A. Reheul, “Dif- ferences between Family and Non-family Firms ‘Real’ versus ‘Sample-Based’ Differences,” Family Firm Insti- tute, Vol. 18, No. 13, 2005, [26] J. Lee, “Family Firm Performance: Further Evidence,” Family Business Review, Vol. 19, No. 2, 2006, pp. 103- 114. doi:10.1111/j.1741-6248.2006.00060.x [27] A. Suehiro, “Family Business Gone Wrong? Ownership Patterns and Corporate Performance in Thailand,” Asian Development Bank Institute, Working Paper 19, ABD Institute, Tokyo, 2001. [28] J. H. Chua, J. J. Christman and P. Sharma, “Defining the Family Business by Behaviour,” Entrepreneurship The- ory and Practice, Vol. 23, No. 4, 1999, pp. 19-38. [29] K. Gersick, J. Davis, McCollom, M. Hampton and I. Lansberg, “Generation to Generation: Life Cycles of the Family Business,” Harvard Business School Press, Har- vard, 1997. [30] B. Rettab, “Dubai Family Enterprises: Definition, Struc- ture and Performance”, In: V. Gupta, et al., Eds., A Compendium on the Family Business Models Around the World, ICFAI University Press, Hyderabad, 2008. [31] S. Chatterjee and B. Price, “Regression Analysis by Ex- ample,” 2nd Edition, Wiley & Sons, New York, 1991. [32] R. C. Little, G. A. Milliken, W. W. Stroup, R. D. Wolf- inger and O. Schabenberger, “SAS for Mixed Model, Second Editions,” SAS Institue Inc., North Carolina, 2006. Copyright © 2011 SciRes. ME
|