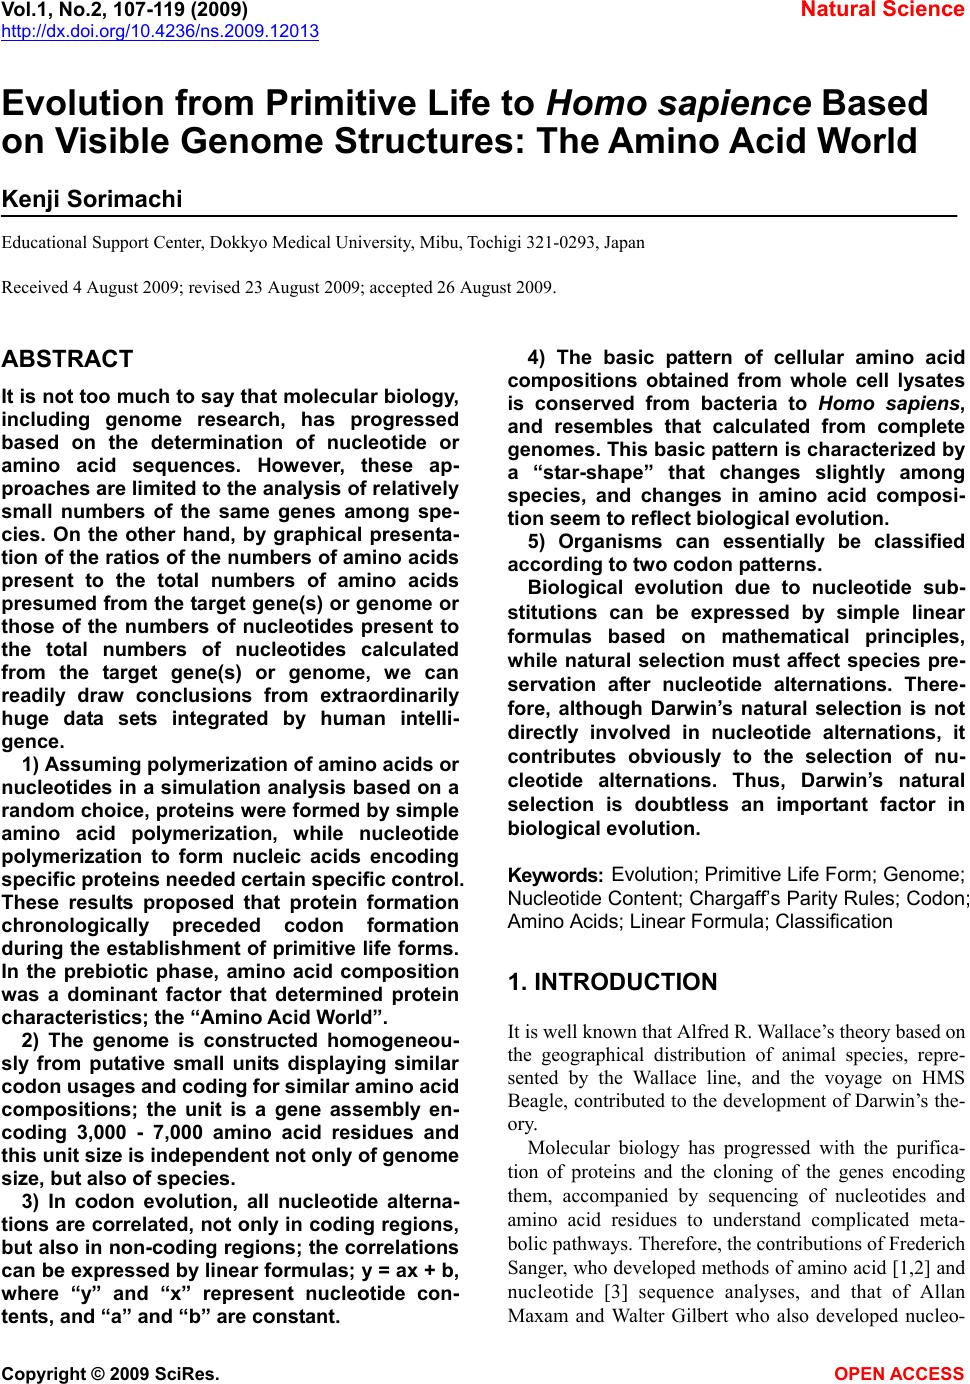
 Vol.1, No.2, 107-119 (2009) Natural Science http://dx.doi.org/10.4236/ns.2009.12013 Copyright © 2009 SciRes. OPEN ACCESS Evolution from Primitive Life to Homo sapience Based on Visible Genome Structures: The Amino Acid World Kenji Sorimachi Educational Support Center, Dokkyo Medical University, Mibu, Tochigi 321-0293, Japan Received 4 August 2009; revised 23 August 2009; accepted 26 August 2009. ABSTRACT It is not too much to say that molecular biology, including genome research, has progressed based on the determination of nucleotide or amino acid sequences. However, these ap- proaches are limited to the analysis of relatively small numbers of the same genes among spe- cies. On the other hand, by graphical presenta- tion of the ratios of the numbers of amino acids present to the total numbers of amino acids presumed from the target gene(s) or genome or those of the numbers of nucleotides present to the total numbers of nucleotides calculated from the target gene(s) or genome, we can readily draw conclusions from extraordinarily huge data sets integrated by human intelli- gence. 1) Assuming polymerization of amino acids or nucleotides in a simulation analysis based on a random choice, proteins were formed by simple amino acid polymerization, while nucleotide polymerization to form nucleic acids encoding specific proteins needed certain specific control. These results proposed that protein formation chronologically preceded codon formation during the establishment of primitive life forms. In the prebiotic phase, amino acid composition was a dominant factor that determined protein characteristics; the “Amino Acid World”. 2) The genome is constructed homogeneou- sly from putative small units displaying similar codon usages and coding for similar amino acid compositions; the unit is a gene assembly en- coding 3,000 - 7,000 amino acid residues and this unit size is independent not only of genome size, but also of species. 3) In codon evolution, all nucleotide alterna- tions are correlated, not only in coding regions, but also in non-coding regions; the correlations can be expressed by linear formulas; y = ax + b, where “y” and “x” represent nucleotide con- tents, and “a” and “b” are constant. 4) The basic pattern of cellular amino acid compositions obtained from whole cell lysates is conserved from bacteria to Homo sapiens, and resembles that calculated from complete genomes. This basic pattern is characterized by a “star-shape” that changes slightly among species, and changes in amino acid composi- tion seem to reflect biological evolution. 5) Organisms can essentially be classified according to two codon patterns. Biological evolution due to nucleotide sub- stitutions can be expressed by simple linear formulas based on mathematical principles, while natural selection must affect species pre- servation after nucleotide alternations. There- fore, although Darwin’s natural selection is not directly involved in nucleotide alternations, it contributes obviously to the selection of nu- cleotide alternations. Thus, Darwin’s natural selection is doubtless an important factor in biological evolution. Keywords: Evolution; Primitive Life Form; Genome; Nucleotide Content; Chargaff’s Parity Rules; Codon; Amino Acids; Linear Formula; Classification 1. INTRODUCTION It is well known that Alfred R. Wallace’s theory based on the geographical distribution of animal species, repre- sented by the Wallace line, and the voyage on HMS Beagle, contributed to the development of Darwin’s the- ory. Molecular biology has progressed with the purifica- tion of proteins and the cloning of the genes encoding them, accompanied by sequencing of nucleotides and amino acid residues to understand complicated meta- bolic pathways. Therefore, the contributions of Frederich Sanger, who developed methods of amino acid [1,2] and nucleotide [3] sequence analyses, and that of Allan Maxam and Walter Gilbert who also developed nucleo-  K. Sorimachi / Natural Science 1 (2009) 107-119 Copyright © 2009 SciRes. OPEN ACCESS 108 tide sequence analyses [4], to the development of mo- lecular biology, are inestimable. An approach using nu- cleotide sequences has a merit that excludes standard errors. Changes in nucleotide or amino acid sequences in a single gene have been applied to evolutionary research based on the assumption that amino acid sequence changes are linked to biological evolution – a “molecular clock” [5]. In general, it is possible to compare se- quences among the same kinds of genes or proteins, but it is hard to compare different kinds of genes or their products. Thus, the approach using nucleotide sequences seems not to be suitable for genome research handling genomes consisting of different kinds and numbers of genes among species. On the other hand, focusing on constitutional differences in proteins, the ratios of the numbers of amino acids present to the total numbers of amino acids presumed from the target gene(s) or genome and those of the numbers of nucleotides present to the total numbers of nucleotides in the target gene(s) or ge- nome are applicable for the comparison not only of the same kinds of genes, but also for the comparison of dif- ferent kinds of genes and different genomes. Ratios based on amino acid or nucleotide sequences can ex- clude deviations, and the combinations of 20 amino acid or four nucleotide distributions can characterize ge- nomes including a huge amount of data. Therefore, these ratios are a useful tool for genome research, which han- dles enormously huge data sets. In addition, using cer- tain graphical presentations, huge data sets on genomes can be easily recognized as simple patterns representing complicated organisms. Graphic representation or a diagram approach to the study of complicated biological systems can provide an intuitive picture and provide useful insights. The historic puzzle of Chargaff’s second parity rule in molecular biology has recently been solved using a simple graphic DNA model [6]. Various graphical approaches have been successfully used, for example, to study codon usage [7-12], enzyme catalyzed systems [13-18], and HIV re- verse transcriptase inhibition mechanisms [19,20]. Graphical approaches have also been used recently to represent DNA sequences [21]. 1.1. Biological Evolution Based on Cellular Amino Acid Compositions Microorganism fossils were found in 2,500 – 2,800 mil- lion year-old rocks [22-24]. Evidence for the existence of microorganisms in ancient rocks indicates that these microorganisms were closed to primitive life forms on earth. Australopithecus, the forebears of Homo sapiens afarensis, are thought to have appeared about 4 million years ago in Africa, based on the fossil record [25], strongly supporting Darwin’s theory and the existence of many extinct species, such as dinosaurs. The scientific discovery that explained hereditary char- acteristics was made by James D. Watson and Francis Crick, namely, the double helix structure of DNA [26]. The pairs of A versus T and G versus C in the double helix structure of DNA produce hereditary characteristics in the replication system and transcription system. According to the transcription system, where U is used instead of T in RNA, cellular proteins are the products of DNA, in- cluding various genes, which are responsible for genetic characteristics. Thus, cellular proteins naturally reflect genetic characteristics, even though the amount of each protein may differ. Cellular amino acid analysis was first carried out in bacteria by Noboru Sueoka [27]. Then, my group investigated the cellular amino acid composition not only of bacteria, but also of archaea and eukaryotes, and found by graphical presentation of data on radar charts that the basic pattern of cellular amino acid com- positions is conserved from bacteria to mammalian cells [28]. This basic pattern, the “star-shape”, is formed with high concentrations of Asp, Glu, Gly, Ala, Val, Ile, Leu and Lys, and with low concentrations of Ser, His, Arg, Pro, Tyr, Met, Cys and Phe (Figure 1). In archaea [29] and plants [30], similar basic patterns of cellular Figure 1. Cellular amino acid compositions on radar charts. The value is expressed as the percentage of total amino acids and in the mean of 3 or 4 independent experiments. Gln and Asn were incorporated into Glu and Asp, respectively, because the former two are converted to the latter two during acidic hydrolysis (Sorimachi 1999). In addition, Try was omitted because of higher decomposition during acidic hydrolysis.  K. Sorimachi / Natural Science 1 (2009) 107-119 Copyright © 2009 SciRes. OPEN ACCESS 109 Figure 2. Computational amino acid compositions of Ureaplasma urealyticum gene. Up- per panel; random choice of amino acid was carried out in the original gene (5,005 amino acid pool). Lower; random choice of nucleotide was carried out in the original gene (15,018 nucleotides). In the simulation using nucleotides, the stop codon and Trp were discarded from the calculation of amino acid compositions, and a triplet formed was im- mediately counted as an amino acid. This figure was reproduced from Kenji Sorimachi and Teiji Okayasu. (2007) Mathematical proof of the chronological precedence of protein formation over codon formation. Curr. Top. in Pep. Prot. Res. 8, 25-34. amino acid compositions are obtained. The fact that the basic pattern, the “star-shape”, is conserved from bacte- ria to Homo sapiens, suggests that the pattern is ex- tremely important for organisms on earth. Each amino acid composition changes slightly accompanied with conservation of the basic pattern, and these minor changes seem to reflect biological evolution. In- tra-cellular free amino acid compositions also show spe- cies-specific patterns [31]. Whole cell lysates consist of many different proteins, the quantities of which show similar amino acid compo- sitions among various organisms; however, species dif- ferences are observed. It would be quite interesting to evaluate whether this “star-shape” is conserved on other planets with life in the future, if any are found. 1.2. Primitive Life Formation Based on the principles of molecular biology, the paren- tal genetic information is transferred to daughter cells by the replication system. The fact that the basic pattern of cellular amino acid composition appears to be conserved from bacteria to Homo sapiens suggests that the pre- sumed amino acid composition of primitive life forms might resemble the cellular amino acid composition ob- tained from modern organisms, because the original pat- tern could have been maintained by the replication sys- tem after codon establishment. 1.3. Chronological Precedence of Protein Formation over Codon Formation We can easily understand that proteins are translated from codons within genes in modern organisms. How- ever, it is unclear if codon formation really preceded protein formation. Although there have been several re- ports explaining the mechanisms of codon formation [32-34], no one theory has become established. At pre- sent, we cannot experimentally make life in the labora- tory, because there are too many unknown factors. On the other hand, computational analysis is an ideal method for solving problems that cannot be solved ex- perimentally. On the basis of molecular biological re- search, we cannot deny that codons are linked to the determination of the amino acid residues in proteins. Assuming that a structure can sometimes reveal its for- mation process, it is possible to investigate the relation- ship between protein and codon formation based on the amino acid compositions presumed from codon usages. Before establishing the well-known protein synthesis pathway in the presence of codons, protein formation occurred via the polymerization of amino acids, the monomers of proteins. Indeed, amino acid polymeriza- tion occurred by heat without enzymes in clay [35]. Pro- teins can be synthesized computationally by selecting a random order of amino acids from an amino acid pool presumed from a protein. When more than 300 amino  K. Sorimachi / Natural Science 1 (2009) 107-119 Copyright © 2009 SciRes. OPEN ACCESS 110 acid residues are chosen at random, the amino acid com- position resembles that of the original protein, and amino acid compositions with reduced similarities are obtained by even the first 100 amino acid residues chosen (Figure 2). On the other hand, the amino acid composi- tion presumed from more than 900 randomly selected nucleotides, equal to 300 amino acid residues, cannot show the same pattern of amino acid composition. The amino acid composition based on fewer than 300 nu- cleotides also can not show the specific pattern. These results clearly indicate that mere polymerization of nu- cleotides, assumed by random choice of nucleotides, can not produce a specific protein. Eventually, the amino acid compositions of proteins obtained from freely po- lymerized nucleotides depend on both the concentrations of all four nucleotides and the genetic code, and proteins with specific amino acid compositions can not be ob- tained from nucleic acids formed by free nucleotide po- lymerization (Figure 2). When codon conversion is ne- glected, the nucleotide composition of polynucleotides can be expressed by a simple quadrangle based on the concentrations of the four nucleotides on radar charts. A consistent result was obtained when various genes were analyzed [36]. In a gene encoding 5,005 amino acid residues, the amino acid compositions of small segments encoding 100 amino acid residues resemble that of the complete gene, and the gene is constructed homogene- ously from putative small units encoding similar amino acid compositions [36]. This result, based on gene seg- ments, is consistent with that based on selecting a ran- dom order of amino acids or nucleotides. Thus, the ini- tial codon formation might be surely controlled by cer- tain factors to form specific proteins. On the contrary, protein formation could occur via simple polymerization of free amino acids without codons. 1.4. A Hypothesis Based on Simulation Analysis Although it is difficult for us to envisage an inverse mechanism in which the information within polypeptides is transferred to nucleotide polymerization, this is the mathematical conclusion based on simple simulation analysis using a random choice, which assumes free amino acid or nucleotide polymerizations. In Miller’s experiments, which assumed an atmosphere on primitive Earth, certain amino acids were formed by electrical discharges [37]. Amino acids have also been identified in meteorites [38,39]. Thus, proteins might be formed even without codons in prebiotic states, and then polynucleotides, including codons, might be formed under conditions that enabled the transfer of protein in- formation. Based on this assumption, primitive life forms might have consisted of proteins reflecting the concentrations of free amino acids that existed on primitive Earth. The concentrations of amino acids would have been con- trolled by various factors, such as gamma rays, UV light and heat, like the natural selection. These effects must have induced homogeneous amino acid concentrations and, eventually, the proteins formed must have had similar amino acid compositions. Indeed, considering the concentrations of each amino acid in cells, the concen- trations of those with a benzene ring, Tyr, Phe and His, in their side chains are comparatively very low (Figure 1); UV light induces photo-decomposition of organic compounds. For example, the thyroid hormone, thyrox- ine, an amino acid derivative having two benzene rings its structure, is easily decomposed by UV light irradia- tion [40,41]. Sometimes, though, this irradiation pro- duces new compounds from certain organic compounds [42,43]. Trp is heat sensitive and is decomposed during cell hydrolysis. On the other hand, the concentrations of amino acids such as Ala, Ile and Leu, with high hydro- phobicity, are comparatively high on radar charts. This must have contributed to self-protein assembly from relatively low concentrations of proteins on primitive earth. The hydrophobic interaction must have been an important factor forming the “coacervates” proposed by Aleksandr Ivanovich Oparin. In addition, Gly and Ala were formed in Miller’s experiments using electrical charges [37]. In the prebiotic world, amino acid concen- tration was a dominant factor in the formation of primi- tive life forms. Therefore, I propose here an existence of the “Amino Acid World” during the prebiotic world based on both experimental and genomic data as a hy- pothesis of primitive life forms. A “RNA world” has been proposed as a hypothesis of primitive life forms, as certain RNAs have an enzymatic activity for self replication – “ribozyme” [44]. Even in this case, it is hard to image that free nucleotides formed primitive RNA molecules possessing template charac- teristics that would induce codon formations. In addition, nucleic acids are very sensitive to UV light, with this light irradiation commonly used for pasteurization. Thus, RNA might not have played a crucial role in primitive life formation on primitive Earth which would have been exposed to strong UV light and gamma rays. 1.5. Homogeneity of Genome Structures Simulations based on a random choice of amino acids or nucleotides suggest that primitive life forms consisted of proteins formed with the same amino acid compositions, because the amino acid polymerization of proteins oc- curred in the presence of the same amino acid composi- tion, as mentioned above. Therefore, the genomes of primitive life forms must have been homogeneous in terms of amino acid composition, and this characteristic must have been conserved in the genomes of modern organisms by a late-established replication system. In addition, the basic pattern of cellular amino acid compo-  K. Sorimachi / Natural Science 1 (2009) 107-119 Copyright © 2009 SciRes. OPEN ACCESS 111 Figure 3. Cellular and genomic amino acid compositions on radar charts. The value is expressed as the percentage of total amino acids. Methanobacte©rium thermoauto- trophicum was examined. The cellular amino acid com- position was obtained from 3 independent analyses. In genomic calculations, Gln and Asn were also incorpo- rated into Glun and Asp, respectively, to compare with data based on amino acid analysis. sition is conserved from bacteria to Homo sapiens, even though the cells are constructed from many different kinds of proteins in different quantities [28]. This meas- urement of cellular amino acids is experimentally possi- ble at present. However, we cannot evaluate the degree of gene expression of each gene in live cells. To over- come this problem, calculation of gene expression levels was carried out assuming conveniently that each gene is expressed equally [29]; this assumption equally means that the genome is constructed apparently from a single large coding region consisting of many genes, and an- other single non-coding region. The relationship be- tween nucleotide contents can be expressed by different linear formulas for coding and non-coding regions [11]. This suggests that the two regions were formed at dif- ferent stages during the establishment of primitive life forms. Surprisingly, the amino acid composition calcu- lated from the complete genome is extremely similar to that obtained from amino acid analysis of cell lysates, as shown in Figure 3. This puzzle was solved as follows. I proposed that a genome may be constructed from putative small units encoding similar amino acid compositions [45]. On the other hand, each gene has a different amino acid se- quence and different amino acid composition, although some genes show a similar amino acid composition to the whole group. Thus, a gene assembly containing cer- tain genes can show a similar amino acid composition to the whole group. Similarly, as proteins are gene products, it is possible to assume that cell lysates consist of as- semblies of proteins. Therefore, the cellular amino acid composition based on amino acid analysis resembles that based on genomic calculation. To prove this, the complete genome of the archaeon Methanobacterium thermoautotrophicum was examined. Both one-tenth segments (encoding 30,000 – 60,000 amino acid residues) and one-twentieth segments (encod- ing 20,000 – 30,000 amino acid residues) showed almost the same amino acid composition, and small units en- coding 3,000 – 7,000 amino acid residues obtained from genome division showed similar amino acid composi- tions (Figure 4). In Saccharomyces cerevisiae, chromo- somes of different sizes showed almost the same amino acid composition. As shown in Fig. 4, it is clear that the genome is constructed homogeneously from putative small units having almost the same amino acid composi- tions, not only in bacteria, but also in eukaryotes. The putative unit size is independent of its location in the genome. Obviously, this fact led naturally to synchro- nous mutations across the genome during biological evolution; and as a result, genome structure is homoge- neous based on codon usage [9] and amino acid compo- sition [45]. 1.6. Mathematical Proof of the Unit Size In general, natural proteins are polymers of 20 kinds of amino acid residues. To clarify the reason why a gene assembly encoding 3,000 – 7,000 amino acid residues represents a total population of amino acids based on the complete genome, a multinomial distribution analysis [46] was carried out. In this analysis, 17 amino acid residues were chosen at random from the amino acid pool based on the complete genome to compare the amino acid composition with those calculated from gene assemblies on the complete genome, because Glu and Asp were converted to Gln and Asn, respectively, and Trp was decomposed, during our amino acid analyses using cell lysates [28]. Mathematical analysis clearly showed that the 17-amino acid composition based on a random choice of 3,000 -7,000 amino acid residues represents an amino acid composition with 95% level simultaneous confidence intervals for all amino acid probabilities in the sample [47]. Reducing the level of simultaneous confidence intervals or sample size de- creases the similarity of the amino acid composition. 1.7. Bacterial Classification Based on Complete Genomes Bacteria can be classified by Gram staining into two groups, Gram-positive and Gram-negative bacteria, and both biochemical and morphological characteristics con- tribute to precise classification [48]. At the end of the 20th century, the methodology for genomic research was established, and the genomes of several hundred bacteria have been completely analyzed to date. The first com- plete genome analysis of a free-living organism was car- ried out in Haemophilus influenzae in 1995 [49], and the complete human genome was analyzed at the beginning of the 21st century [50,51]. Bacteria seem worthy of classification based on ge- nome sequence, because using the ratios of the numbers of amino acids present to the total numbers of amino  K. Sorimachi / Natural Science 1 (2009) 107-119 Copyright © 2009 SciRes. OPEN ACCESS 112 Figure 4. Amino acid compositions calculated from various units of the complete genome of Methano- bacterium autotrophicum and Saccharomyces cerevisiae on radar charts. A, the compete M. thermo- autotrophicum genome consisting of 1,869 protein genes (Smithe et al. 1997) was divided into 10 (9 units consisting of 186 genes and one units consisting of 195 genes) or 20 (5 units consisting of 93 genes). B, Scaachromyces cerevisiae. This figure was reproduced from Kenji Sorimachi and Teiji Oka- yasu. (2005) Genomic structure consisting of putative units coding similar amino acid composition: synchronous mutations in biological evolution. Dokkyo J. Med. Sci. 32, 101-106. acids presumed from the target gene(s) or whole genome, or those of the numbers of nucleotides present to the total numbers of nucleotides in the target gene(s) or whole genome makes it possible to directly compare different genes or genomes, as mentioned above. As the genome is constructed homogeneously from putative small units encoding almost the same amino acid com- position, the factor of genome size is irrelevant to com- parisons of amino acid compositions. The patterns of amino acid compositions based on the complete genomes of various bacteria, 11 Gram-positive and 12 Gram-negative bacteria, are star shaped, as men- tioned above. According to differences in concentrations of Ala, Arg or Lys, bacteria are classified into two groups, “S-type”, represented by Staphylococcus aureus, and “E-type”, represented by Escherichia coli; this clas- sification is independent of Gram staining [52]. Differ- ences in Gram staining based on structural differences in cell walls are not detected in genomic structures, while precise changes in amino acid composition, expressed by  K. Sorimachi / Natural Science 1 (2009) 107-119 Copyright © 2009 SciRes. OPEN ACCESS 113 Figure 5. Dendrograms of organism classifications obtained utilizing the Ward method. As traits, GC contents at the three codon positions were used. “a” 112 bacteria, “b” 15 archaea, “c” 18 eukaryotes. Blue charcters represent “AT-type” equal to “S-type” and red represent “GC-type” equal to “E-type”. This figure was reproduced from Teiji Okayasu and Kenji Sorimachi. (2009) Organisms can essentially be classified according to two codon patterns, Amino Acids, 36, 261-271.  K. Sorimachi / Natural Science 1 (2009) 107-119 Copyright © 2009 SciRes. OPEN ACCESS 114 Figure 6. Codon usage patterns and amino acid compositions of Staphylococcus aureus and Escherichia coli. Codon usage (bar) and amino acid composition (ra- dar chart) were expressed by percent of total codons and amino acids, respec- tively. These figures were reproduced from Kenji Sorimachi and Teiji Okayasu. (2008) Codon evolution is governed by linear formulas, Amino Acids, 34, 661-668. the “star-shape”, seem to reflect biological evolution. 1.8. Classification of Organisms into Dendrograms Changes in nucleotide or amino acid sequences have been applied to evolutionary research and their results are expressed by phylogenic trees on the assumption that these changes are linked to biological evolution [53-58]. This analytical method is applicable to genes for which amino acid or nucleotide sequences have been deter- mined, but it is not suitable for genome research han- dling extremely huge data sets. In addition, we cannot examine organisms that lack a certain target gene. Using the ratios of the numbers of amino acids present to the total numbers of amino acids presumed from the whole genome or those of the numbers of nucleotides to the total numbers of nucleotides in the whole genome, or- ganisms consisting of numerous different genes can be examined. Indeed, a small number of 23 bacteria has been classified into two groups on the basis of only one amino acid, Arg, Ala or Lys [52]. To quantitatively ex- amine a large number of organisms, multivariate analy- sis using many factors is applicable to cluster analysis [59]. Organisms consisting of 112 bacteria, 15 archaea and 18 eukaryotes were classified into two major groups by multivariate analysis using GC contents at the three different codon positions, calculated from complete ge- nomes (Figure 5). When 20 amino acid concentrations or 64 codon usages are used as traits instead of GC con- tent, similar dendrograms are obtained [59]. The 145 organisms were classified into “GC-type equal to E-type” and “AT-type equal to S-type” repre- sented by high G or C (low T or A, and high A or T (low G or C) contents, respectively, at every third codon posi- tion. The organism that has the highest GC content at the third codon position is Streptomyces coelicolor [60], and that which has the lowest GC content at the third codon position is Ureaplasma urealyticum [61]. Reciprocal changes between G or C and A or T contents at the third codon position occurred synchronously in every codon among the organisms, as shown in Figure 6. Thus, all organisms can basically be classified into two groups according to their characteristic codon patterns with low GC and high AT contents at the third codon position, and the opposite. A similar conclusion was obtained from research that examined the content of G + C in a large number of genes [62]. These facts indicate that codon alternations occur synchronously, not only within three codon positions, but also among codons to form new species, as codon alternations occur synchronously over the genome [9,10,45]. This principle is independent of genome size as well as species, from bacteria to Homo sapiens. 1.9. Biological Evolution Can Be Expressed by Linear Formulas A half century ago, two great scientific concepts regard- ing DNA structures were discovered. One of them is the helical double-stranded structure of DNA [26], which can explain characteristic heredity. Another is Chargaff’s parity rules obtained experimentally; Chargaff’s first parity rule [63] in which C/G, T/A and (C + T)/(A + G) ratios are one in the DNA extracted from organisms ;  K. Sorimachi / Natural Science 1 (2009) 107-119 Copyright © 2009 SciRes. OPEN ACCESS 115 and Chargaff’s second parity rule [64] in which these ratios are nearly one in single stranded DNA isolated from double stranded DNA. The first parity rule is en- tirely based on physicochemical and intra-strand charac- teristics of nucleotides. Thus, the rule is independent of biological and intra-molecular influences, while bio- logical divergences are excluded from this rule. The re- lationships between the contents of two nucleotides are expressed by linear lines whose regression coefficients are one based on the first rule. The second rule has his- torically been a puzzle in molecular biology, because we can not image that the pairings G to C and A to T are formed in the single stranded DNA. This is an in- tra-molecular rule governing single stranded DNA. Quite recently, however, I was able to solve the puzzle, based on our results that genome structure is homoge- neous [6], and that the sizes of the coding regions are nearly equal between the forward and reverse strands [11]. Thus, mitochondrial genome in which coding sizes differ between the forward and reverse strands appears not to be subject to the second parity rule [65,66]. It has been indicated that the double stranded DNA structure is important for biological evolution and that the double strand might be established during primitive life forma- tion [6]. This second parity rule has recently been ap- plied to complete genomes derived from double stranded DNA [67]. Chargaff’s rules are universal for all repli- cating organisms, but they cannot reflect evolutionary differences based on different kingdoms. The findings of certain rules that govern biological evolution will help us to understand scientifically the evolutionary process over an extremely long time and based on unknown factors. Fortunately, a huge amount of data regarding genomes has been accumulated by a large number of scientists. The present state could not be imagined in Darwin’s Age. When nucleotide (G, C, T and A) contents based on complete genomes are plotted against the content each nucleotide among various organisms, their relationships can clearly be expressed by a linear formula, y = ax + b, where y and x represent nucleotide contents, and “a” and “b” are constants. These constant values differ between the coding and non-coding regions. This linear relation- ship is obtained from the complete single-stranded DNA forming the nuclear genome [11,67]. The values of “a” and “b” in either coding or non-coding region differ slightly among kingdoms, such as bacteria, archaea and eukaryotes [11]. Thus, nucleotide alternations are gov- erned by slightly different rules among different king- doms. Among these linear regression lines, the constant value “b” has never been zero, and the regression coeffi- cients have never been one. This confirms that the for- mulas differ from Chargaff’s formulas, while differences in regression lines among different kingdoms are the results of biological divergence. As the relationships between two nucleotide contents are expressed by linear experimental formulas among various organisms, the determination of any one nucleo- tide content can essentially allow the estimation of all four nucleotide contents. In addition, because the rela- tionships between nucleotide content and 64 codon us- ages are also governed by linear formulas, the 64 codons in the coding region can be estimated from the content of just one nucleotide (Figure 7). In mitochondria and chloroplasts, nucleotide alterna- tions are also expressed by similar linear formulas with Figure 7. Codon usage patterns and amino acid compositions of Homo sapience. Codon usage (bar) and amino acid composition (radar chart) were expressed by percent of total codons and amino acids, respec- tively. Upper and lower panels represent genomic and estimated data, respectively. These figures were re- produced from Kenji Sorimachi and Teiji Okayasu. (2008) Codon evolution is governed by linear formu- las, Amino Acids, 34, 661-668.  K. Sorimachi / Natural Science 1 (2009) 107-119 Copyright © 2009 SciRes. OPEN ACCESS 116 Figure 8. Correlation of G content to C content in various organisms based on their complete genomes. Red, blue and green symbols represent 112 bacter©ia, 15 ar- chaea and 18 eukaryotes, respectively. Each line was drawn computationally. This figure was reproduced from Kenji Sorima- chi and Teiji Okayasu. (2008) Codon evo- lution is governed by linear formulas, Amino Acids, 34, 661-668 slightly different constant values representing the slope and its intercept [12]. All nucleotide alternations in nu- clei, mitochondria and chloroplasts are expressed by linear formulas with different constant values resulting from organelle characteristics among various organisms. Namely, a certain nucleotide content “y” can be ex- pressed inter-species by linear formulas, y = ax + b, based on a single nucleotide content “x”. Among four equations presenting four nucleotide contents after nor- malization, the summation of the value of the slope, “a”, is zero and that of the value of constant, “b”, is one [11]. This relationship is mathematically definitive and inde- pendent of the co-relationships among four nucleotide contents. Chargaff’s parity rules, G/C = 1, A/T = 1, (A + G)/(C + T) =1, are alternated as follows: G = G, C = G, T = – G + 0.5, and A = – G + 0.5. Thus, Chargaff’s parity rules, even those governing single species DNA, are derived from the general formula, y = ax + b, when slope, “a” of the two equations’ is 1 or – 1, and when the inter- cept, “b”, is 0.5 or 0 in the equation with – 1 and 1, re- spectively, as the “a”. On the other hand, the values of “a” and “b” in both codon evolution [11] and organelle evolution [68] shifted from 1 or – 1 and 0.5 or 0, respec- tively because of biological divergences, and the regres- sion coefficient also shifted from one. The shift of the regression coefficient from one represents biological divergence. It has been thought that cellular organelle such as mi- tochondria [68] and chloroplasts [69] were derived dur- ing biological evolution from protobacteria and cyano- bacteria, respectively, and that their evolutionary proc- esses appear different from nuclear genome evolution、 as mentioned above. In addition, it is known that muta- tion rate is remarkably high in mitochondrial DNA [70]. In our study, amino acid compositions of chloroplast and plant mitochondria resemble those of nuclear DNA, whereas those of vertebrate mitochondria differ from those of other organelle [12]. Particularly, the content of Leu was extremely high in animal mitochondria [12]. Comparing the shapes of the radar charts based on amino acid compositions, that of the ancient fish, the coelacanth (Latimeria chalumnae), more closely resem- bles those of salamanders and birds compared than those of other fish (Diodon holocunthus) [12]. In further study, using multivariate analysis based on amino acid compo- sitions, lung fish (Neoceratodus forsteri) and coelacanth were both found to belong to the cluster representing a reptile; a cluster separated from that one representing other fish (carp, rainbow trout and killifish). These re- sults are consistent with the already established phylo- genic concept. The apparent great divergence of Homo sapiens from bacteria can be expressed by linear formulas with small turbulences based on the complete genome in biological evolution. Thus, biological evolution seems to be ob- served as a result of mere nucleotide substitutions based on simple mathematical principles, while natural selec- tion affects species preservation after nucleotide alterna- tions. This conclusion is consistent with the idea that evolution is based on neutral mutation [71,72]. There- fore, natural selection does not directly regulate nucleo- tide substitutions, but is indirectly involved in biological evolution. 2. PERSPECTIVES The present paper reveals that the analytical method us- ing the ratios of the numbers of amino acids present to the total numbers of amino acids presumed from the whole genome, or those of the numbers of nucleotides present to the total numbers of nucleotides in the whole genome is useful for genome research, as well as meth- ods using the sequences of amino acids or nucleotides. These ratios based on nucleotide sequences can exclude deviations in certain calculations. The fact that genome structures regarding amino acid compositions or codon usages are homogeneous makes it possible for us to compare various genomes with different sizes and genes. Namely, a large data set obtained from the complete ge- nome can be expressed by just a simple point on a graph. Thus, using the ratios of amino acids or nucleotides to their total numbers seems to be an excellent method for genome research based on extremely huge data sets. In  K. Sorimachi / Natural Science 1 (2009) 107-119 Copyright © 2009 SciRes. OPEN ACCESS 117 addition, even a certain size of gene assembly can be used instead of the complete genome for limited pur- poses. In prebiotic evolution, amino acid composition might have been the strongest factor determining the charac- teristics of biopolymers used for the establishment of primitive life forms, whereas since the establishment of the codon system, biological evolution has been carried out by nucleotide alternations expressed by linear for- mulas based on nucleotide contents, as shown in Figure 8. Thus, 64 codon usages can be estimated from just one nucleotide content (Figure 7), and the characteristic amino acid composition is expressed by the “star-shape” (Figures 1-7), not only in cell analysis, but also in ge- nome analysis. This fact strongly suggests that this “star-shape” may be conserved in both primitive life forms and future organisms, because all organisms must be governed by universal rules on earth, without excep- tion. Thus, this amino acid composition represented by the “star-shape” may reflect the “Amino Acid World”. We, Homo sapiens, stand merely in the middle of a line (Figure 8). We are not the end of line, nor do we have an “ultimate” status. Therefore, we have been and will be exposed to natural selection without exception. 3. ACKNOWLEDGMENTS The author expresses his thanks to Professor Kuo-Chen Chou, Chief-in-Editor of Natural Science, for the oppor- tunity to write this review; to Professor Hiroto Naora, Research School of Biological Sciences, Australian Na- tional University; Professor Makoto Miyaji, Chiba Uni- versity, and Dr. Emiko Furuta, Institute of Comparative Immunology, for encouragement given in respect of the author’s genome research, to Dr. Teiji Okayasu, Dokkyo Medical University, for help with computer analysis of genomic data, and to Dr. Kazumi Akimoto, Dokkyo Medical University for taking care of cell cultures. REFERENCES [1] Sanger, F. and Thompson, E.O. (1953) The amino acid sequence in the glycyl chain of insulin. I. The identifica- tion of lower peptides from partial hydrolysates. Biochem. J., 53, 353-366. [2] Sanger F. and Thompson, E.O. (1953) The amino acid sequence in the glycyl chain of insulin. II. The investiga- tion of peptides from enzymic hydrolysates. Biochem. J , 53, 366-374. [3] Sanger, F. and Coulson, A.R. (1975) A rapid method for determing sequences in DNA by primed synthesis with DNA polymerase. J. Mol. Biol., 94, 441-446. [4] Maxam, A.M. and Gilbert, W. (1977) A new method for sequencing DNA. Proc. Natl. Acad. Sci., USA 74, 560-564. [5] Zuckerkandl, E. and Pauling, L.B. (1962) Molecular disease, evolution, and genetic heterogeneity in Kasha M and Pullman B (editors). Horizons in Biochemistry, Aca- demic Press, New York, 189-225. [6] Sorimachi, K. (2009) A proposed solution to the historic puzzle of Chargaff’s second parity rule. Open Genom. J., 2, 12-14. [7] Chou, K-C. and Zhang, C.T. (1992) Diagrammatization of codon usage in 339 HIV proteins and its biological implication. AIDS Research and Human Retroviruses, 8, 1967-1976. [8] Zhang, C-T. and Chou, K-C. (1993) Graphic analysis of codon usage strategy in 1490 human proteins. J. Prot. Chem., 12, 329-335. [9] Sorimachi, K. and Okayasu, T. (2004) An evolutionary theories based on genomic structures in Saccharomyces cerevisiae and Enchephalitozoon cuniculi. Mycoscience , 45, 345-350. [10] Sorimachi, K. and Okayasu, T. (2007) Genomic structure is homogeneous based on codon usages. Curr. Top. Pep. Protein Res., 8, 19-24. [11] Sorimachi, K. and Okayasu, T. (2008) Codon evolution is governed by linear formulas. Amino Acids, 34, 661-668. [12] Sorimachi, K. and Okayasu, T. (2008) Universal rules governing genome evolution expressed by linear formu- las. Open Genom. J., 1, 33-43. [13] Chou, K-C. (1983) Advances in graphical methods of enzyme kinetics. Biophys. Chem., 17, 51-55. [14] Chou, K-C. (1989) Graphical rules in steady and non-steady enzyme kinetics. J. Biol. Chem., 264, 12074- 12079. [15] Chou, K-C. (1990). Review: Applications of graph the- ory to enzyme kinetics and protein folding kinetics. Steady and non-steady state systems. Biophys. Chem., 35, 1-24. [16] Chou, K-C. (1993) Graphic rule for non-steady-state enzyme kinetics and protein folding kinetics. J. Math. Chem., 12, 97-108. [17] Lin, S.X. and Neet, K.E. (1990) Demonstration of a slow conformational change in liver glucokinase by fluores- cence spectroscopy. J. Biol. Chem., 265, 9670-5. [18] Zhou, G.P. and Deng, M.H. (1984) An extension of Chou's graphical rules for deriving enzyme kinetic equa- tions to system involving parallel reaction pathways. Biochem. J., 222, 169-176. [19] Althaus, I.W., Chou, J.J., Gonzales, A.J. et al. (1993) Kinetic studies with the nonnucleoside HIV-1 reverse transcriptase inhibitor U-88204E. Biochemistry, 32, 6548-6554. [20] Chou, K-C., Kezdy, F.J. and Reusser, F. (1994) Review: Steady-state inhibition kinetics of processive nucleic acid polymerases and nucleases. Anal. Biochem., 221, 217- 230. [21] Qi, X.Q., Wen, J. and Qi, Z.H. (2007) New 3D graphical representation of DNA sequence based on dual nucleo- tides. J. Theoret. Biol., 249, 681–690. [22] MacGregor, I.M., Truswell, J.F. and Eriksson, K.A. (1974) Filamentous alga from the 2,300 m.y. old Trans- vaal Dolomite. Nature, 247, 538-539. [23] Nagy, L.A. and Zumberge, J.E. (1976) Fossil microor- ganisms from the approximately 2800 to 2500 million- year-old Bulawayan stromatolite: Application of ultrami-  K. Sorimachi / Natural Science 1 (2009) 107-119 Copyright © 2009 SciRes. OPEN ACCESS 118 crochemical analyses. Proc. Natl. Acad. Sci. USA, 73, 2973-2976. [24] Schopf, J.W., Barghoorn, E.S., Maser, M.D. and Gordon, R.O. (1965) Electron microscopy of fossil bacteria two billion years old. Science, 149, 1365-1367. [25] Johanson, D.C. and Taieb, M. (1976) Plio-Pleistocene hominid discoveries in Hadar, Ethiopia. Nature, 260, 293-297. [26] Watson, J.D. and Crick, F.H.C. (1953) Genetical implica- tions of the structure of deoxyribonucleic acid. Nature, 171, 964-967. [27] Sueoka, N. (1961) Correlation between base composition of deoxyribonucleic acid and amino acid composition in proteins. Proc. Natl. Acad. Sci. USA, 47, 1141-1149. [28] Sorimachi, K. (1999) Evolutionary changes reflected by the cellular amino acid composition. Amino Acids, 17, 207-226. [29] Sorimachi, K., Itoh, T., Kawarabayasi, Y., Okayasu, T., Akimoto, K. and Niwa, A. (2001) Conservation of the basic pattern of cellular amino acid composition during biological evolution and the putative amino acid compo- sition of primitive life forms. Amino Acids, 21, 393-399. [30] Sorimachi, K., Okayasu, T., Akimoto, K. and Niwa, A. (2000) Conservation of the basic pattern of cellular amino acid composition during biological evolution in plants. Amino Acids, 18, 193-196. [31] Sorimachi, K. (2002) The classification of various or- ganisms according to the free amino acid composition change as the result of biological evolution. Amino Acids, 22, 55-69. [32] Woese, C.R. (1965) Order in the genetic code. Proc. Natl. Acad. Sci. USA, 54, 71-75. [33] Crick, F.H.C. (1968) The origin of genetic code. J. Mol. Biol., 38, 367-379. [34] Wong, J.T-F. (1975) A co-evolutionary theory of the genetic code. Proc. Natl. Acad. Sci. USA, 72, 1909-1912. [35] Lahav, N., White, D. and Chang, S. (1978) Peptide for- mation in the prebiotic era: thermal condensation of gly- cine in fluctuating clay environments. Science, 201, 67-69. [36] Sorimachi, K. and Okayasu, T. (2007) Mathematical proof of the chronological precedence of protein forma- tion over codon formation. Curr. Top. Pep. Protein Res., 8, 25-34. [37] Miller, S.L. (1953) A production of amino acids under possible primitive earth conditions. Science, 117, 528- 529. [38] Kvenvolden, K., Lawless, J., Pering, K., Peterson, E., Flores, J., Ponnamperuma, C., Kaplan, I.R. and Moore, C. (1970) Evidence for extraterrestrial amino-acids and hy- drocarbons in the Murchison meteorite. Nature, 228, 923-926. [39] Wolman, Y., Haverland, W. and Miller, S.L. (1972) Non- protein amino acids from spark discharges and their comparison with the Muchison meteorite amino acids. Proc. Natl. Acad. Sci. USA, 69, 809-811. [40] Sorimachi, K. and Ui, N. (1975) Ion-exchange chroma- tographic analysis of iodothyronines. Anal. Biochem., 67, 157-165. [41] van der Walt, B, Cahnmann, H.J. (1982) Synthesis of thyroid hormone metabolites by photolysis of thyroxine and thyroxine analogs in the near UV. Proc. Natl. Acad. Sci. USA, 79, 1492-1496. [42] Shizuka, H., Sorimachi, K., Morita, T., Nishiyama, K. and Sato, T. (1971) Photochemical oxidation of 4, 5, 9, 10tetrahydropyrenes. Bull. Chem. Soc. Japan, 44, 1983- 1984. [43] Sorimachi, K., Morita, T. and Shizuka, H. (1974) Photo- cyclization of 〔2,2〕metacyclophane at 2537 A.. Bull. Chem. Soc. Japan, 47, 987-990. [44] Gilbert, W. (1986) The RNA World. Nature, 319, 618. [45] Sorimachi, K. and Okayasu, T. (2003) Gene assembly consisting of small units with similar amino acid compo- sition in the Saccharomyces cerevisiae genome. Myco- science, 44, 415-417. [46] Hochberg, Y. and Tamhane, A.C. (1987) Multiple com- parison procedures, In Probability and Mathematical Sta- tistics (eds. Y. Hochberg and A.C. Tamhane), John Wiley & Sons, New York, 274-309. [47] Sorimachi, K., Okayasu, T., Ebara, Y. and Nakagawa, T. (2005) Mathematical proof of genomic amino acid com- position homogeneity based on putative small unts. Dokkyo J. Med. Sci., 32, 99-100. [48] Bergey’s Mmanual of Systemic Bacteriology. [49] Fleischmann, R.D., Adams, M.D., White, O., Clayton, R.A., Kirkness, E.F., Kerlavage, A.R. et al. (1995) Whole -genome random sequencing and assembly of Haemo- philus influenzae Rd. Science, 269, 496-512. [50] International Human Genome Sequencing Consortium. (2001) Initial sequencing and analysis of the human ge- nome. Nature, 409: 860-921. [51] Venter, J.C., Adams, M.D., Myers, E.W., Li, P.W., Mural, R.J., Sutton, G.G., Smith, H.O., Yandell, M., Evans, C.A., Holt, R.A. et al. (2001) The sequence of the human ge- nome. Science, 291, 1304-1351. [52] Sorimachi, K. and Okayasu, T. (2004). Classification of eubacteria based on their complete genome: where does Mycoplasmataceae belong? Proc. R. Soc. Lond. B (Supp l.), 271, S127-S130. [53] Dayhoff, M.O., Park, C.M. and McLaughlin, P.J. (1977) Building a phylogenetic trees: cytochrome C. In: Atlas of protein sequence and structure. National Biomedical Foundation, Washington, D.C., 5, 7-16. [54] Sogin, M.L., Elwood, H.J. and Gunderson, J.H. (1986) Evolutionary diversity of eukaryotic small subunit rRNA genes. Proc Natl Acad Sci USA, 83, 1383-1387. [55] DePouplana, L., Turner, R.J., Steer, B.A. et al. (1998) Genetic code origins: tRNAs older than their synthetases? Proc Natl Acad Sci USA, 95, 11295-11300. [56] Doolittle, W.F. and Brown, J.R. (1994) Tempo, mode, the progenote, and the universal root. Proc Natl Acad Sci USA, 91, 6721-6728. [57] Maizels, N. and Weiner, A.M. (1994) Phylogeny from function: evidence from the molecular fossil record that tRNA originated in replication, not translation. Proc Natl Acad Sci USA, 91, 6729-6734. [58] Sakagami, M., Nakayama, T., Hashimoto, T. et al. (2006) Phylogeny of the centrohelida inferred from SSU rRNA, tubulin, and actin genes. J. Mol. Evol., 61, 765-775. [59] Okayasu, T. and Sorimachi, K. (2008) Organisms can essentially be classified according to two codon patterns. Amino Acids, 36, 261-271. [60] Bentley, S.D., Chater, K.F., Cerdeño-Tárraga, M.A., Challis, G.L., Thompson, N.R., James, K.D., Harris, D.E.,  K. Sorimachi / Natural Science 1 (2009) 107-119 Copyright © 2009 SciRes. OPEN ACCESS 119 Quail, M.A., Kieser, H., Harper, D. et al. (2002) Com- plete genome sequence of the model actinomycete Streptomyces coelicolor A3(2). Nature, 417, 141-147. [61] Glass, J.I., Lefkowitz, E.J., Glass, J.S., Heiner, C.R., Chen, E.Y. and Cassell, G.H. (2000) The complete se- quence of the mucosal pathogen Ureaplasma urealyticum. Nature, 407, 757-762. [62] Sueoka, N. (1988) Directional mutation pressure and neutral molecular evolution. Proc. Natl. Acad. Sci. USA, 85, 2653-2657. [63] Chargaff, E. (1950) Chemical specificity of nucleic acids and mechanism of their enzymatic degradation. Experi- entia, VI, 201-209. [64] Rundner, R., Karkas, J.D., and Chargaff, E. (1968) Sepa- ration of B. subtilis DNA into complementary strands. 3. Direct analysis. Proc. Natl. Acad. Sci. USA, 60, 921-922. [65] Nikolaou, C. and Almirantis, Y. (2006) Deviations from Chargaff’s second parity rule in organelle DNA insights into the evolution of organelle genomes. Gene, 381, 34-41. [66] Bell, S.J. and Forsdyke, D.R. (1999) Deviations from Chargaff’s second parity rule with direction of transcrip- tion. J. Theor. Biol., 197, 63-76. [67] Mitchell, D. and Bridge, R. (2006) A test of Chargaff’s second rule. Biochem. Biophys. Res. Commun., 340, 90-94. [68] Gray, M.W., Burger, G. and Lang, B.F. (1999) Mito- chondrial evolution. Science, 283, 1476-1481. [69] Raven, J.A. and Allen, J.F. (2003) Genomics and chloro- plast evolution: what did cyanobacteria do for plants? Genom. Biol., 4, 209-215. [70] Brown, W.M., George, Jr.M. and Wilson, A.C. (1979) Rapid evolution of animal mitochondrial DNA. Proc. Natl. Acad. Sci. USA, 76, 1967-1971. [71] Kimura M. (1983) The neutral theory of molecular evo- lution. Cambridge, Cambridge Univ. Press. [72] Van Nimwegen, E., Crutchfield, J.P. and Huynen, M. (1999) Neutral evolution of mutational robustsness. Proc. Natl. Acad. Sci. USA, 96, 9716-9720.
|