Paper Menu >>
Journal Menu >>
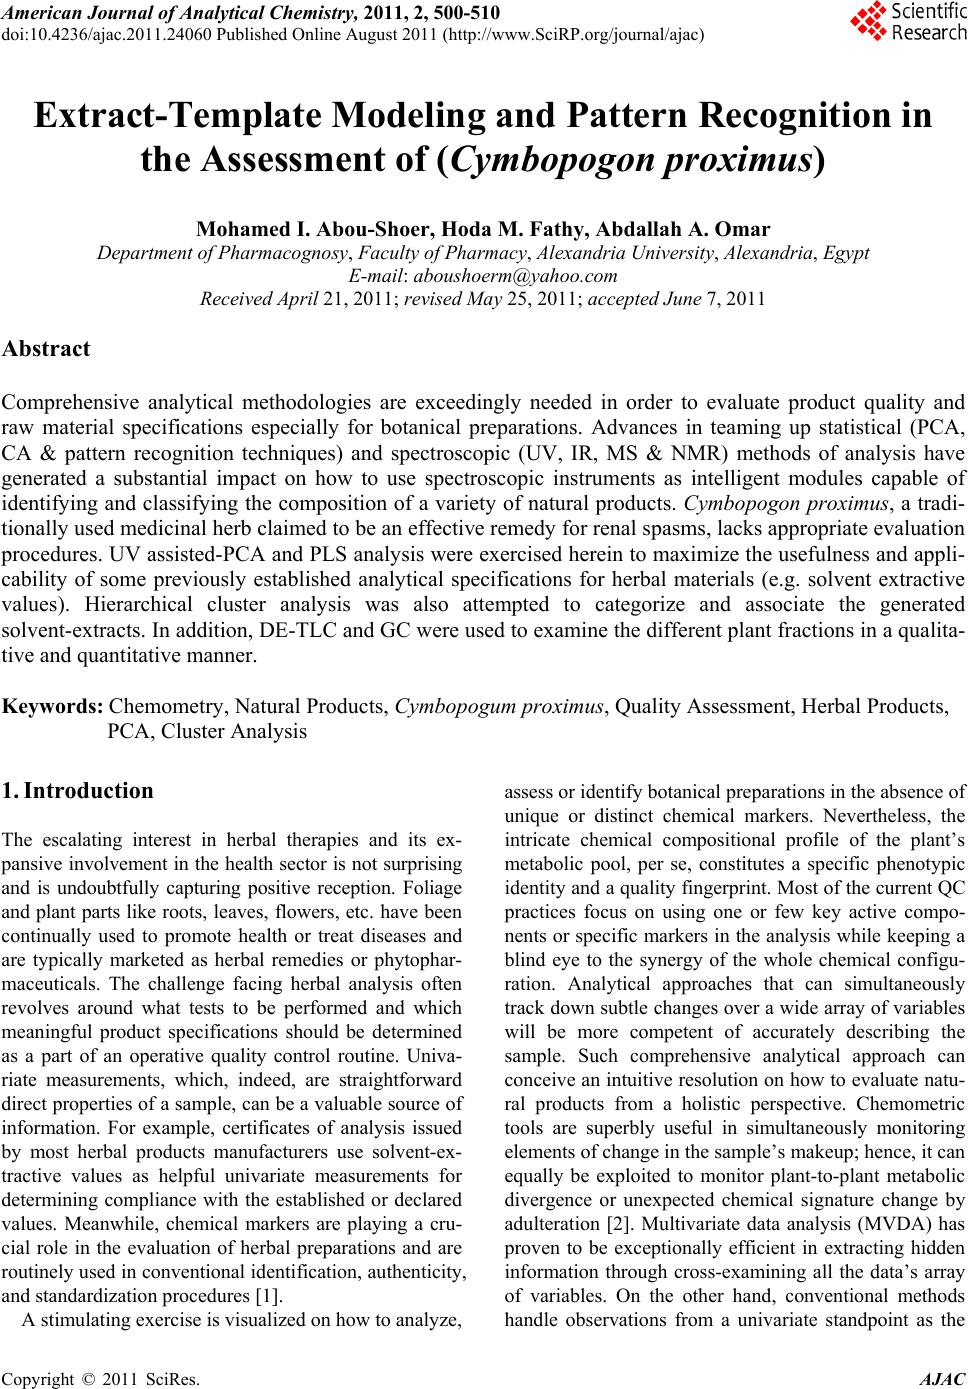 American Journal of Anal ytical Chemistry, 2011, 2, 500-510 doi:10.4236/ajac.2011.24060 Published Online August 2011 (http://www.SciRP.org/journal/ajac) Copyright © 2011 SciRes. AJAC Extract-Template Modeling and Pattern Recognition in the Assessment of (Cymbopogon proximus) Mohamed I. Abou-Shoer, Hoda M. Fathy, Abdallah A. Omar Department of Ph arm ac og n os y , Faculty of Pharmacy, Alexandria University, Alexandria, Egypt E-mail: aboushoerm@yahoo.com Received April 21, 2011; revised May 25, 2011; accepted June 7, 2011 Abstract Comprehensive analytical methodologies are exceedingly needed in order to evaluate product quality and raw material specifications especially for botanical preparations. Advances in teaming up statistical (PCA, CA & pattern recognition techniques) and spectroscopic (UV, IR, MS & NMR) methods of analysis have generated a substantial impact on how to use spectroscopic instruments as intelligent modules capable of identifying and classifying the composition of a variety of natural products. Cymbopogon proximus, a tradi- tionally used medicinal herb claimed to be an effective remedy for renal spasms, lacks appropriate evaluation procedures. UV assisted-PCA and PLS analysis were exercised herein to maximize the usefulness and appli- cability of some previously established analytical specifications for herbal materials (e.g. solvent extractive values). Hierarchical cluster analysis was also attempted to categorize and associate the generated solvent-extracts. In addition, DE-TLC and GC were used to examine the different plant fractions in a qualita- tive and quantitative manner. Keywords: Chemometry, Natural Products, Cymbopogum proximus, Quality Assessment, Herbal Products, PCA, Cluster Analysis 1. Introduction The escalating interest in herbal therapies and its ex- pansive involvement in the health sector is not surprising and is undoubtfully capturing positive reception. Foliage and plant parts like roots, leaves, flowers, etc. have been continually used to promote health or treat diseases and are typically marketed as herbal remedies or phytophar- maceuticals. The challenge facing herbal analysis often revolves around what tests to be performed and which meaningful product specifications should be determined as a part of an operative quality control routine. Univa- riate measurements, which, indeed, are straightforward direct properties of a sample, can be a valuable source of information. For example, certificates of analysis issued by most herbal products manufacturers use solvent-ex- tractive values as helpful univariate measurements for determining compliance with the established or declared values. Meanwhile, chemical markers are playing a cru- cial role in the evaluation of herbal preparations and are routinely used in conventional identification, authenticity, and standardization procedures [1]. A stimulating exercise is visualized on how to analyze, assess or identify botanical preparations in the absence of unique or distinct chemical markers. Nevertheless, the intricate chemical compositional profile of the plant’s metabolic pool, per se, constitutes a specific phenotypic identity and a quality fingerprint. Most of the current QC practices focus on using one or few key active compo- nents or specific markers in the analysis while keeping a blind eye to the synergy of the whole chemical configu- ration. Analytical approaches that can simultaneously track down subtle changes over a wide array of variables will be more competent of accurately describing the sample. Such comprehensive analytical approach can conceive an intuitive resolution on how to evaluate natu- ral products from a holistic perspective. Chemometric tools are superbly useful in simultaneously monitoring elements of change in the sample’s makeup; hence, it can equally be exploited to monitor plant-to-plant metabolic divergence or unexpected chemical signature change by adulteration [2]. Multivariate data analysis (MVDA) has proven to be exceptionally efficient in extracting hidden information through cross-examining all the data’s array of variables. On the other hand, conventional methods handle observations from a univariate standpoint as the  M. I. ABOU-SHOER ET AL. Copyright © 2011 SciRes. AJAC 501 key data processor and consequently they only expose limited information [3]. Cymbopogon proximus, Family Gramineae, locally known as Halfa-bar, is an aromatic densely-tufted grass growing wildly and widely in Upper Egypt. The herb is highly reputed in folkloric medicine as an effective di- uretic, renal or abdominal antispasmodic agent, and for relieving bronchial asthma as well. The herb exerts its unique pharmacological action through relaxation of the smooth muscle fibers without abolishing the propulsive movement of the tissue, thus, it is traditionally used in the expulsion of renal and ureteric calculi [4]. The ses- quiterpene cryptomeridiol (proximadiol) has been pre- viously reported to be responsible for its antispasmodic activity [5,6]. The plant itself or admixed with other herbs like Ammi visnaga, as Sekem® tea, or khellagon® capsules, is marketed for renal ailments. Proximol® tab- lets or effervescent granules are labeled to contain stan- dardized C. proximus extract. A colorimetric method has been reported to quantitatively assess proximadiol in C. proximus after separation from the extract by preparative TLC [7]. In addition, the amount of cryptomeridiol in the petroleum ether or ether extracts was assessed by GLC [8]. The study in hand is designed to explore the potential of using chemometric approaches to analyze a family of data sets derived from the UV spectra (UV assisted-PCA and PLS analyses) for a collection of systematically gen- erated C. proximus solvent extracts. The extracts were assembled in such a manner to suit correlating chemical- ly communicative groups pertinent to the nature of the extract. The collected spectral data can be used for pre- dicting the membership of samples to pre-defined chem- ical profile (solvent-extractives). GC and DE-TLC tech- niques were also introduced as simple and selective me- thods for routine analysis. Moreover, the plant’s antihis- taminic activity on guinea pig ileum was investigated to substantiate its traditional application in asthma. 2. Experimental 2.1. Biological Materials Plant material.The aerial parts of Cymbopogon proximus, collected from Luxor, Egypt, were air-dried in shade before processing. It was identified by the Department of Botany, Faculty of Science, Alexandria University. Other plant samples were purchased from four different herbal stores (A - D). In vitro testing. Guinea pig ileum was used to evaluate the antihistaminic activity of the different extracts. Con- tractions were expressed as a percentage inhibition of the response to histamine dose. 2.2. Chemicals & Reagents Light petroleum, hexane, benzene, Dichloromethane, isopropanol, toluene, acetone, ethylacetate, methanol and ethanol are analytical grade. TLC analysis: Silica gel GF-254, pre-coated TLC plates, 0.25 mm thick, E. Merck, Darmstadt, Germany. The developed TLC plates were analyzed under UV lamp (Hanovia lamps, Germany) at λ 254, 366, or after spraying with either of ferric chloride or (anisaldehyde/ H2SO4) reagents. Dichloroethane: isopropanol 100:3 (system I); dichloromethane: ethylacetate: glacial acetic acid 30:30:1 (system II); were used as mobile phases. Silica gel (10 - 40 µ, mesh size), E. Merck, Darmstadt, were used for column chromatography Menthol, thymol, borneol, camphor, eugenol, and cineol, are BDH laboratory reagents. Reference solutions were prepared in concentrations 10 mg/ml for the solid compounds or 0.3 ml/ml for cineol and 0.1 ml/ml euge- nol in methanol. 2.3. Apparatus UV-VIS spectra were carried on a Helios α Thermo- Spectronic Spectrophotometer, England, supported with software Vision 32, using 1 cm bath length quartz cells. GC was carried on Perkin Elmer, using RTX-5 (0.32 mm, 30 m) capillary column, and connected to FID de- tector, carrier gas was nitrogen with a flow rate of 15 ml/min. The detector temperature was set at 225˚C while the injector temperature was set at 200˚C. Initial column temperature was set 50˚C and held for 3 min. A gradient temperature a ramp of 20˚C /min was applied to a final temperature 210˚C that was maintained during the final 10 minutes. GC/MS was carried on Fenningan mat SSQ 7000 with digital DEC 3000 workstation, column DB-5 (5% phenyl) methyl polysiloxane (30 m × 0.25 mm id) carrier gas was helium with a flow rate of 1 ml/min, initial temperature started with 50˚C, which was held for 3 min, and then elevated to 300˚C with a ramp 5˚/min and maintained for a final 5 min. A Fujifilm Finepix A-210 X 3.2 mega-pixel digital camera was used to capture the TLC plate-images. Software: SIMCA-P by Umetrics and hierarchical clustering explorer and Sorbfil for digitizing the TLC chromatogram images [9]. 2.4. Preparation of the Extracts Two types of extracts were prepared. Selective solvent extracts which were prepared by ex- tracting five weights (each 10.0 g) of the powdered au-  M. I. ABOU-SHOER ET AL. Copyright © 2011 SciRes. AJAC 502 thentic plant with 75 ml of each of the following five solvents, light petroleum, dichloromethane, ethylacetate, alcohol and water. Aqueous extraction was carried out using water at ambient temperature and boiling water). The extracts were filtered and the solvents were evapo- rated under reduced pressure. The extraction process for each solvent is repeated ten times, using fresh material each time, to generate ten replicate extracts for each sol- vent. In parallel, successive solvent extracts were prepared by extracting 10 grams of the plant powdered material successively with light petroleum followed by dichloro- methane, ethylacetate, alcohol and finally water, once more this process was repeated ten times in order to ob- tain ten replicates per each solvent. All extracts that have been prepared were re-dissolved in the appropriate solvent and neatly filtered through 0.45 µm pvp filter before processing. Different plant extracts analyzed by GC were prepared in a concentration of 25 mg/ml. 2.5. Preparation of Extract-Solutions (UV Spectra Calibration Set Solutions) All selective and successive solvent extracts—for all replicates—were dissolved in methanol and stock solu- tions (10%) for each different extract were prepared. These solutions were used to generate appropriate dilu- tions that would produce suitable UV absorbances. Selective solvents-extractives solutions. Hot water extracts prepared in concentrations of 0.18333mg/ml, aqueous extract (ambient temperature) as 0.18333mg/ml solutions, alcoholic extracts (0.0625mg/ml), ethylacetate extracts (0.076923mg/ml), dichloromethane extracts (0.125 mg/ml), and light petroleum extracts as (0.25 mg/ml) solutions. Fractional solvents-extractives solutions (succes- sive). Aqueous successive extracts prepared as 0.15714 mg/ml solutions, alcoholic successive extracts (0.0625 mg/ml), ethylacetate successive extract, (0.045 mg/ml) and dichloromethane extracts as (0.142857mg/ml) solu- tions. Sample dilution (PLS study). The initial calibration set, of PLS-1, is constructed using UV-absorbances (av- erage of three runs) were recorded for different concen- trations from the following extracts: 1) Ethylacetate successive extract in concentration ranges from 0.06 - 0.12 mg/ml (10 sample concentra- tions). 2) Alcohol successive extract, 12 samples of different concentrations, ranging from 0.01 - 0.09 mg/ml. 3) Alcoholic extract, 10 samples of different concen- trations, ranging from 0.06 - 0.09 mg/ml. Extracts Electronic Models The prediction ability of the calibration model for the determination of the content of the extract was tested using 3 samples of different known identity and content. A second, PLS-2, calibration set was constructed by using 21 different alcoholic extract samples, in concen- tration ranges from 0.03 - 1.2 mg/ml. Prediction ability was assessed with test set T containing 6 samples. These samples are composed of two new concentration samples from the alcoholic extract and four artificially reconsti- tuted extracts. These were produced initially by succes- sively fractionating 1 gm dried alcoholic extract of C. proximus with the following solvents; light petroleum, dichloromethane, ethylacetate, ethanol and water. Their compositional ratios were found to be 3%, 13%, 22%, 51% and 11%, respectively. The reconstituted extracts were created by adding these solvent-extractives in al- tered ratios (different from its natural existence) to for- mulate the modified or mutilated mixtures. Mixture 1 consisted of 1% light petroleum fraction, 33% dichloro- methane fraction, 33% ethylacetate fraction, 16% alco- holic fraction and 17% aqueous fraction. Mixture 2 con- sisted of 10% dichloromethane fraction, 40% ethylace- tate fraction, 20% alcoholic fraction and 30% aqueous fraction, Mixture 3 consisted only of 77.3% alcoholic fraction and 16.7% aqueous fraction. Mixture 4 consisted of 100 % alcoholic fraction of the alcoholic extract. 2.6. Isolation of Proximadiol The dried light petroleum extract (24 gm, oily yellowish green residue) of air-dried powdered plant material (600 g) was chromatographed on 480 gm (10 - 40 µ silica gel) using negative pressure. Light petroleum was used for elution and the polarity was raised by increasing concen- trations of ethylacetate. 110 mg of proximadiol (crypto- meridiol) was separated from the fraction eluted with 60% ethylacetate in light petroleum. Its identification was based on its different physical and spectral proper- ties in comparison with the reported ones. 2.7. Preparation of the Commercial Products Samples Both 10 g from the herbal tea Sekem® as well as 10 g of lab-prepared imitated compositional mixture of the same locally available herbal constituents were extracted with dichloromethane. 60 grams of Proximol® effervescent granules, (con- taining 18.6 mg C. proximus extract standardized to con- tain 8 mg proximadiol/100 g granules, in addition to hexamine and piperazine citrate) was dissolved in 300 ml of water, gradually added, and then the aqueous extract is extracted three times with dichloromethane. The organic  M. I. ABOU-SHOER ET AL. Copyright © 2011 SciRes. AJAC 503 layer was evaporated to dryness, the residue was re- served to be used for TLC, GC, and chemometric test set C analysis. 2.8. Selection of Internal Reference Menthol, thymol, borneol, camphor, eugenol and cineol were experimented under the adopted GC conditions to explore the suitability of any of them as an internal stan- dard. The tR of cineol (8.3 min) was found to be appro- priate and not interfering with sample peaks. Hence, 0.2 ml of its solution was added to all extracts as the appro- priate internal reference. 3. Results and Discussion 3.1. Chemometric Assisted-UV Evaluation of Cymbopogon Extracts 3.1.1. PCA An al ysi s Initially, the first multivariate calibration project was created, using SIMCA-P (Soft Independent Modeling of Class Analogy), to construct a mathematical model that relates the sample’s UV-absorbances to the type of the extract (whether selective or successive) and conse- quently, predict its affiliate fit-in class. All of the UV absorbance data (average of three runs) of the 100 extracts (4 different succesive solvent x 10 replicates and 6 different slective solvents x 10 replicates) produced by different solvent extraction of C. proximus were em- ployed to construct the training set of the PCA models. R2X was calculated as 0.992 (close to 1 indicates an excellent model for assigning the solvent extraction mode). In addition, the model was electronically cross-validated. The prediction ability of the calibration model for the determination of the class identity of the extract was tested using external test sets A & B. Test set A con- tained ten new samples of different C. proximus extracts prepared with the same extraction protocol (4 different succesive solvent, 6 different selective solvents), whilst test set B was prepared by deliberately extracting six different plants, namely Ammi visnaga, Ambrosia, Achillea, Chicory, Liquorice and Mentha. Test set B contained 21 extracts prepared using the same selective solvents for the mentioned plants with the same extrac- tion routine. The described project has proven to be valuable in showing that the UV spectra of the different extracts were successful in predicting the solvent-class identity for the ten positive validation samples (test set A), as demonstrated by the small variation of DmodX values, and conclusively decisive in indicating that samples of prediction set B are typical outliers as shown by their significantly different Dmodx values (negative identity). Furthermore, the score scatter plot described in Figure 1, clearly reveals that different extracts categorically associated in proximity to each others, which reflects a sensible resemblance in content-constituents. Meanwhile, the 2D plot failed to clearly express the resolution between the clusters, but, instead the 3D representation (Figure 2) have successfully corrected the aberration in the 2D data representation and displayed the distant al- location of the clusters. 3.1.2. HCA A nal ysi s Alternatively, HCA (hierarchical Cluster Analysis) was explored to examine the capacity of the UV spectra of the extract to reveal authenticity of the commercial C. proximus samples. Hence, four C. proximus samples Alcoholic extract Ethylacetate extract Light petroleum extract Dichloromethane extract Hot aqueous extract Aqueous extract Ethylacetate succ. extract Dichloromethane succ. extract Aqueous succ. Extract Figure 1. The score scatter plot of the project.  M. I. ABOU-SHOER ET AL. Copyright © 2011 SciRes. AJAC 504 Figure 2. The 3D score scatter plot of the project colored as Figure 1. were purshased from 4 different herb stores, designated as A, B, C and D, and were similarly treated with the same extraction protocol as the authentic sample but in three triplicates. Then, separately, each solvent-extract for the commercial samples-along with the 10 replicates for the equivalent selective solvent-extracts for the authentic sample of C. proximus numbered from 1 to 10-, were scrutinized by HCA. Figures 3-4 clearly reveals that, regardeless of the solvent used, each of the ten replicates were well grouped together into one cluster and distinctably separate from the commercial samples, as an example the dendogram of light petroleum and alcohol extracts are shown in Figure 3. Nevertheless, some solvent- extracts were found to be, even, equivaluable in distinguishing the source of the sample (as belonging to a specific supplier). Hence, it is clearly obvious that using any solvent for the extraction can conclusively distinguish between the available samples. In parallel, the same analysis was repeated on the ten sample replicates for the successive extracts (five sol- vents) of the authentic samples (numbered from 1-10), along with the equivalent three replicates from the com- mercial extracts. Figure 5 reveals that the ten replicates were again well grouped as one cluster separate from the commercial ones. Furthermore, the alcoholic and aqueous successive procedure can be considered good discrimi- nating routines as they succedded, to great extent, to identify the source of sample. This suggests that deffating the plant prior to the analysis can be considered a wise step to diminish the effect of the fluctuating volatile content due to the evaporation processing steps. 3.1.3. Quantitative Anal y si s Additionally, PLS-1 multivariate analysis, using SIMCA- P, was utilized to explore the possibility of using the ab- sorbance data of the extracts in a quantitative prospect. The linear calibration of the predicted versus observed concentration of all the extracts of the calibration set (Figure 6) had R2 ≥ 0.98. The predicted concentration of the calibration and prediction set samples were of 95% - 109% of their ac- tual values. In Consent, the compositional constitution of any ex- tract is expected to vary once the original sample used for extraction is subjected to any sort of tampering by exhaustion or adulteration. However, the plant’s mono- graph specifications, in this regard, propose adopting or specifying the weight of the “solvent extractive” in some organic solvent as a preliminary indicator in these cases. Alas, these weights are non-informative values that do not actually reflect the chemical nature of the compounds in the sample. However, once a more informative prop- erty, such as an IR or UV absorption characteristics, is related to the sample, a better understanding of the chemical compositional pattern of such extract can be reliably achieved. Accordingly, constructing a PLS-2 model, has pro- duced R2x cumulative of 0.981 and R2Y 0.928. Mixtures 1 to 4 were classified as not belonging to the model ac- cording to their DmodX values, while the two concentra- tion samples of the same alcoholic extract were in agreement with the model, which was also capable of predicting their concentrations. 3.2. GC Analy s i s When all extracts (selective and successive) were ana- lyzed by GC, four main peaks at tR 11.2, 14.1, 15.0 and 17.7 min were detected and were found to be in common in all the GC chromatograms. Hence, cineol was used as an internal standard in all the experimented extracts and  M. I. ABOU-SHOER ET AL. Copyright © 2011 SciRes. AJAC 505 (a) (b) Figure 3. HCA analysis for the UV spectra for (light petroleum (a) and alcohol (b) solvent extracts respectively) from authen- tic Cymbopogon proximus samples R and suppliers A, B, C and D. (a) (b) Figure 4. HCA analysis for the UV spectra for (ethylacetate (a), and water (b) successive-solvent extracts respectively) from authentic Cymbopogon proximus samples R and suppliers A, B, C and D. (a) (b) Figure 5. HCA analysis for the UV spectra for (solvent selective (a) light petroleum (Pe), methylene chloride (CCl), ethylace- tate (OAc), alcohol (OH) and aqueous (Aq), and solvent successive (b)) from authentic Cymbopogan proximus samples.  M. I. ABOU-SHOER ET AL. Copyright © 2011 SciRes. AJAC 506 (a) (b) Figure 6. The linear calibration of the predicted versus observed concentration of two of the extracts of the calibration set. their relative tR were found to be 1.34, 1.69, 1.83, 2.13 respectively and the normalized total areas (As/Ast) of these four peaks were calculated and are listed in Table 1. Obviously, the normalized total peak areas for the re- solved peaks are at maximum in the light petroleum and dichloromethane extracts, in a lesser amount in ethylace- tate extract, minimum in alcoholic extract and barely observed in the aqueous extract (chromatogram 1). Subsequently, GC/MS analysis of the dichloromethane extract has helped in the identification of piperitone (peak 1). However, peaks 2 and 3 were proposed by the software library of MS data, as nerolidol and β-eudesmol, respectively. Finally, peak 4 identity was additionally secured as proximadiol by spiking the injected samples with reference proximadiol. Validation of the GC Method Accuracy and Precision Precision, expressed as the standard deviation, ob- tained by repetitive four injections of the dichlormethane extract, was calculated as 0.08 and relative standard deviation as 5.7%. Accuracy is assessed by calculating percentage recovery using minimum three concentration levels and three replicates of each concentration. Percen- tage recovery was calculated by injecting five samples of different concentrations of dichloromethane extracts (30, 45, 60, 70 and 120 mg/ml). The normalized total areas was measured and used to construct the calibration curve. Three additional samples with concentrations (35, 75 and 115 mg/ml) were injected in triplicate injections and the average percentage recovery was calculated and found 88% - 90%. The above-mentioned protocol was used to assess the amount of Cymbopogon in a commercial herbal prepara- tion (Sekem renal herbal tea). The percentage of Cym- bopogon in the herbal formula was measured by calcu- lating normalized peak areas ratio, the markers were evident but in much lesser amount in the marketed sam- ple as the normalized peak areas ratio for the marketed product was calculated as 5% of the herbal tea. Despite the fact that it is stated in the inserted pamphlet to con- tain 20%, Halfa bar (Chromatogram 2). 3.3. Evaluation of C. proximus by Digitally Enhanced TLC (DE-TLC) Quantitative analysis by TLC was carried out using Sor- bifil TLC videodensitometer. A densitometric calibration curve was constructed by spotting serial dilutions of pro-  M. I. ABOU-SHOER ET AL. Copyright © 2011 SciRes. AJAC 507 Chromatogram 1. GC chromatogram of the light petroleum and dichloromethane solvent extracts. Table 1. The normalized total areas of the marker peaks relative to the internal standard for each extract. Solvent Ratio Light petroleum 1.78 Dichloromethane 1.81 Ethylacetate 1.36 ethanol 0.96 water 0.24 Dichloromethane successive 0.69 Ethylacetate successive 0.51 Ethanol successive 0.50 Aqueous successive 0.05 ximadiol standard and revealing the spots with anisalde- hyde SR (Figure 7). Proximadiol can be evaluated quantitatively by ex- tracting the powdered herb with light petroleum or op- tionally by dichloromethane. The amount of proximadiol in the Proximol® effervescent granules dichloromethane extract was determined according to the peak area from the calibration curve and was found 4 mg/50 g powdered drug which is in accordance to the stated label. While, the amount of proximadiol in the root extract was found 10.5 mg % while that of the aerial parts 5.6 mg %. The more polar plant extracts (ethylacetate) were ana- lyzed by TLC using solvent system II. The developed chromatograms have shown two well-defined UV ab- sorbing spots at Rf 0.54 and Rf 0.68; on spraying with ferric chloride; the upper spot turned to orange color while the lower spot acquired a green color. The ethyla- cetate successive-solvent fractions contained both spots in a reasonable amount. A calibration curve was built by spotting serial dilutions of EtOAc-successive fraction and revealing with FeCl3 SR then the peak areas for the TLC-markers of the ethylacetate successive extract of Sekem® was calculated (Figure 8) and was found to re- flect the presence of plant material equivalent to ca. 33 mg per 0.77 g sample extract i.e. 4.4% of the total con- tent. TLC Validation Selectivity: To secure that the selected markers spots are distinctive and characteristic for Cymbopogon proximus, each indi- vidual plant of the components of Sekem renal herbal tea which are Mentha, Ammi visnaga, Liquorice, Chicory, Achillea, Ambrosia was successively extracted with light petroleum, dichloromethane, ethyl acetae and ethanol. The developed TLC plates for these extracts have re- vealed that no other spots are interfering with the above mentioned marker spots. Accuracy and Precision RSD% (n = 3) Recovery (%) Concentration 3.04 108% 24 mg/ml 3.98 95.6% 32 mg/ml 1.99 95% 40 mg/ml Linearity Standard solutions at three conc. Levels 20 - 60 mg/ml were used. Each standard solution was examined three times and the acceptability of linearity was judged by examining the correlation coefficient R2 (>0.96) (Figure 9). 3.4. Antihistaminic Activity of Cymbopogon proximus Extracts In folkloric use, C. proximus is included in the herbal mixtures used in the treatment of bronchial asthma. Early in 1960, the alcoholic solution of the oleoresin was given orally to guinea pigs. It was found that it gradually de- velops a protective action against bronchial spasms pro- duced by histamine sprays. Since then no further trials concerning the antihistaminic properties were performed.  M. I. ABOU-SHOER ET AL. Copyright © 2011 SciRes. AJAC 508 Chromatogram 2. GC chromatogram of the commercial drugs. Calibration curve of proximadiol y = 27545x + 80721 R 2 = 0.9944 0 100000 200000 300000 400000 500000 0510 15 mg area (a) (b) Figure 7. (a)-TLC chromatogram, (b)-Plot of the chromatogram and of the reference proximadiol.  M. I. ABOU-SHOER ET AL. Copyright © 2011 SciRes. AJAC 509 Figure 8. Linear calibration of the serial concentrations of EtOAc-successive fraction. Figure 9. Regression plots. The alcoholic extract produces the maximum inhibition (100%), followed by aqueous extract (80%), ethylacetate (38%), dichloromethane (12%) and light petroleum (8%). 4. Conclusions Authenticity and purity are mandatory key drivers of acceptance for herbal products to consistently meet the approval of regulatory bodies or consumer-defined qual- ity. These requirements are strategic attributes that can be monitored by different chromatographic and spec- troscopic techniques. Accordingly, UV spectroscopy and chemometric analysis were utilized to assess the quality of Cymbopogon proximus. HCA, PCA or PLS, can defi- nitely detect the slightest change in the composition of the plant extract, and again it can easily distinguish any exhaustion or adulteration attempt that might have been encountered during processing the plant material. This routine has proven to be valuable in showing that the UV spectra of the different extracts were successful in pre- dicting the solvent-class identity for the ten positive va- lidation samples. Meanwhile, GC can be used to quanti- tatively evaluate Cymbopogon proximus by extracting the powdered herb with dichloromethane with using cineol as internal standard. 5. References [1] S. Li, Q. Han, C. Qiao, J. Song, C. L. Cheng and H. Xu, “Chemical Markers for the Quality Control of Herbal Medicines: An Overview,” Chinese Medicine, Vol. 3, No. 7, 2008, pp. 1-16. [2] C. Daolio, F. L. Beltrame, A. G. Ferreira, Q. B. Cass, D. A. G. Cortez and M. M. C. Ferreira, “Classification of Commercial Catuaba Samples by NMR, HPLC and Chemometrics,” Phytochemical Analysis, Vol. 19, No. 3, 2008, pp. 218-228. doi:10.1002/pca.1019 [3] M. Franssona, J. Johanssona, A. Spare´na and O. Svens- son, “Comparison of Multivariate Methods for Quantita- tive Determination with Transmission Raman Spectros- copy in Pharmaceutical Formulations,” Journal of Chemo- metrics, Vol. 24, No. 11-12, 2010, pp. 674-680. doi:10.1002/cem.1330 [4] F. M. Abdel-Moneim, Z. F. Ahmed, M. Fayez and H. Ghaleb, “Constituents of Local Plants XIV. The Anti- spasmodic Principle in Cymbopogon Proximus,” Planta Medica, Vol. 17, No. 3, 1969, pp. 209-216. [5] H. D. Locksley, M. B. E. Fayez, A. S. Radwan, V. M. Chari, G. A. Cordell and H. Wagner, “Constituents of Local Plants: XXV, Constitution of the Antispasmodic Principle of Cymbopogon Proximus,” Planta Medica, Vol. 45, 1982, pp. 20-22. doi:10.1055/s-2007-971233 [6] F. E. Evans, D. W. Miller, T. Cairns, G. Vernon Baddeley and E. Wenker, “Structure Analysis of Proximadiol  M. I. ABOU-SHOER ET AL. Copyright © 2011 SciRes. AJAC 510 (Cryptomeridiol by CNMR Spectroscopy,” Phytochemi- stry, Vol. 21, No. 4, 1982, pp. 937-938. [7] E. N. M. El-Sayed, “Investigation of Chemical Constitu- ents of Cymbopogon Species, Family Gramineae,” M.Sc. Thesis, Environmental Studies, Institute of Graduate Stu- dies and Research, Alexandria University, Alexandria, 1990. [8] A. S. Radwan, “An Analytical Method for Proximadiol, the Active Principle of Cymbopogon Proximus,” Planta Medica, Vol. 27, 1975, pp. 93-97. doi:10.1055/s-0028-1097767 [9] A. V. Hess, “Digitally Enhanced Thin Layer Chromato- graphy: An Inexpensive, New Technique for Qualitative and Quantitative Analysis,” Journal of Chemical Educa- tion, Vol. 84, No. 5, 2007, pp. 842-847. |