Vol.1, No.2, 76-82 (2009)
doi:10.4236/health.2009.12013
SciRes
Copyright © 2009 Openly accessible at http://www.scirp.org/journal/HEALTH/
Health
An ion-based chromogenic method of detecting for
inorganic phosphate in serum and milk
Cai-Xia Yin1*, Jing Su1, Fang-Jun Huo2*, Pin Yang1
1Institute of Molecular Science, Key Laboratory of Chemical Biology and Molecular Engineering of Ministry of Education, Shanxi
University, Taiyuan, China; yincx@sxu.edu.cn
2Research Institute of Applied Chemistry, Shanxi University, Taiyuan, China; huofj@sxu.edu.cn
Received 10 July 2009; revised 21 July 2009; accepted 22 July 2009.
ABSTRACT
A rapid method for the determination of inor-
ganic phosphate in serum and milk by an
ion-based chromogenic is described. Serum
samples were detected directly by our system,
and milk was also detected after degreased
through centrifugation. By this procedure the
samples are not diluted. Mean serum inorganic
phosphate concentration found in healthy indi-
vidual is 1.14mmol/L. Values found in serum is
in good agreement with those previously re-
ported. Mean inorganic phosphate concentra-
tion from foremilk and commercial milk are
2.5mmol/L and 12.5mmol/L respectively.
Keywords: UV-Vis Spectra; Pyrocatechol Violet;
Ytterbium Chloride; Phosphate; Serum; Milk
1. INTRODUCTION
Phosphate is involved in important biomineralization
processes such as bone formation and also processes that
are clearly pathological such as the genesis of renal
stones. Consequently, its determination in biological
fluids is important [1]. In a clinical setting, inorganic
phosphate levels in serum are determined as part of a
routine blood analysis. The typical inorganic phosphate
concentration in human serum range is 0.81-2.26mmol/L
[2]. Individuals with abnormally high phosphate levels
are diagnosed with hyperphosphatemia, which manifests
in acute or chronic renal failure, hypoparathyroidism and
excessive Vitamin D intake. And we know that higher
serum phosphate levels would be associated with in-
creased mortality risk among people with CKD [3-5].
Those with low inorganic phosphate levels suffer from
hypophosphatemia which can be associated with rickets,
hyperthyroidism, or Fanoci Syndrome [6-8]. In addition,
there is generally a reciprocal relationship between se-
rum calcium and inorganic phosphorus levels. High in-
organic phosphorus in serum restrains the intake of cal-
cium.
Regarding the newborn baby, foremilk or milk is the
most main headspring they grow on. But exactly this
time is the quickest time when young child grows, being
in the bone blooming period and the cerebrum and the
intelligence still being imperfect stage. So the right
amount nutrition could guarantee the normal growth, and
prevent malnutrition, rickets, anemia and so on. Espe-
cially if absorbing calcium phosphorus imbalance, can
cause the low calcium blood sickness, the rickets [9].
Moreover iron in the milk is easy to form insolubly iron
compound when affected by high phosphate and calcium,
cannot be absorbed by the human body, which may
cause the young child to occur lacking the iron anemia.
In normal foremilk the calcium phosphorus proportion is
2: 1, is easy to be absorbed, to prevent and control the
rickets. But the milk is 1: 2, is not easy to be absorbed.
Therefore, determination the calcium phosphorus con-
tent from foremilk and milk is very important.
Most of the procedure for the colorimetric determina-
tion of inorganic phosphate are based on the formation
of molybdophosphoric acid with further reduction to
heteropolymetric molybdenum blue [10-12] on direct
measurements of molybdo- and vanadomolybdophos-
phoric acid [13,14], or on complex formation between
molybdophosphoric acid and basic dyes [15]. These
chemical methods have serious shortcomings, however:
Molybdate reduction is affected by slight changes in pH,
the rate of complex formation is markedly influenced by
protein concentration, and the acidity required leads to
hydrolysis of organic phosphate, which results in over
estimates of Pi concentration [16].
In our work, we developed a rapid method for the de-
termination of phosphate in serum and milk by an
ion-based chromogenic. Serum samples were detected
directly by our system, and milk was also detected after
degreased through centrifugation. By this procedure all
samples are not diluted. Owing to our system’s promi-
nent advantages, it can serve as a hopeful substitute for
C. X. Yin et al. / HEALTH 1 (2009) 76-82
SciRes Copyright © 2009 http://www.scirp.org/journal/HEALTH/
77
Openly accessible at
the molybdenum reagent.
2. MATERIAL AND METHODS
2.1. Reagents and Chemicals
The chemicals used were of analytical-reagent grade. PV
(Pyrocatechol violet) was purchased from Shanghai and
sodium monhydrogenphosphate was purchased from
Beijing. Ytterbium oxide was a product of Rare Earth
Graduate School of China. HEPES was purchased from
Sigma. All solutions were made up with deionized water.
HEPES buffer solutions were obtained by adding NaOH
0.1M solution into 10 mM aqueous HEPES using a
Beckman Φ50 pH meter. Ytterbium chloride was pre-
pared from ytterbium oxide and 37% hydrochloric acid.
Ytterbium ion solution was prepared by dissolving ytter-
bium chloride in water. Serum samples were collected
from health volunteers and stored at -17 until ana-
lyzed. Cow serum was purchased from commercial
pured product. Human milk and commercial milk were
degreased through a Centrifugal filter.
2.2. Instruments and Apparatus
pH determinations were performed using a Beckman
50 pH meter. UV-v(V)is spectra were recorded on a
HP8453 spectrophotometer. PO-120 quartz cuvettes
(10mm) were purchased from Shanghai city of China.
Finnpipette Digitals were purchased from Shanghai of
China. BFX5-320 Low Speed Automatic Balance Cen-
trifuge was purchased from Baiyang Centrifuge factory.
Olympus 2700 Complete Automatic Clinical Biochemis-
try Analysis Apparatus was purchased from Japan.
2.3. Measurement Procedure
Using the PV-HEPES-Yb3+ ensemble, we detected inor-
ganic phosphorus in serum and milk samples. The pro-
cedures were as follows. In 10mM, pH 7.0 HEPES
buffer containing 50μM PV and 100μM Yb3+ (a blue
solution), the serum sample from one healthy volunteer
was gradually titrated into the solution. At the same time
the changes in the absorption peaks of solution in the
UV–Vis spectrum were recorded. When no more
changes in the absorption peaks of the system took place,
titration came to a halt. Then we could calculate the in-
organic phosphorus concentration in serum. Likewise,
the inorganic phosphorus concentrations of human milk
degreased or commercial milk were obtained by above
detecting method.
3. RESULTS AND DISCUSSION
3.1. UV–Vis Spectra
Figure 1a shows the UV–v(V)is spectra obtained when
(a)
(b)
Figure 1. (a) The serum from human was added into
PV-HEPES-Yb3+ with Vserum=0-215 μl; (b) the serum from
cow was added into PV-HEPES-Yb3+ with Vserum=0-90 μl.
titrating the serum from a health human into the 10 mM,
pH 7.0 HEPES buffer solution containing 100 μM YbCl3
and 50 μM PV. With the addition of serum, the absorp-
tion peak at 623 nm decreased, while the peak at 444 nm
increased. When the total volume of added serum
reached 210 μL, titration ended. The concentration of
inorganic phosphorus was 0.95 mmol/L. Similarly, Fig-
ure 1b shows UV–v(V)is spectra of serum from cow
titrated. The concentration of inorganic phosphorus from
cow was 2.20 mmol/L. Figure 2a shows UV–v(V)is
spectra changes when titrating milk from healthy woman
into our system. The inorganic phosphorus concentration
of milk from lactation mother was 2.31 mmol/L. Figure
2b shows UV–v(V)is spectra changes of milk from com-
merce process titrated. The inorganic phosphorus con-
centration of milk from commerce was 11.54 mmol/L.
3.2. Selectivity over Other Constituents
In published paper, we addressed the selectivity of the
system. We knew that the ensemble exhibited excellent
C. X. Yin et al. / HEALTH 1 (2009) 76-82
SciRes Copyright © 2009 http://www.scirp.org/journal/HEALTH/
78
selectivity towards phosphate anions over other common
anions, including Cl, SO4
2, CH3COO, HCO3
and
ClO4
[17]. Serum contains many other organic and in-
organic compounds, such as creatinine, bilirubin, sugar,
albumen, inorganic salts and transition ion besides the
aforementioned ordinary anions. Do these compositions
show some responsibility for the changes in the
UV–v(V)is spectra and color? We took the HEPES
buffer as a blank, and then added 200 μL serum into it.
The result shows that there is no UV–v(V)is absorbance
in the range of from 350 to 1,000 nm, suggesting that
there are no other absorbance peaks coming from other
compounds of the serum in the range of detection in the
UV–v(V)is spectra (Figure 3a). Thus, we may conclude
that the changes in the absorbance peak in this range
resulted completely from the measurement processes and
there was no cumulation or disturbance. To prove that
the universal existence of anions in serum incurs no dis-
turbance to exclude the possibility of interference from
iron or other cations in the measurement, the following
experiments were carried out. Firstly, as soon as the ex-
cessive 2 mM YbCl3 was added into the 2 mM HPO4
2
solution (VYbCl3/VHPO42=1.02:1), precipitation occurred,
a clear solution was gained through centrifugation and
decantation processes; the solution (from 0 to 500 μL)
was then added into 2 mL 10 mM HEPES buffer con-
taining 50 μM PV and 100 μM Yb3+, and no changes in
absorption peak intensity and color were observed, i.e.,
no phosphate was detected in the solution, thus suggest-
ing that the Yb3+ could completely remove HPO4
2 from
solution by forming sediment. Similarly, we added the
excessive YbCl3 into the collected serum samples whose
content of HPO4
2 was presumably quantitated with our
methods. After the mixture had been treated in accor-
dance with the aforementioned procedures, a great deal
of the disposed serum sample(0–500 μL) was added into
(a) (b)
Figure 2. (a) The milk from woman was added into PV- HEPES-Yb3+ with Vmilk=0-65 μl; (b) the serum from cow was added into
PV-HEPES-Yb3+ with Vmilk=0-13 μl.
(a) (b)
Figure 3. (a) UV/Vis spectra: Plot of absorbance (at λ=200-1000 nm) when adding 20 µl urine into HEPES buffer (pH 7.0); (b) when
adding 50 µl milk into HEPES buffer (pH 7.0).
Openly accessible at
C. X. Yin et al. / HEALTH 1 (2009) 76-82
SciRes Copyright © 2009 http://www.scirp.org/journal/HEALTH/
79
Openly accessible at
(a) (b)
Figure 4. (a) the disposed serum sample (0-500 μl) was added into PV-HEPES-Yb3+.(b) UV/Vis spectra λ350800nm: no
pretreatment serum sample (500 μl) was added into HEPES-PV (50 μM).
the 2 mL 10 mM HEPES buffer containing 50 μM
PVand 100 μM Yb3+, and no changes were observed in
absorption peak intensity and system color(Figure 4a).
The experiments excluded the possibility of interference
from other anions with the measurement. In addition, we
added an adequate amount of unpretreated serum sample
into 2 mL 10 mM HEPES buffer only containing 50 μM
PV, and no change in either the UV–v(V)is spectra or the
system color was observed (Figure 4b). The system was
still yellow. The experiments excluded the possibility of
interference from iron or other cations with the meas-
urement.
Now, we see about the selectivity of the detection
system for milk. We took the HEPES buffer as a blank,
and then added 50 μL milk into it. The result shows that
there is no UV–v(V)is absorbance in the range of from
350 to 1,000 nm, suggesting that there are no other ab-
sorbance peaks coming from other compounds of the
milk in the range of detection in the UV–v(V)is spectra
(Figure 3b). Similary process was done for proving no
disturbance from other composition of milk. All results
ensure that our system is special to phosphate of milk.
3.3. Linearity and Detection Limits
Most instrumental methods available for the determina-
tion of phosphate in clinical samples have a common
drawback; that is, their linear calibration range is too
narrow. In our experiment, we plotted the curve with
absorbance values at 623 nm against concentrations
/0–2.5 mM/ of serum added to the PV-HEPES-Yb3+ sys-
tem. We found our measurement obeyed the Beer–
Lambert absorption law very well within the serum con-
centration range of 0–2.5mM. Linear regression with
least-squares fitting yielded a correlation coefficient of
Figure 5. The working curve for serum measurement was plot-
ted with the absorbance value against various concentrations of
serum(0-2.5 mM).
0.99995 (Figure 5). The lower detection limit of our
method is around 10-4 M. And before, we have gotten
our measurement obeyed the Beer–Lambert absorption
law very well within the urine concentration range of
0–70mM [18]. Phosphorus concentrations of milk from
woman or commerce are not higher than 70mM, so this
linear calibration range is enough for milk.
3.4. Validation
In order to validate the accuracy of the method, we de-
tected serum samples by the standard procedure (mo-
lybdenum blue assay for phosphate) and obtained
equivalent results with our measurement. Figure 6 and
Table 1 give the results (spectra) for serum obtained
with the two kinds of detection methods. Finally, the
recovery experiments were performed: The results are
F. j. Huo et al. / HEALTH 1 (2009) 76-82
Openly accessible at http://www.scirp.org/journal/HEALTH/
80
(a-1) (a-2)
(b-1) (b-2)
Figure 6. (a)Left: Uv-Vis spectra of cow serum sample Inorganic Phosphorus concentration from our method(2.20 mmol/L); Right:
the results from Molybdenum blue assay for phosphate respectively(2.22 mmol/L; (b) Left: Uv-Vis spectra of serum sample Inor-
ganic Phosphorus concentration from our method (0.95 mmol/L); Right: the results from Molybdenum blue assay for phosphate(0.93
mmol/L).
compiled in Table 2. The results indicated the accuracy
of the method, as expressed by the calculated recovery
values, was satisfactory.
3.5. Analysis of Results
From our data, we can see inorganic phosphorus content
of milk is higher than foremilk about five times. This
indicates the excessive inorganic phosphorus is disad-
vantageous to young child’s growth. And with the people
level of living enhancement, the commercial milk be-
comes the people basic nutriment. But in the processing
commercial milk many important ingredients content are
insufficient, for instance, the calcium, phosphorus ratio
of is 2: 1 in milk containing the few calcium, many
phosphorus, is easy to form the insoluble calcium phos-
phate, affects the intestinaltract absorbing calcium and
phosphorus. If provide turnips containing many calcium,
few phosphorus for the child who eats the milk, can cor-
rect calcium and phosphorus proportion, namely can
enhance the calcium absorbing capacity. Therefore, the
reasonable increase and the adjustment can only prevent
to be out of nutrition balance for one people drink milk.
3.6. Assay Advantage
Ion-based chromogenic method has proved to be a useful
tool for clinical analysis because of its simplicity, re-
peatability, low reagent consumption and so on. We
know that ion chromatography, the use of deproteinizing
agents presents several disadvantages: perchloric acid
and trichloroacetic acid need to be removed from the
sample by time-consuming procedures otherwise they
SciRes Copyright © 2009
C. X. Yin et al. / HEALTH 1 (2009) 76-82
SciRes Copyright © 2009 http://www.scirp.org/journal/HEALTH/
81
Openly accessible at
Table 1. Results of our method against the method (molybde-
num blue assay for phosphate).
Numbers of
serum sample
Phosphate
(mmolL-1) from
Molybdenum blue
assay
Phosphate
(mmolL-1) from
our method
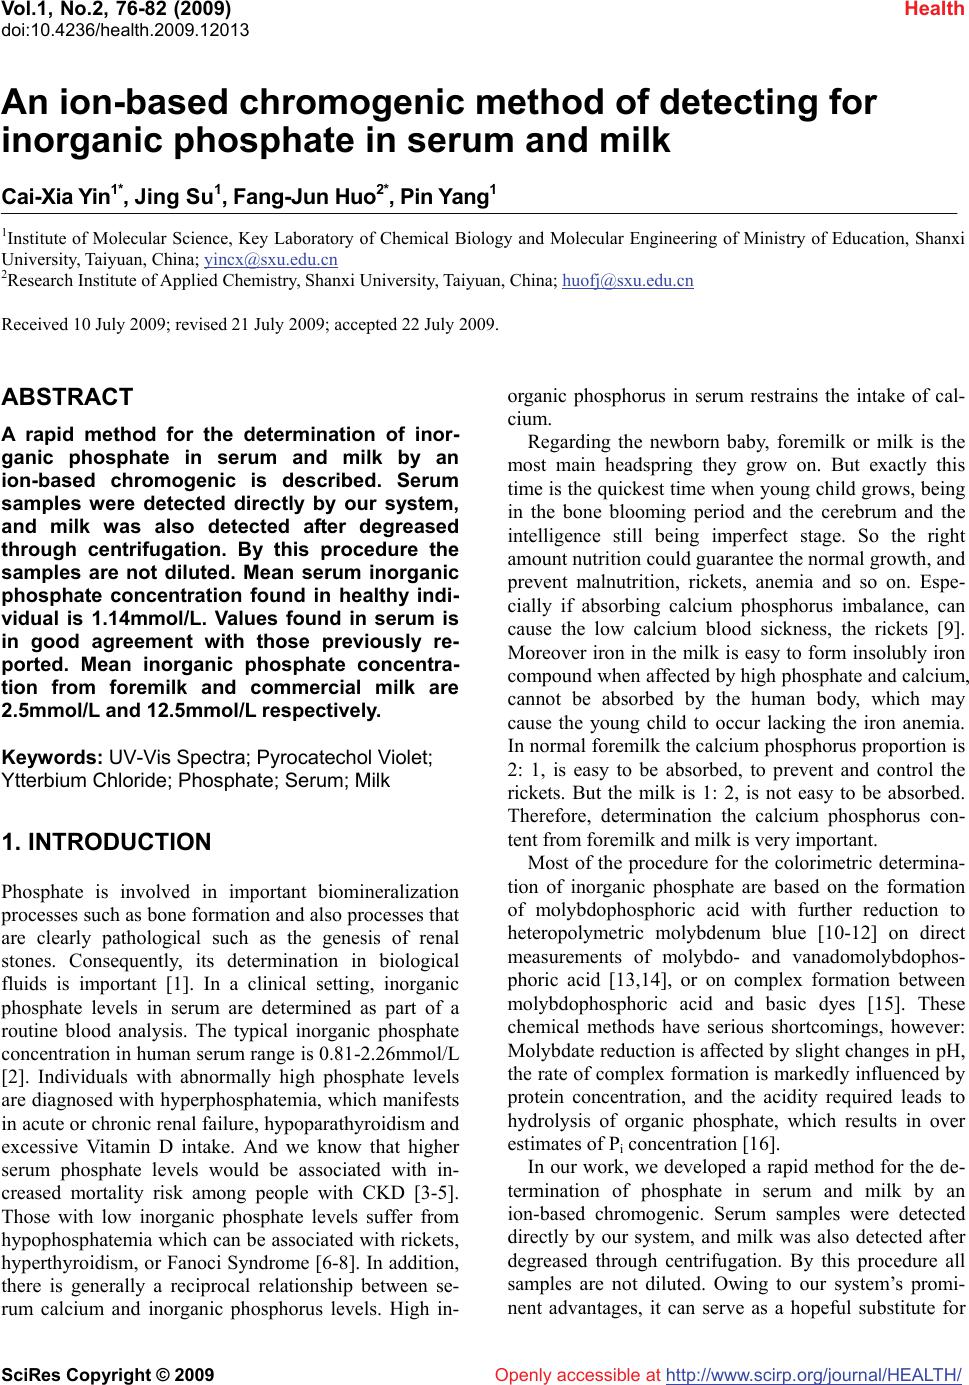
1(Serumhuman) 0.96 0.97
2(Serumhuman) 0.93 0.95
2(Serumcow) 2.20 2.22
Table 2. Recovery of phosphate in serum and milk.
interfere with the elution profile; organic solvents such
as acetonitrile lead to damage to the column and sul-
phosalicylic acid is often contaminated with sulphate,
lead to sample dilution. And our method decreases the
cost of analyses with respect to batch methods involving
enzymes in solution. All these advantages make the
method reported here be a valid alternative for the de-
termination of phosphate in serum.
4. CONCLUSIONS
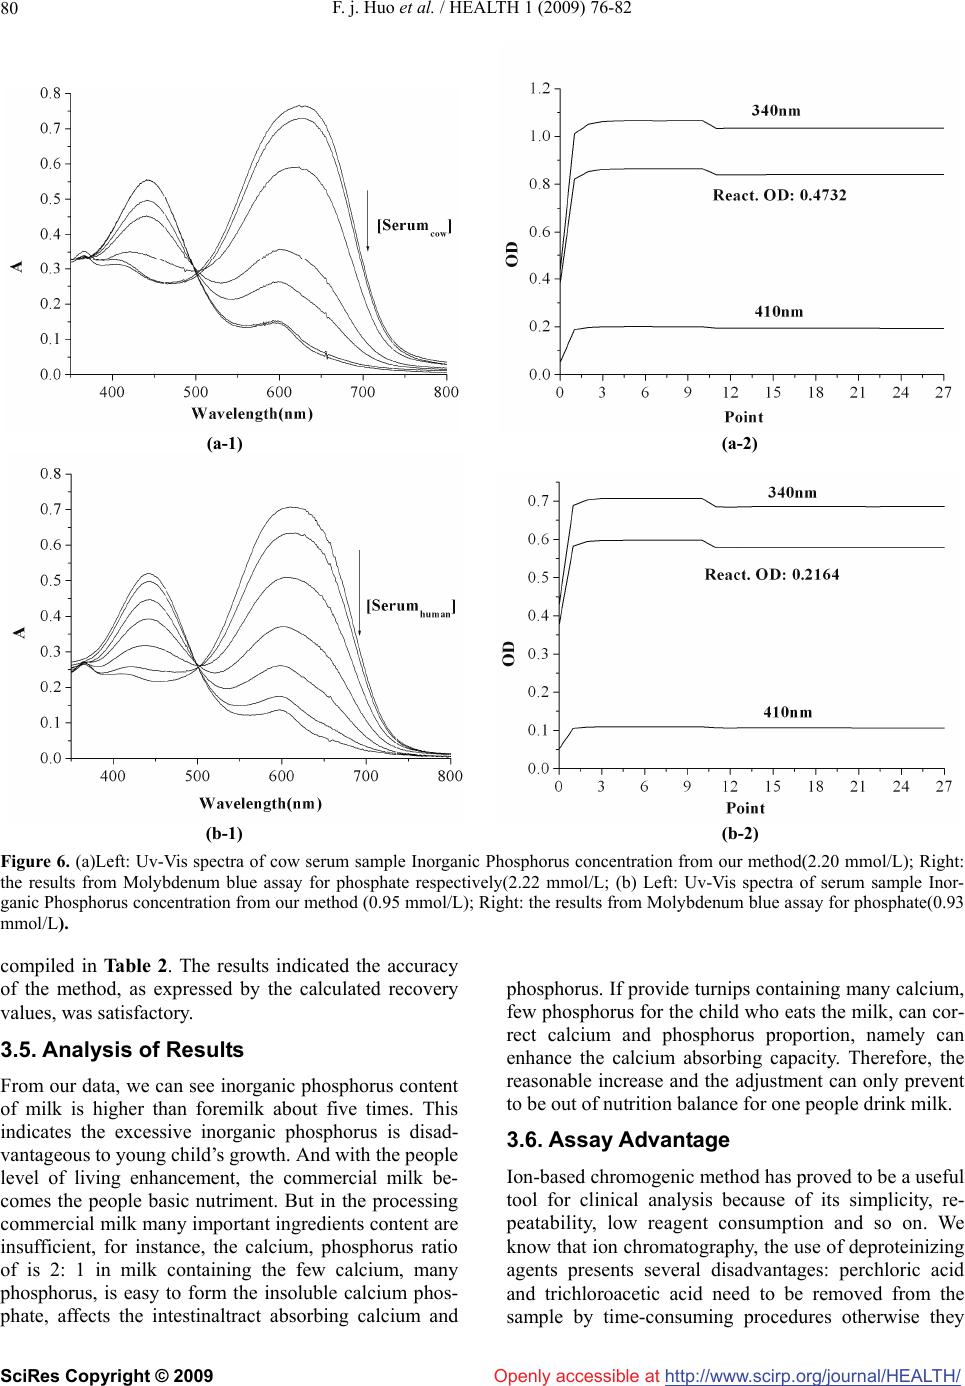
To sum up, we developed a sensitive, rapid and direct
method for detecting serum and milk phosphate spec-
trophotometrically. Our method is suitable for perform-
ing direct determinations of phosphate in serum without
any pretreatment and any interference. Now more and
more people are suffering from lithiasis as a result of
better living standards. Timely inspection of serum
phosphate is one of the clinical means of diagnosis.
Since long-time, people only pay attention to the inor-
ganic phosphorus determination in the urine and the
blood serum, to determine the inorganic phosphorus in
the foremilk mother’s milk and milk method very little
was mentioned. In this paper, we use our invention sys-
tem to quantificationally determine inorganic phospho-
rus concentration from milk degreased through centrifu-
gation, the results are accurate, suit to clinical and the
commerce use.
5. ACKNOWLEDGEMENTS
We acknowledge to the financial support of this work by the
National Natural Science Foundation of China (No. 20801032),
Shanxi Provincial Natural Science Foundation (No.
2009021006-2) and the Shanxi Province Foundation for Re-
turness (2008).
REFERENCES
[1] Grases, F. and March, J. G. (1990) Determination of
phosphate based on inhibition of crystalline growth of
calcite. Analytica Chimica Acta., 229, 249-254.
[2] Ender, D. B. and Rude, R. K., (1999) Mineral and bone
metabolism, In Tietz Textbook of Clinical Chemistry (C.
A. Burtis, E. R. Ashwood, Eds.), W. B. Saunders, com-
pany: P. A. Philadelphia, 1406-1408,1439-1440.
[3] Kestenbaum, B., Sampson, J. N., Rudser, K. D., et al.
(2005) Characterization of phosphate transport in rat
vascular smooth muscle cells. J Am Soc Nephrol., 16,
520-528.
[4] Levi, M. and Knochel, J. P. (1990) The management of
disorders of phosphate metabolism. In Therapy of Renal
Diseases and Related Disorders (S. G. Massry, W. N.
Suki,), Boston, Martinus Nijhoff.
[5] Levi, M., Cronin, R. E., and Knochel, J. P. (1992) Disor-
ders of phosphate and magnesium metabolism. In Disor-
ders of Bone and Mineral Metabolism (F. L. Coe, M. J
Favus,), New York: Raven Press.
[6] Biochrom Ltd Certificate No: 890333 Determination of
phosphate in clinical samples.
[7] Popovtzer, M., Knochel, J. P., and Kumar, R. (1997)
Disorders of calcium, phosphorus,vitamin D, and para-
thyroid hormone activity. In Renal Electrolyte Disorders,
edn 5 (R. W. Schrier,) Philadelphia: Lippincott-Raven.
[8] Hruska, K. and Gupta, A. (1998) Disorders of phosphate
homeostasis. In Metabolic Bone Disease, edn 3 (L. V.
Avioli, S. M. Krane,) New York: Academic Press.
[9] Greer, F. R., Steichen, J. J., and Tsang, R. C., (1982)
Calcium and. phosphate supplements in breast milk- re-
lated. Rickets. Am J Dis Child., 136, 581-583.
[10] Fiske, C. H. and Subbarow, Y. J. (1925) The colorimetric
determination of phosphorus. Biol. Chem., 66, 375-400.
[11] Lowry, O. H. and Lopez, J. A. (1946) The determination
of inorganic phosphate in the presence of labile phos-
phate ester. J. Biol. Chem., 182, 421.
[12] Bartles, P. C. and Roijers, A. F. M. (1975) A kinetic study
on the influence ofparameters in the determination of in-
organic phosphate by the molybdenum blue reaction.
Clin. Chim. Acta., 61, 153-4.
[13] Daly, J. A. and Ertingshausen, G. (1972) Direct method
for determining inorganic phosphorus in serum. with the
Centrifichem. Clin. Chem., 18, 263-265.
[14] Urban, A. E. (1972) Simplified. serum phosphorus.
analyses. by continuous-flow. ultraviolet. Spectropho-
tometry. J. Clin. Chem., 18, 601-4.
[15] Fogg, A. G., Soleymanloo, S., and Burns, D. T. (1977)
The spectrophotometric determination of inorganic
phosphate in biological system with crystal violet. Anal.
Chim. Acta., 88, 197-200.
Sample
Added
(phosphate)
mmolL-1
Found
(phosphate)
mmolL-1
Recovery
(%)
1(Serum) — 1.48
0.6 2.02 95.9
2(Serum) — 1.11
0.6 1.73 102
3(Serum) — 0.95
0.6 1.53 97.3
4(Milkhuman) — 2.34
1.0 3.42 104
5(Milkcow) — 12.5
5 17.3 98.4
C. X. Yin et al. / HEALTH 1 (2009) 76-82
SciRes Copyright © 2009 http://www.scirp.org/journal/HEALTH/Openly accessible at
82
[16] Endres, B. D. and Rude, R. K. (1994) Mineral and bone
metabolism. Tietz textbook of clinical chemistry (C. A.
Burtis, E. R. Ashwood, eds.), Philadelphia: W. B. Saun-
ders, Co., 1887-973.
[17] Yin, C. X., Huo F. J., and Yang, P. (2005) An ion-based
chromogenic detecting method for phosphate-containing
derivatives in physiological condition. Sensors and Ac-
tuators B Chemical., 109, 291–299.
[18] Yin, C. X., Huo, F. J., Yang, P. (2006) UV-Vis spectro-
scopic study directly detecting inorganic phosphorus in
urine and our reagent kit. Anal Bioanal Chem., 384,
774-779.