Paper Menu >>
Journal Menu >>
 Journal of Behavioral and Brain Science, 2011, 1, 102-110 doi:10.4236/jbbs.2011.13014 Published Online August 2011 (http://www.SciRP.org/journal/jbbs) Copyright © 2011 SciRes. JBBS Gender Differences in Frontal Activation while Perceiving Pathologically Thin Female Body Forms Toru Uehara1, Yoko Ishige2, Masashi Suda2, Perminder Sachdev3,4 1General Health Su p port Center, Gunma University, Maebashi, Japan 2Department of Neur opsychiatry, Gunma University Graduate School of Medicine, Maebashi, Japan 3School of Psychiatry, University of New South Wales, Sydney, Australia 4Neuropsychiatric Institu te , Prince of Wales Hospital, Sydney, Australia E-mail: toruaki@gunma-u.ac.jp Received March 23, 201 1; revised May 13, 2011; accepted June 18, 2011 Abstract Brain mechanisms underlying body image disturbances are a focus of research in the realm of eating disor- ders, and functional imaging studies have revealed gender differences in the processing of body shape. In this study, using 16-channel near infrared spectroscopy, we investigated frontal lobe activation in 46 healthy university students during viewing of photographs of pathologically thin female forms, and compared gender differences in activation, and examined the correlations between the relative changes in cerebral blood vol- ume, eating attitudes, and perceived feelings. Participants completed the Eating Attitudes Test (EAT26) and rated a visual analogue scale for anxiety/disgust. Significant gender differences in the pattern of activation were noted in the prefrontal region (predominantly right side, dorsolateral to ventral), with male participants showing greater and more widespread frontal activation. The total and subscale scores on EAT26 were sig- nificantly correlated with the frontal activation, and perceived feelings were significantly associated with increased prefrontal activation on the left side. Gender differences in frontal activation suggest differential expectations between men and women of pathologically thin female body forms. The study results suggest that anorexic psychopathology may be associated with abnormal right frontal activation while viewing thin bodies of others. Keywords: Body Image, Anorexia Nervosa, Prefrontal Cortex, Eating Attitudes, Near Infrared Spectroscopy 1. Introduction The brain mechanisms underlying body image process- ing have been explored in previous studies, using a vari- ety of methodologies. An investigation of the neural processing of body shape revealed activation in a distrib- uted network, including the lateral fusiform gyrus, lateral prefrontal cortex (PFC), and right parietal cortex [1]. The dorsolateral PFC and the insular, inferior parietal, fusi- form, and anterior cingulate (AC) cortical areas have been demonstrated to respond to images of one’s own distorted body [2]. Other studies have shown that lesions in the dorsolateral PFC and/or parietal cortex were associated with impaired performances on tasks requiring on-line coding of the body posture [3]. Derogatory words con- cerning one’s own body image have been reported to provoke activation s in the temporomesial area, including the amygdala, in young women [4]. In terms of clinical correlations, a recent fMRI study [5] reported that anorexia nervosa (AN) patients demon- strated stronger activation of the insula and lateral PFC cortex during the satisfaction rating of thin self-images, and the study indicated a stronger emotional involvement while the subjects were presented with distorted images close to their own ideal body size. Friederich et al. [6] summarized that a neural network could be involved in the general processing of body images (the lateral fusi- form, parietal and dorsolateral PFC) and a related ‘emo- tional’ network (AC, insula, amygdala) may be activ ated when body-shape-related stimuli induce self-related or emotional reactions. Consequently, these neural connec- tions might play a significant role in the pathophysiology of eating disorders, and possibly in the gender-related difference in the prevalence of eating di sorders. However, several complex processes could be involved in the brain response, as seen in the detected activations,  T. UEHARA ET AL. Copyright © 2011 SciRes. JBBS 103 according to the content or focus of the stimuli. For ex- ample, activation of the left ventrolateral and apical PFC was found in a previous fMRI study in which line draw- ings of underweight body shapes were used [1]; on the other hand, exposure to distorted images of one’s own body showed activations of the left [7] or bilateral [2] ventrolateral PFC. On the other hand, the dorsal division of the right AC (BA 32) has been suggested to be impor- tant for self-referential processing of emotions [8,9]. In anxiety responses to pictures of slim body shapes, Fried- erich et al. [6] commented that differential activation of the fear network, including the amygdala and the AC, was associated with substantial body dissatisfaction. Based on these studies, it seems reasonable to divide task profiles into individual factors, including pure self-ref- erence and objective thin stimulation. In response to the respective paradigms, one could evaluate subjective and objective feelings or reactions while presenting visual stimuli. We assume that body image processing can be divided into several components according to the cognitive proc- esses involved; first, simple self-monitoring while com- paring with others; second objective stimulation by body forms (e.g., emaciation or obesity); and last, disturbance of body image perception, such as drawings of body shapes or distorted graphics. Therefore, we conducted the present study with the objective of selecting one compo- nent of these processes, i.e. “how do young adults feel about or process others’ pathological emaciation?” We used stimuli that have been previously used successfully (body forms of female patients with AN) [10]. This aforementioned study indicated that processing of non self-images by control subjects activated the inferior and middle frontal gyri, and the superior and inferior parietal lobules. AN patients had a similar pattern of activation with greater activation of the medial frontal gyrus. Inter- estingly, when the differential activation in the 2 groups was investigated with self vs. non-self-images, control subjects showed greater activation in the middle frontal gyri and insula than the patients, while the patients did not show greater activation in any region. Sachdev et al. [10] concluded that discrepant emotional and perceptual processing may underlie the distortion of self-images by AN patients. It is very important to determine whether Sachdev et al.’s study findings apply equally to men and women from a different cultural background. We used near infrared spectroscopy (NIRS) for this study because of its noninvasiveness and ease of per- formance. NIRS employs near-infrared light emitted and detected on the skull skin [11]. It allows the monitoring of hemodynamic changes, including both cerebral blood volume changes and the oxygenation state, using a small apparatus with a high time resolution of about 0.1 sec- onds. It also allows the monitoring of changes in the oxygenated hemoglobin concentration (o-Hb) and de- oxygenated hemoglobin concentration (d-Hb). NIRS is considered to be suitable for studies of higher brain func- tions because it enables measurements in the natural set- ting as compared with other brain imaging techniques: for example, subjects can undergo NIRS examination in the sitting position, with th eir eyes open, or while speak- ing and sitting on a bed [12]. Taking advantage of these characteristics, several NIRS studies have been con- ducted in patients with psychiatric disorders, such as schizophrenia [13,14], depression [15], and attention- deficit/hyperactivity disorder [16]. These characteristics have also enabled the investigation of subjective, delicate experiences in healthy subjects, such as subjective sleepiness and conversations [17,18]. 2. Methods 2.1. Participants The study participants were 46 healthy university stu- dents (32 females), with a mean age of 20.5 years (S.D. 2.2). Two were left-handed, and 3 were visiting students from China, the others being Japanese. Their average body weight and height were 55 (± 7.0) kg and 162 (± 8.9) cm, respectively, and the body mass index (BMI) ranged from 18 to 24 (mean 21.3 for all; 22.5 for male and 20.8 for female). None of the participants had any significant medical/psychiatric history. They were vol- untarily recruited as subjects of this scientific study, and were paid 1600 yen, according the official provision, for their co-operation in the exam. All subjects gave written informed consent prior to their participation in the study, in conformity with the provisions of the Declaration of Helsinki, revised in Edinburgh in 2000. We strictly pro- tected the privacy of the subjects, carefully preserving their anonymity. The data collection was conducted from August to December in 2009 and from August to De- cember in 2010. 2.2. NIRS Machine NIRS allows calculation of the changes in the hemoglo- bin parameters, including oxygenated hemoglobin [o-Hb] and deoxygenated hemoglobin [d-Hb], by measuring attenuation of the near-infrared light around the wave- length of 800 nm. The neural activation induces regional cerebral blood dynamics. It induces hemodynamic changes in the brain tissue, almost identical in pattern to spontaneous cerebral neural activity. Cortical activation is typically detected as an [o-Hb] increase and [d-Hb] decrease; however, the direction of changes of [d-Hb]  T. UEHARA ET AL. Copyright © 2011 SciRes. JBBS 104 can be ambiguous in the frontal lobe [19]. Mainly, changes of [o-Hb] at a depth of 2 - 3 cm from the scalp, that is, the surface of the cerebral cortex, are considered to be correlated with the hemodynamic changes in PET [20] and blood oxygenation level-dependent (BOLD) signal changes in fMRI [21,22]. NIRS does not measure cerebral luminescence, but measures attenuation of the irradiated light intensity. Therefore, the combination of optical irradiation and photon detection determines the resolution. NIRS characteristically measures not the 1:1 combination of irradiation and detection, but the light from one light source with 2 or more detectors arranged geometrically in the NIRS measurement system. Thus, information on which detector measures the signal of which portion becomes important. There are a number of methods for judging this channel separation. The first method, Time Division Multiple Access (TDMA), makes a light source turn on in turns and separates a signal on a time-axis. The second method, Frequency Division Mul- tiple Access (FDMA), is for modulating and irradiating 2 or more light sources with different frequencies and se- parating a signal based on the frequency information after detection. The third method is Code Division Mul- tiple Access (CDMA) which uses spectrum diffusion attenuation and is applied GPS or mobile phone tech- nology. The NIRS machine we used, OEG-16 (Spec- tratech, Inc, Japan), employs CDMA methodology and is, therefore, very convenient and portable. It can provide NIRS data under natural conditions non-invasively, and artifacts induced by hair can be avoided because of the adjustments which allow reading only of the front of the head. The OEG-16 measures 16 channels on the frontal lobe (according to Broadman’s map, it provides data approximately on sections 10, 11, 12, 44, 45, and 46). Its time resolution is 0.5 seconds and space resolution is 2 cm. The headset was placed according to the 10/20 sys- tem, by which a central hole was coordinated with Fz. From channels 1 to 8, the measurement points were placed from the right to the central pole. From channels 9 to 16, the measurement points were placed from the ven- tral/rostral to the left lateral (to refer the video content). It provides relative changes of hemoglobin concentration and values are obtained in arbitrary units (concentration × path length). 2.3. Task A visual paradigm was used in which 3-dimensional (front, side, and back) photos of 2 pathologically thin women (BMI are ranged from 15-16), used in a previous fMRI study, were presented [10]. The women were dressed in standardized clothing (white cropped singlet with the abdomen showing, black bike pants and no jew- ellery), so as to reveal the body contour. The faces of all the images were digitally masked t o avoi d dist racti on from the body form. The body images were placed against a uniform grey background of medium-intensity. Digital images were prepared using Photoshop®. To maintain the subjects’ attention during the viewing, the subjects were instructed to express how he/she thinks or feels about comparing the images with him/herself. The dif- ferent body forms were shown in 3 different profiles for an equal duration, i.e., front, back, and side, switched every 5 seconds. The baseline image was a uniformly grey screen of medium intensity which was identical to the background of the body imag es (pre-task 5 sec, inter- task 5 sec, and post-task 5 sec). 2.4. Perceived Feeling and EAT Perceived feeling about thinner images was rated on a scale of 0 - 10, according to the participants’ overall im- pression. The anxiety (how have you felt anxiety?) and disgust (how have you felt disgust?) levels were scaled on a visual analogue scale soon after viewing pictures subjectively. Eating attitudes were assessed in all of the subjects using the Japanese version of the Eating Attitude Test (EAT-26) [23,24] at the time of the examination. EAT-26 is a 26-item self-rated questionnaire for evaluating eating problems. The results are presented as the total score (range, 0-78), as well as the scores on the 3 subscales, namely, diet (range, 0 - 39), bulimia and food preoccupa- tion (range, 0 - 18), and oral control (range, 0 - 21), which respectively reflect avoidance of fattening foods and preoccupation with being thinner, thoughts about food as well as items indicating bulimia, and self-co ntrol in relation to eating and perceived pressure from others to gain weight. 2.5. Data Analysis The continuous waveforms of [Hb] changes in all of the 16 channels were acquired from each of the subjects during the paradigm. The individually averaged [Hb] waveforms were obtained as the average sum of 2 trials: the baseline realignment for 5 sec before and after the task periods, and a task segment averaging 2 sets of 15- sec image viewing periods. Thereafter, the grand average values of the baseline and task segments in each channel were calculated for all of the participants’ data. W e used only [o-Hb] values as cerebral blood volume changes were based on a previous report [25,26]. Topography (video content) was presented according to the time course on the frontal portion. For this grand averaged data, channels which carried significant activations were ana- 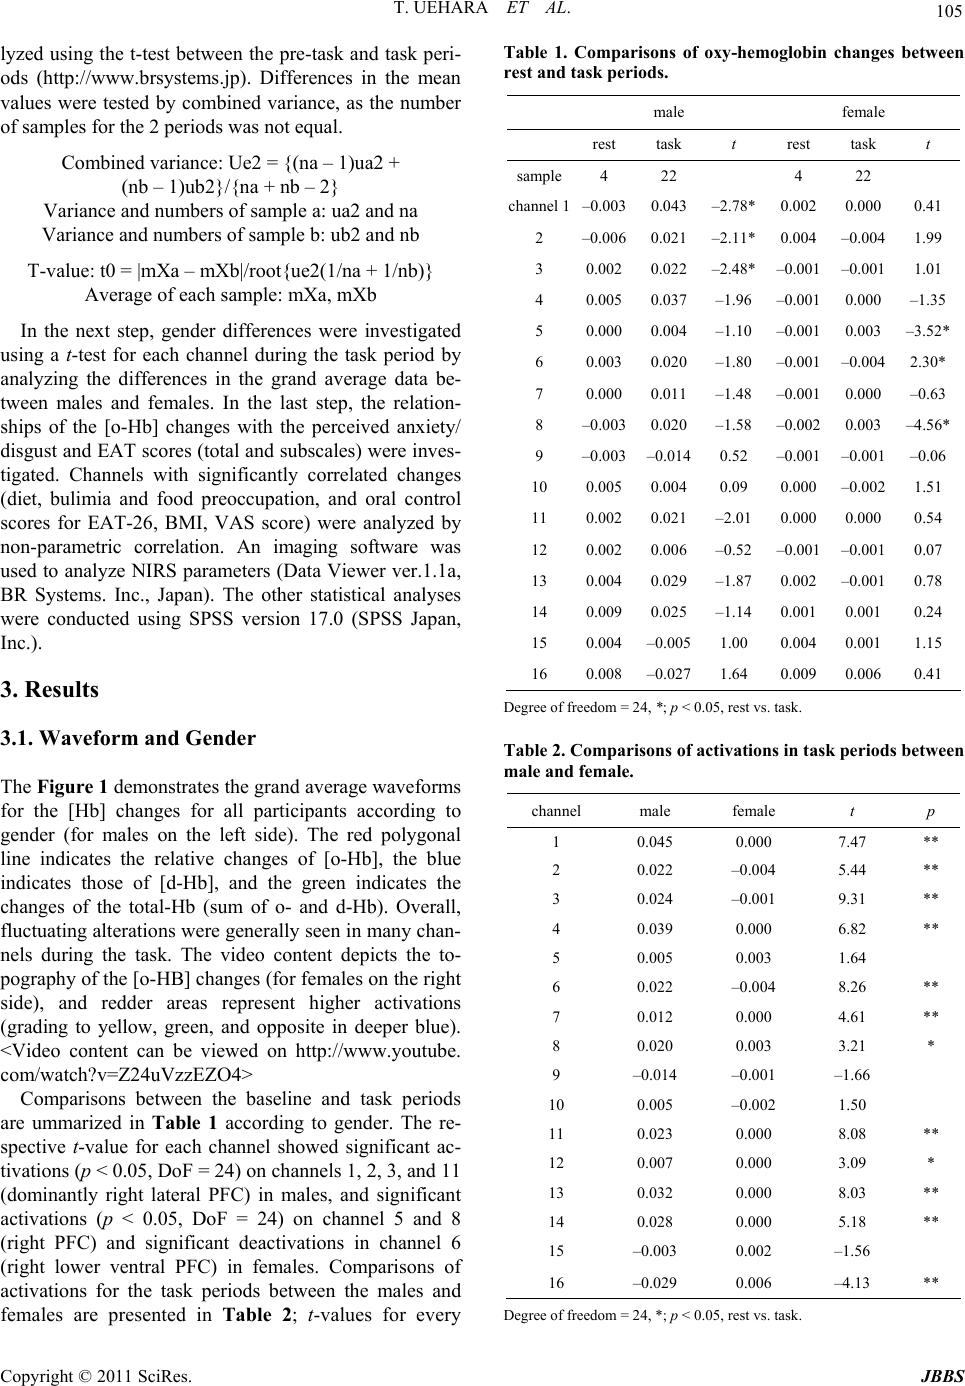 T. UEHARA ET AL. Copyright © 2011 SciRes. JBBS 105 lyzed using the t-test between the pre-task and task peri- ods (http://www.brsystems.jp). Differences in the mean values were tested by combined variance, as the number of samples for the 2 periods was not equal. Combined variance: Ue2 = {(na – 1)ua2 + (nb – 1)u b2} / {na + nb – 2} Variance and numbers of sample a: ua2 and na Variance and numbers of sample b: ub2 and nb T-value: t0 = |mXa – mXb|/root{ue2(1/na + 1/nb)} Average of each sample: mXa, mXb In the next step, gender differences were investigated using a t-test for each channel during the task period by analyzing the differences in the grand average data be- tween males and females. In the last step, the relation- ships of the [o-Hb] changes with the perceived anxiety/ disgust and EAT scores (total and subscales) were inves- tigated. Channels with significantly correlated changes (diet, bulimia and food preoccupation, and oral control scores for EAT-26, BMI, VAS score) were analyzed by non-parametric correlation. An imaging software was used to analyze NIRS parameters (Data Viewer ver.1.1a, BR Systems. Inc., Japan). The other statistical analyses were conducted using SPSS version 17.0 (SPSS Japan, Inc.). 3. Results 3.1. Waveform and Gender The Figure 1 demonstrates the grand average waveforms for the [Hb] changes for all participants according to gender (for males on the left side). The red polygonal line indicates the relative changes of [o-Hb], the blue indicates those of [d-Hb], and the green indicates the changes of the total-Hb (sum of o- and d-Hb). Overall, fluctuating alterations were generally seen in many chan- nels during the task. The video content depicts the to- pography of the [o-HB] changes (for females on the right side), and redder areas represent higher activations (grading to yellow, green, and opposite in deeper blue). <Video content can be viewed on http://www.youtube. com/watch?v=Z24uVzzEZO4> Comparisons between the baseline and task periods are ummarized in Table 1 according to gender. The re- spective t-value for each channel showed significant ac- tivations (p < 0.05, DoF = 24) on chann els 1, 2 , 3, and 11 (dominantly right lateral PFC) in males, and significant activations (p < 0.05, DoF = 24) on channel 5 and 8 (right PFC) and significant deactivations in channel 6 (right lower ventral PFC) in females. Comparisons of activations for the task periods between the males and females are presented in Table 2; t-values for every Table 1. Comparisons of oxy-hemoglobin changes between rest and task periods. male female rest task t rest task t sample4 22 4 22 channel 1–0.0030.043–2.78* 0.002 0.0000.41 2 –0.006 0.021 –2.11* 0.004 –0.0041.99 3 0.0020.022–2.48* –0.001 –0.0011.01 4 0.0050.037–1.96 –0.001 0.000–1.35 5 0.0000.004–1.10 –0.001 0.003–3.52* 6 0.0030.020–1.80 –0.001 –0.004 2.30* 7 0.0000.011–1.48 –0.001 0.000–0.63 8 –0.003 0.020–1.58 –0.002 0.003–4.56* 9 –0.003 –0.0140.52 –0.001 –0.001 –0.06 10 0.0050.0040.09 0.000 –0.0021.51 11 0.0020.021–2.01 0.000 0.0000.54 12 0.0020.006–0.52 –0.001 –0.0010.07 13 0.0040.029–1.87 0.002 –0.0010.78 14 0.0090.025–1.14 0.001 0.0010.24 15 0.004–0.005 1.00 0.004 0.0011.15 16 0.008–0.027 1.64 0.009 0.0060.41 Degree of freedom = 24, *; p < 0. 0 5 , rest vs. task. Table 2. Comparisons of activations in task periods between male and female. channel male female t p 1 0.045 0.000 7.47 ** 2 0.022 –0.004 5.44 ** 3 0.024 –0.001 9.31 ** 4 0.039 0.000 6.82 ** 5 0.005 0.003 1.64 6 0.022 –0.004 8.26 ** 7 0.012 0.000 4.61 ** 8 0.020 0.003 3.21 * 9 –0.014 –0.001 –1.66 10 0.005 –0.002 1.50 11 0.023 0.000 8.08 ** 12 0.007 0.000 3.09 * 13 0.032 0.000 8.03 ** 14 0.028 0.000 5.18 ** 15 –0.003 0.002 –1.56 16 –0.029 0.006 –4.13 ** Degree of freedom = 24, *; p < 0.05, rest vs. t ask. 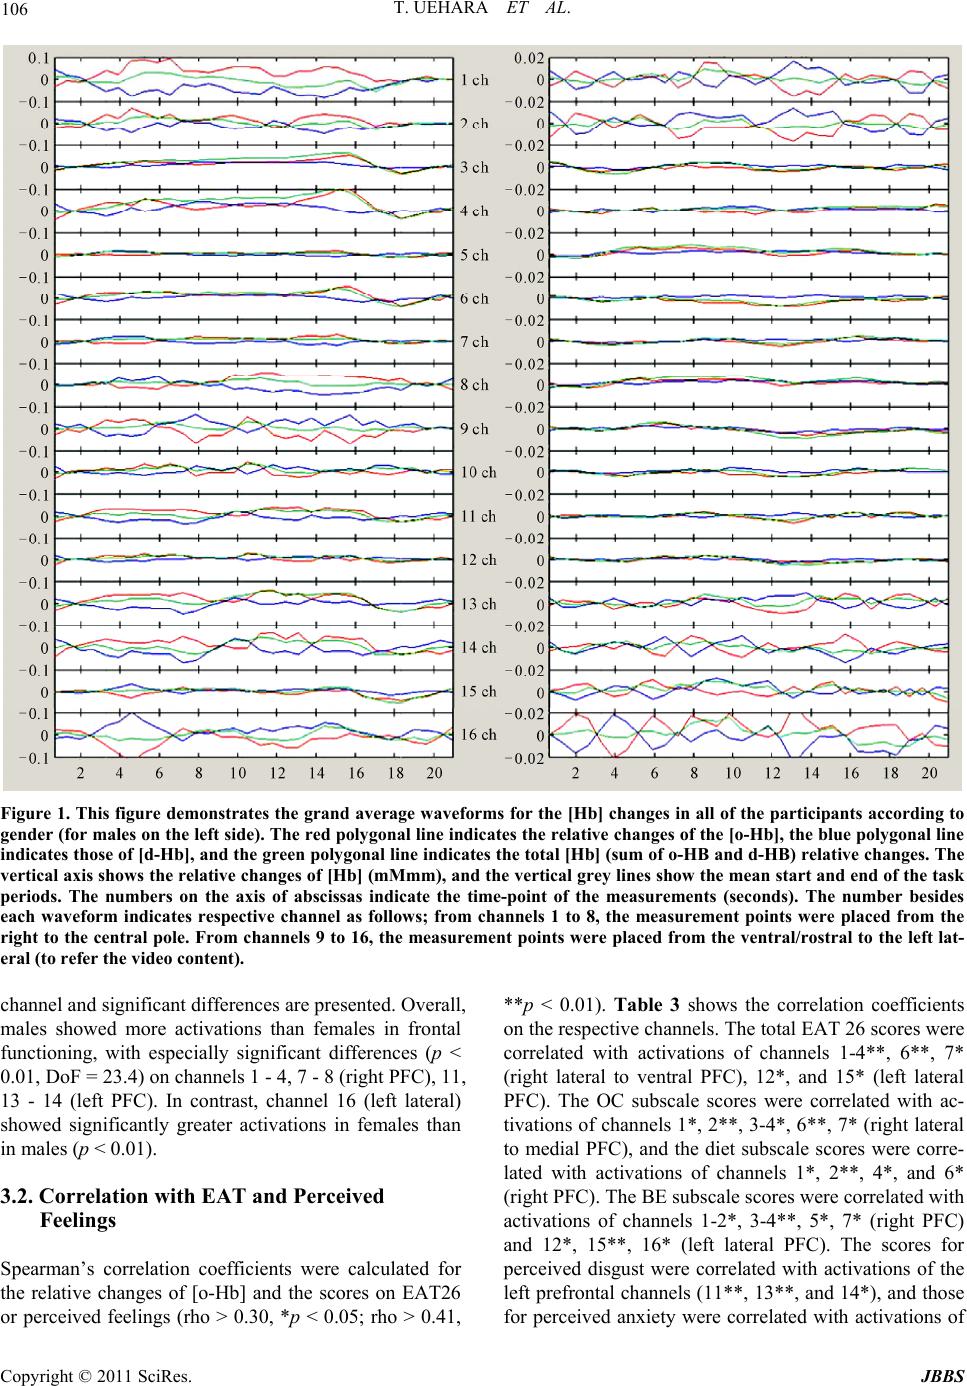 T. UEHARA ET AL. Copyright © 2011 SciRes. JBBS 106 Figure 1. This figure demonstrates the grand average waveforms for the [Hb] changes in all of the participants according to gender (for males on the left side). The red polygonal line indicates the relative changes of the [o-Hb], the blue polygonal line indicates those of [d-Hb], and the green polygonal line indicates the total [Hb] (sum of o-HB and d-HB) relative changes. The vertical axis shows the relative changes of [Hb] (mMmm), and the vertical grey lines show the mean start and end of the task periods. The numbers on the axis of abscissas indicate the time-point of the measurements (seconds). The number besides each waveform indicates respective channel as follows; from channels 1 to 8, the measurement points were placed from the right to the central pole. Fr om channels 9 to 16, the measurement points were placed from the ventral/rostral to the left lat- eral (to refer the video content). channel and significant differences are presented. Overall, males showed more activations than females in frontal functioning, with especially significant differences (p < 0.01, DoF = 23.4) on channels 1 - 4, 7 - 8 (right PFC), 11, 13 - 14 (left PFC). In contrast, channel 16 (left lateral) showed significantly greater activations in females than in males (p < 0.01). 3.2. Correlation with EAT and Perceived Feelings Spearman’s correlation coefficients were calculated for the relative changes of [o-Hb] and the scores on EAT26 or perceived feelings (rho > 0.30, *p < 0.05; rho > 0.41, **p < 0.01). Table 3 shows the correlation coefficients on the respective channels. The total EAT 26 scores were correlated with activations of channels 1-4**, 6**, 7* (right lateral to ventral PFC), 12*, and 15* (left lateral PFC). The OC subscale scores were correlated with ac- tivations of chann els 1*, 2**, 3-4*, 6**, 7* (righ t lateral to medial PFC), and the diet subscale scores were corre- lated with activations of channels 1*, 2**, 4*, and 6* (right PFC). The BE subscale scores were correlated with activations of channels 1-2*, 3-4**, 5*, 7* (right PFC) and 12*, 15**, 16* (left lateral PFC). The scores for perceived disgust were correlated with activations of the left prefrontal channels (11**, 13**, and 14*), and those for perceived anxiety were correlated with activations of 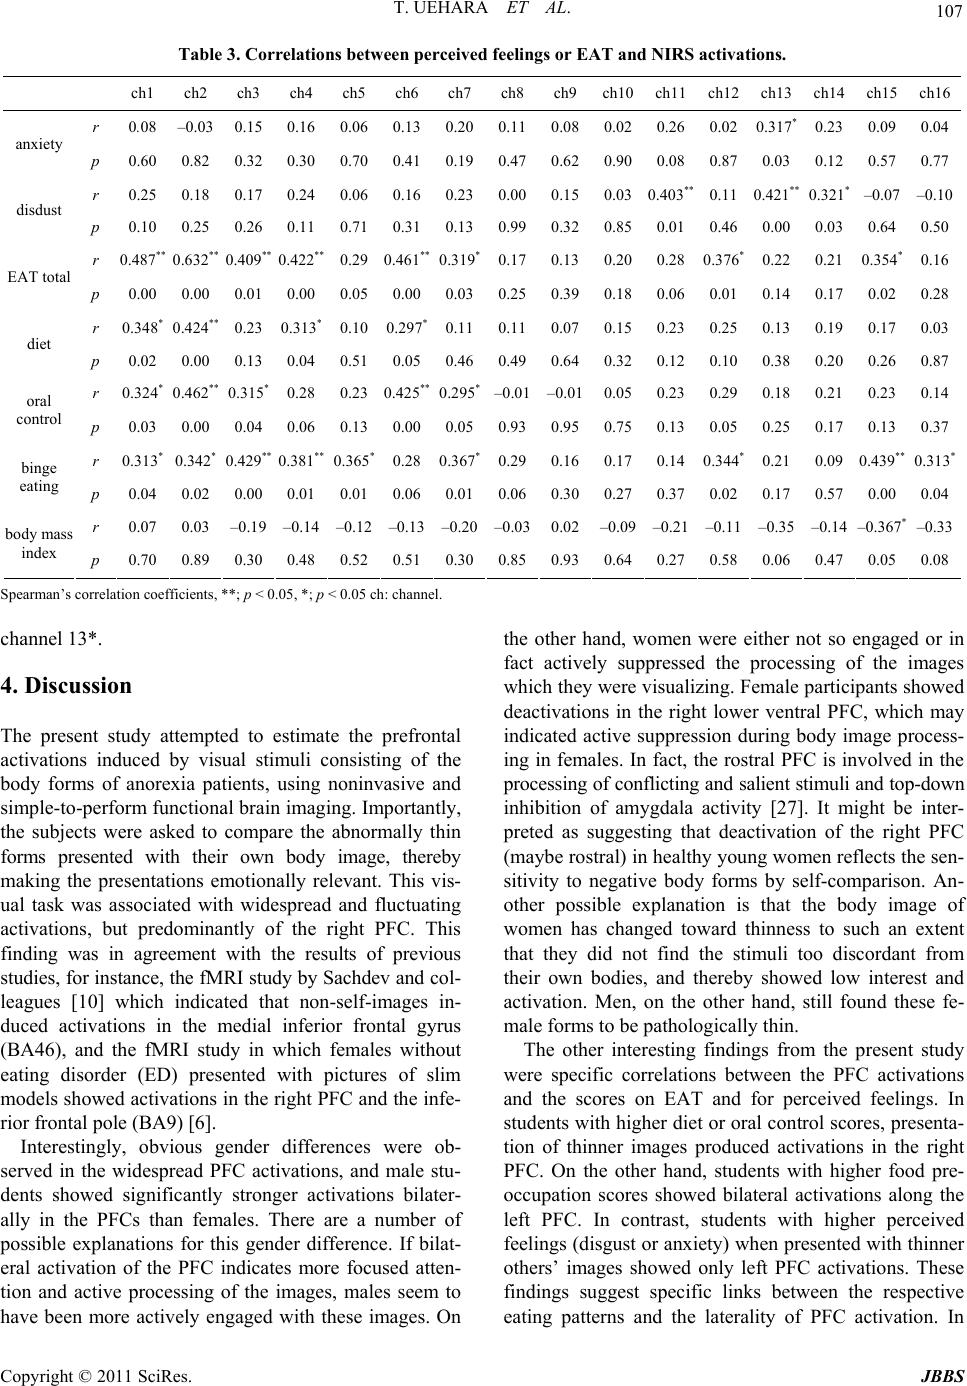 T. UEHARA ET AL. Copyright © 2011 SciRes. JBBS 107 Table 3. Correlations between perceived feelings or EAT and NIRS activations. ch1 ch2 ch3 ch4 ch5 ch6ch7ch8ch9ch10ch11ch12 ch13 ch14 ch15ch16 r 0.08 –0.03 0.15 0.16 0.06 0.130.200.110.080.020.260.02 0.317* 0.23 0.090.04 anxiety p 0.60 0.82 0.32 0.30 0.70 0.410.190.470.620.900.080.87 0.03 0.12 0.570.77 r 0.25 0.18 0.17 0.24 0.06 0.160.230.000.150.030.403** 0.11 0.421** 0.321* –0.07 –0.10 disdust p 0.10 0.25 0.26 0.11 0.71 0.310.130.990.320.850.010.46 0.00 0.03 0.640.50 r 0.487** 0.632** 0.409** 0.422** 0.29 0.461** 0.319*0.17 0.13 0.200.280.376* 0.22 0.21 0.354*0.16 EAT total p 0.00 0.00 0.01 0.00 0.05 0.000.030.250.390.180.060.01 0.14 0.17 0.020.28 r 0.348* 0.424** 0.23 0.313* 0.10 0.297*0.110.110.070.150.230.25 0.13 0.19 0.170.03 diet p 0.02 0.00 0.13 0.04 0.51 0.050.460.490.640.320.120.10 0.38 0.20 0.260.87 r 0.324* 0.462** 0.315* 0.28 0.23 0.425** 0.295*–0.01–0.010.050.230.29 0.18 0.21 0.230.14 oral control p 0.03 0.00 0.04 0.06 0.13 0.000.050.930.950.750.130.05 0.25 0.17 0.130.37 r 0.313* 0.342* 0.429** 0.381** 0.365* 0.28 0.367*0.29 0.16 0.17 0.140.344* 0.21 0.09 0.439**0.313* binge eating p 0.04 0.02 0.00 0.01 0.01 0.060.010.060.300.270.370.02 0.17 0.57 0.000.04 r 0.07 0.03 –0.19 –0.14 –0.12 –0.13–0.20–0.030.02–0.09–0.21–0.11 –0.35 –0.14 –0.367*–0.33 b ody mass index p 0.70 0.89 0.30 0.48 0.52 0.510.300.850.930.640.270.58 0.06 0.47 0.050.08 Spearman’s correlation coefficients, **; p < 0.05, *; p < 0.05 ch: channel. channel 13*. 4. Discussion The present study attempted to estimate the prefrontal activations induced by visual stimuli consisting of the body forms of anorexia patients, using noninvasive and simple-to-perform functional brain imaging. Importantly, the subjects were asked to compare the abnormally thin forms presented with their own body image, thereby making the presentations emotionally relevant. This vis- ual task was associated with widespread and fluctuating activations, but predominantly of the right PFC. This finding was in agreement with the results of previous studies, for instance, the fMRI study by Sachdev and col- leagues [10] which indicated that non-self-images in- duced activations in the medial inferior frontal gyrus (BA46), and the fMRI study in which females without eating disorder (ED) presented with pictures of slim models showed activations in the right PFC and the infe- rior frontal pole (BA9) [6]. Interestingly, obvious gender differences were ob- served in the widespread PFC activations, and male stu- dents showed significantly stronger activations bilater- ally in the PFCs than females. There are a number of possible explanations for this gender difference. If bilat- eral activation of the PFC indicates more focused atten- tion and active processing of the images, males seem to have been more actively engaged with these images. On the other hand, women were either not so engaged or in fact actively suppressed the processing of the images which they were visualizin g. Female participan ts showed deactivations in the right lower ventral PFC, which may indicated active suppression during body image process- ing in females. In fact, the rostral PFC is involved in the processing of conflicting and salient stimuli and top-down inhibition of amygdala activity [27]. It might be inter- preted as suggesting that deactivation of the right PFC (maybe rostral) in healthy young women reflects the sen- sitivity to negative body forms by self-comparison. An- other possible explanation is that the body image of women has changed toward thinness to such an extent that they did not find the stimuli too discordant from their own bodies, and thereby showed low interest and activation. Men, on the other hand, still found these fe- male forms to be pathologically thin. The other interesting findings from the present study were specific correlations between the PFC activations and the scores on EAT and for perceived feelings. In students with higher diet or oral control scores, presenta- tion of thinner images produced activations in the right PFC. On the other hand, students with higher food pre- occupation scores showed bilateral activations along the left PFC. In contrast, students with higher perceived feelings (disgust or anxiety) when presented with thinn er others’ images showed only left PFC activations. These findings suggest specific links between the respective eating patterns and the laterality of PFC activation. In  T. UEHARA ET AL. Copyright © 2011 SciRes. JBBS 108 our related study on eating disorders [28], we found functional relationships between eating psychopathology and brain activations and concluded that the clinical symptoms of ED consisted of 2 components: dieting tendency, correlated with th e righ t fronto tempor al co rtex , and eating behavior problems (including binge eating) correlated with the left orbitofrontal cortex. Linkage of left PFC activation to fear of fatness or desire for thin- ness, and linkage of right PFC activation to bulimia might also be a continuum in healthy subjects. The exis- tence of relationships between body images, eating atti- tudes, emotion and PFC activations might be speculated to indicate specific ED-related neural mechanisms. In addition, Friederich et al. [6] commented that individual differences in anxiety ratings in response to presentation of body shape models were positively associated with activations of the fear network, including in the rostral PFC and the inferior lateral PFC. According to that au- thor, activation of the ventrolateral PFC (BA 47) is in- volved in anxiety processing [29] and anger [30]. An- other study suggests that ventrolateral PFC activation reflects the intensity dimension of emotional perception rather than the processing of discrete emotions [31]. The present study also found that females showed signifi- cantly higher activations only in the left lateral PFC (channel 16) as compared to males, and this may be re- lated to gender-specific emotional status and processing. Some limitations of this study should be noted. We used NIRS for studying brain activ ation, unlike previous studies that have mostly used BOLD fMRI. When ap- plying NIRS to the clinical setting, relative changes of cerebral hemoglobin data should be cautiously inter- preted as these are not absolute values. Also, anatomical identification of the measurement points is one of the major methodological challenges in multichannel NIRS; however, a virtual registration method has been devel- oped recently to improve placement and detection [32]. The spatial resolution in NIRS ranges from 2 to 3 cm; therefore, it is possible to discuss functional dynamism in the context of broader frontal connectivity. NIRS does offer high time resolution, which can contribute to clari- fication of the networking or circuit by allowing analyses of the time-course and pattern of activations. NIRS, as used in our study, is limited to the examination of the frontal lobes and we therefore cannot comment on other brain regions involved in these processes, which is an- other limitation of our work. The study of body image processing can benefit from many paradigms. Most pre- vious studies have focused on self-images, distorted thin images, or estimating body weights. It may be reasona- bly expected that the extrastriate body area, which is located in the lateral occipitotemporal cortex, must re- spond to visual images of human bodies and body parts [33]. In fact, one study suggested the importance of the right parietal cortex in developing and maintaining body representation, as well as in the pathogenesis of anorexia [34]. This study used a frontal-sp ecific metho dology, and should therefore be complemented with whole-brain mea- surement. Considering the importance of body image disturbance, especially for the mental health of women, and the interest in the neurobiological basis of gender dif- ferences in EDs, the clinic al impl icat ions o f these fin din g s should be investigated. Recently, Miyake et al. [35] re- ported significant activation of the occipitotemporal cor- tex, right parietal cortex, and DLPFC (BA 9) in restrict- ing AN using the other fat-image task versus the other real-image task. The occipitotemporal and right parietal cortices were significantly activated in the binge eat- ing/purging type of AN (AN-BP) and control subjects, whereas in the bulimia nervosa (BN) patients, the right occipital (BA 18) and right parietal lobes were signifi- cantly activated. Their series of studies used negative word stimuli concerning body, and the left medial PFC was activated both in patients with BN and in patients with AN-BP [36]. The other limitations of this study should be noticed. Female participants were over two folds than male par- ticipants in this study; therefore, it must be careful to generalize this finding. And people in different cultures may have different response to pathologically thin fe- male body forms. Actually regarding psychopathology of eating disorders, thinner body image could be common within various Westernized countries. But it should be mentioned that gender difference may not be observed for people in alternative areas. In conclusion, gender differences in frontal activation suggest differential processing by men and women of pathologically thin female body forms. The study also suggests that anorexic psychopathology may be associ- ated with abnormal right frontal activations while view- ing the thin body forms of others. 5. Acknowledgements This study was supported by the Intramural Research Grant (20-1) for Neurological and Psychiatric Disorders of NCNP, Japan. The summary of this study have been presented at a national meeting (33rd Japanese Society of Biological Psychiatry in Tokyo, 2011) and will be on an international conferen ce (17th Eating Disorders Research Society in Edinburgh, 2011). 6. References [1] R. Uher, T. Murphy, H. C. Friederich, T. Dalgleish, M. J. Brammer, V. Giampietro, M. L. Phillips, C. M. Andrew,  T. UEHARA ET AL. Copyright © 2011 SciRes. JBBS 109 V. W. Ng, S. C. Williams, I. C. Campbell and J. Treasure, “Functional Neuroanatomy of Body Shape Perception In Healthy and Eating-Disordered Women,” Biological Psy- chiatry, Vol. 58, No. 12, 2005, pp. 990-997. doi:10.1016/j.biopsych.2005.06.001 [2] A. Wagner, M. Ruf, D. F. Braus and M. H. Schmidt, “Neuronal Activity Changes and Body Image Distortion in Anorexia Nervosa,” NeuroReport, Vol. 14, 2003, pp. 2193-2197. doi:10.1097/00001756-200312020-00012 [3] J. Schwoebel and H. B. Coslett, “Evidence for Multiple, Distinct Representations of the Human Body,” Journal of Cognitive Neuroscience, Vol. 17, No. 4, 2005, pp. 543- 553. doi:10.1162/0898929053467587 [4] N. Shirao, Y. Okamoto, T. Mantani, Y. Okamoto and S. Yamawaki, “Gender Differences in Brain Activity Gen- erated by Unpleasant Word Stimuli Concerning Body Im- age: An fMRI Study,” British Journal of Psychiatry, Vol. 186, 2005, pp. 48-53. doi:10.1192/bjp.186.1.48 [5] H. M. Mohr, J. Zimmermann, C. Röder, C. Lenz, G. Overbeck and R. Grabhorn, “Separating Two Compo- nents of Body Image in Anorexia Nervosa Using fMRI,” Psychological Medicine, Vol. 40, 2010, pp. 1519-1529. doi:10.1017/S0033291709991826 [6] H. C. Friederich, R. Uher, S. Brooks, V. Giampietro, M. Brammer, S. C. Williams, W. Herzog, J. Treasure and I. C. Campbell, “I’m Not as Slim as That Girl: Neural Bases of Body Shape Self-Comparison to Media Images,” Neuro- Image, Vol. 37, No. 2, 2007, pp. 674-681. doi:10.1016/j.neuroimage.2007.05.039 [7] M. Kurosaki, N. Shirao, H. Yamashita, Y. Okamoto and S. Yamawaki, “Distorted Images of One’s Own Body Activates the Prefrontal Cortex and Limbic/Paralimbic System in Young Women: A Functional Magnetic Reso- nance Imaging Study,” Biological Psychiatry, Vol. 59, No. 4, 2006, pp. 380-386. doi:10.1016/j.biopsych.2005.06.039 [8] P. Fossati, S. J. Hevenor, S. J. Graham, C. Grady, M. L. Keightley, F. Craik and H. Mayberg, “In Search of the Emotional Self: An FMRI Study Using Positive and Nega- tive Emotional Words,” American Journal of Psychiatry, Vol. 160, No. 11, 2003, pp. 1938-1945. doi:10.1176/appi.ajp.160.11.1938 [9] K. N. Ochsner, K. Knierim, D. H. Ludlow, J. Hanelin, T. Ramachandran, G. Glover and S. C. Mackey, “Reflecting upon Feelings: An fMRI Study of Neural Systems Sup- porting the Attribution of Emotion to Self and Other,” Journal of Cognitive Neuroscience, Vol. 16, No. 10, 2004, pp. 1746-1772. doi:10.1162/0898929042947829 [10] P. Sachdev, N. Mondraty, W. Wen and K. Guilford, “Brains of Anorexia Nervosa Patients Process Self-Images Differently from Non-Self-Images: An fMRI Study,” Nu- eropsyhologia, Vol. 46, 2008, pp. 2161-2168. [11] D. A. Boas, A. M. Dale and M. A. Franceschini, “Diffuse Optical Imaging of Brain Activation: Approaches to Op- timizing Image Sensitivity, Resolution, and Accuracy,” Neuroimage, Vol. 23, Supplement 1, 2004, pp. 275-288. doi:10.1016/j.neuroimage.2004.07.011 [12] M. Suda, M. Fukuda, T. Sato, S. Iwata, M. Song, M. Kameyama and M. Mikuni, “Subjective Feeling of Psy- chological Fatigue Is Related to Decreased Reactivity in Ventrolateral Prefrontal Cortex,” Brain Research, Vol. 1252, Supplement 1, 2009, pp. 152-160. doi:10.1016/j.brainres.2008.11.077 [13] S. Grignon, K. Forget, M. Durand and T. Huppert, “In- creased Left Prefrontal Activation During Staring/Mutism Episodes in a Patient with Resistant Catatonic Schizo- phrenia: A Near Infrared Spectroscopy Study,” Cognitive Behavior Neurology, Vol. 21, No. 1, 2008, pp. 41-45. doi:10.1097/WNN.0b013e3181684d87 [14] R. Takizawa, K.Kasai, Y. Kawakubo, K. Marumo, S. Ka- wasaki and H. Yamasue, “Reduced Frontopolar Activation during Verbal Fluency Task in Schizophrenia: A Mul- tichannel Near-Infrared Spectroscopy Study,” Schizophre- nia Research, Vol. 99, 2008, pp. 250-262. doi:10.1016/j.schres.2007.10.025 [15] K. Matsuo, Y. Onodera, T. Hamamoto, K. Muraki, N. Kato and T. Kato, “Hypofrontality and Microvascular Dysregu- lation in Remitted Late-Onset Depression Assessed by Functional Near-Infrare d Spectroscopy,” Neuroimage, Vol. 26, No. 1, 2005, pp. 234-242. doi:10.1016/j.neuroimage.2005.01.024 [16] A. C. Ehlis, C. G. Bähne, C. P. Jacob, M. J. Herrmann and A. J. Fallgatter, “Reduced Lateral Prefrontal Activation in Adult Patients with Attention-Deficit/Hyperactivity Dis- order (ADHD) during a Working Memory Task: A Func- tional Near-Infrared Spectroscopy (fNIRS) Study,” Jour- nal of Psychiatric Research, Vol. 42, No. 3, 2008, pp. 1060-1067. doi:10.1016/j.jpsychires.2007.11.011 [17] M. Suda, Y. Takei, Y. Aoyama, K. Narita, T. Sato, M. Fukuda and M. Mikuni, “Frontopolar Activation During Face-to-Face Conversation: An in Situ Study Using Near-Infrared Spectroscopy,” Neuropsychologia, Vol. 48, No. 2, 2010a, pp. 441-447. doi:10.1016/j.neuropsychologia.2009.09.036 [18] M. Suda, T. Sato, M. Kameyama, M. Ito, T. Suto, Y. Yamagishi, T. Uehara, M. Fukuda and M. Mikuni, “De- creased Cortical Reactivity Underlies Subjective Daytime Light Sleepiness in Healthy Subjects: A Multichannel Near-Infrared Spectroscopy Study,” Neuroscience Re- search, Vol. 60, No. 3, 2008, pp. 319-326. doi:10.1016/j.neures.2007.12.001 [19] T. Sato, M. Ito, T. Suto, M. Kameyama, M. Suda, Y. Yamagishi, A. Ohshima, T. Uehara, M. Fukuda and M. Mikuni, “Time Courses of Brain Activation and Their Im- plications for Functio n: A M ultichannel Near-Infrared Spec- troscopy Study during Finger Tapping,” Neuroscience Re- search, Vol. 58, No. 3, 2007, pp. 297-304. doi:10.1016/j.neures.2007.03.014 [20] E. Ohmae, Y. Ouchi, M. Oda, T. Suzuki, S. Nobesawa, T. Kanno, E. Yos hikawa, M. F utatsubashi, Y. Ueda, H. Okada and Y. Yamashit a, “Cerebral Hemody namics Evaluati on by Near-Infrared Time-Resolved Spectroscopy: Correlation with Simultaneous Positron Emission Tomography Mea- surements,” Neuroimage, Vol. 29, No. 3, 2006, pp. 697- 705. [21] V. Toronov, A. Webb, J. H. Choi, M. Wolf, A. Michalos, E. Gratton and D. Hueber, “Investigation of Human Brain  T. UEHARA ET AL. Copyright © 2011 SciRes. JBBS 110 Hemodynamics by Simultaneous Near-Infrared Spec- troscopy and Functional Magnetic Resonance Imaging,” Medical Physiology, Vol. 28, No. 4, 2001, pp. 521-527. doi:10.1118/1.1354627 [22] D. J. Mehagnoul-Schipper, B. F. van der Kallen, W. N. Colier, M. C. van der Sluijs, L. J. van Erning, H. O. Thi- jssen, B. Oeseburg, W. H. Hoefnagels and R. W. Jansen, “Simultaneous Measurements of Cerebral Oxygenation Changes During Brain Activation by Near-Infrared Spec- troscopy and Functional Magnetic Resonance Imaging in Healthy Young and Elderly Subjects,” Human Brain Mapping, Vol. 16, No. 1, 2002, pp. 14-23. doi:10.1002/hbm.10026 [23] D. M. Garner, M. P. Olmsted, Y. Bohr and P. E. Garfinkel, “The Eating Attitudes Test: Psychometric Fea- tures and Clinical Correlates,” Psychological Medicine, Vol. 12, No. 4, 1982, pp. 871-878. doi:10.1017/S0033291700049163 [24] K. Nakamura, Y. Hoshino, A. Watanabe, K. Honda, S. Niwa, K. Tominaga, S. Shimai and M. Yamamoto, “Eat- ing Problems in Female Japanese High School Students: A Prevalence Study,” International Journal of Eating Dis- orders, Vol. 26, No. 1, 1999, pp. 91-95. doi:10.1002/(SICI)1098-108X(199907)26:1<91::AID-EA T12>3.0.CO;2-M [25] M. Kameyama, M. Fukuda, Y. Yamagishi, T. Sato, T. Uehara, M. Ito and M. Mikuni, “Frontal Lobe Function in Bipolar Disorder: A Multichannel Near-Infrared Spec- troscopy Study,” Neuroimage, Vol. 29, No. 1, 2006, pp. 172-184. doi:10.1016/j.neuroimage.2005.07.025 [26] T. Suto, M. Fukuda, M. Ito, T. Uehara and M. Mikuni, “Multichannel Near-Infrared Spectroscopy in Depression and Schizophrenia: Cognitive Brain Activation Study,” Biological Psychiatry, Vol. 55, No. 5, 2005, pp. 501-511. doi:10.1016/j.biopsych.2003.09.008 [27] A. Etkin, T. Egner, D. M. Peraza, E. R. Kandel and J. Hirsch, “Resolving Emotional Conflict: A Role for the Rostral Anterior Cingulate Cortex in Modulating Activity in the Amygdale,” Neuron, Vol. 51, No. 6, 2006, pp. 871- 882. doi:10.1016/j.neuron.2006.07.029 [28] M. Suda, T. Uehara, M. Fukuda, T. Sato, M. Kameyama, and M. Mikuni, “Dieting Tendency and Eating Behavior Problems in Eating Disorder Correlate with Right Fron- totemporal and Left Orbitofrontal Cortex: A Near-Infra- red Spectroscopy Study,” Journal of Psychiatry Research, Vol. 44, No. 8, 2010b, pp. 547-555. doi:10.1016/j.jpsychires.2009.11.005 [29] T. A. Kimbrell, M. S. George, P. I. Parekh, T. A. Ketter, D. M. Podell, A. L. Danielson, J. D. Repella, B. E. Ben- son, M. W. Willis, P. Herscovitch and R. M. Post, “Re- gional Brain Activity During Transient Selfinduced An- xiety and Anger in Healthy Adults,” Biological Psychia- try, Vol. 46, No. 4, 1999, pp. 454-465. doi:10.1016/S0006-3223(99)00103-1 [30] D. D. Dougherty, L. M. Shin, N. M. Alpert, R. K. Pitman, S. P. Orr, M. Lasko, M. L. Ma cklin, A. J. Fischman, S. L. Rauch, “Anger in Healthy Men: A Pet Study Using Script-Driven Imagery,” Biological Psychiatry, Vol. 46, No. 4, 1999, pp. 466-472. doi:10.1016/S0006-3223(99)00063-3 [31] S. Grimm, C. F. Schmidt, F. Bermpohl, A. Heinzel, Y. Dahlem, M. Wyss, D. Hell, P. Boesiger, H. Boeker and G. Northoff, “Segregated Neural Representation of Distinct Emotion Dimensions in the Prefrontal Cortex—An fMRI Study,” Neuroimage, Vol. 30, No. 1, 2006, pp. 325-340. doi:10.1016/j.neuroimage.2005.09.006 [32] D. Tsuzuki, V. Jurcak, A. K. Singh, M. Okamoto, E. Wa- tanabe and I. Dan, “Virtual Spatial Registration of Stand- Alone fNIRS Data to MNI Space,” Neuroimage, Vol. 34, No. 4, 2007, pp. 1506-1518. doi:10.1016/j.neuroimage.2006.10.043 [33] P. E. Downing, Y. Jiang, M. Shuman and N. Kanwisher, “A Cortical Area Selective for Visual Processing of the Human Body,” Science, Vol. 293, No. 5539, 2001, pp. 2470-2473. doi:10.1126/science.1063414 [34] D. Nico, E. Daprati, N. Nighoghossian, E. Carrier, J. R. Duhamel and A. Sirigu, “The Role of the Right Parietal Lobe in Anorexia Nervosa,” Psychological Medicine, Vol. 40, No. 9, 2010, pp. 1531-1539. doi:10.1017/S0033291709991851 [35] Y. Miyake, Y. Okamoto, K. Onoda, M. Kurosaki, N. Shirao, Y. Okamoto and S. Yamawaki, “Brain Activation during the Perception of Distorted Body Images in Eating Disorders,” Psychiatry Research, Vol. 181, No. 3, 2010a, pp. 183-192. doi:10.1016/j.pscychresns.2009.09.001 [36] Y. Miyake, Y. Okamoto, K. Onoda, N. Shirao, Y. Oka- moto, Y. Otagaki and S. Yamawaki, “Neural Processing of Negative Word Stimuli Concerning Body Image in Pa- tients with Eating Disorders: An fMRI Study,” Neuroi- mage, Vol. 50, No. 3, 2010b, pp. 1333-1339. doi:10.1016/j.neuroimage.2009.12.095 |