 International Journal of Geosciences, 2011, 2, 267-273 doi:10.4236/ijg.2011.23029 Published Online August 2011 (http://www.SciRP.org/journal/ijg) Copyright © 2011 SciRes. IJG Rapid Lab-Scale Microwave-Assisted Extraction and Analysis of Anthrop o genic Organic Chemicals in River Sediments Thomas J. Brown, Chad A. Kinney Chemistry Department, Colorado State University-Pueblo, Pueblo, United States of America E-mail: chad.kinney@colostate-pueblo.edu Received June 16, 2011; revised July 19, 2011; accepted August 4, 2011 Abstract An Ethos EZ Microwave Lab Station is employed in the development of a robust and efficient microwave extraction method for organic contaminants of anthropogenic origin in river sediments. The extraction method is designed for a small, representative set of target compounds encompassing a range of physicochemical properties. Listed in order of gas chromatography elution they are para-cresol, indole, 4-tert-octylphenol, phenanthrene, triclosan, bisphenol-A, carbamazepine, and benzo[a]pyrene. The sediments samples are ex- tracted wet, which reduces preparation time, and allows the ambient moisture of the sediments to aid in mi- crowave energy absorption and the extraction process. The microwave can hold up to 12 samples that can be simultaneously extracted allowing for rapid sample preparation. Utilizing the pressurized vessels, microwave energy, and a unique mixture of three organic solvents allows for multiple samples to be extracted rapidly with minimal solvent consumption. The final extracts are quantified by gas chromatography/mass spectro- metry. Recoveries of the 8 target compounds in sediment range from 49% to 113%, and method detection limits range between 14 and 114 μg kg–1, which are comparable with other more time consuming methods. Keywords: Microwave Assisted Extraction, Para-Cresol, Phenanthrene, Bisphenol-A, Triclosan, Benzo[a]pyrene 1. Introduction Surface waters have historically been burdened with a variety of pollutants including suspended solids, nutri- ents and pathogens [1]. Other historic classes of indus- trial pollutants include heavy metals, pesticides, PCB’s, dioxins, volatile organics and polycyclic aromatic com- pounds. There are also “emerging pollutants” which in- clude pharmaceuticals, personal care products, surfac- tants, flame-retardants, plasticizers and other endocrine disrupting compounds that may not be effectively re- moved by conventional wastewater treatment plants. These anthropogenic organic compounds (AOCs) find their way into the environment in a number of different ways. Some AOCs, such as the polycyclic aromatic hy- drocarbons (PAHs) phenanthrene and benzo[a]pyrene, are the result of combustion process. Once airborne, PAHs may eventually deposited on the ground through precipitation, and therefore make their way into water- ways by urban run-off [2]. Urban runoff may be a source of other AOCs such as para-cresol, which can originate from road building (asphalt construction) or from wood preservation products [3,4]. Many AOCs including PAHs, pharmaceuticals and personal care products, de- tergent metabolites, and more enter surface water in the effluent discharged from wastewater treatment plants [5,6]. AOCs are routinely detected in sediments at the bottom of creeks, rivers, lakes and marine harbors [3,7-12]. AOCs that make their way into sediments are known to have longer half-lives than in soil, water or air, because of the usually low temperatures and mostly an- aerobic environment [13,14]. AOCs with large octanol water partition coefficients tend to preferentially parti- tion into the sediment from the water [15], and may bio- concentrate or biomagnify in living organisms and their predators, respectively [16]. The classic method still widely used to separate an- thropogenic organic compounds from sediments and other solid or semisolid matrices is by Soxhlet extraction, invented in 1879 [17]. It involves refluxing and recycling  T. J. BROWN ET AL. 268 an organic solvent through the sample continuously for 3 to 48 hours to dissolve the targeted compounds into the organic solvent [18]. In the last two decades there has been call for newer more automated methods that offer shorter extraction intervals and smaller and less toxic solvent loads [18]. Several competing methods have been developed to meet this demand. They include su- percritical fluid extraction, pressurized liquid extraction, and microwave-assisted extraction. Supercritical fluid extraction (SFE) typically utilizes supercritical carbon dioxide with or without a co-solvent such as methanol, to extract the target compounds from the solid matrix. It is an environmentally benign tech- nique, and technologically advanced, but there are nu- merous factors that must be optimized, particularly in analyte collection SFE extraction takes between 10 to 60 minutes to complete [18,19]. Pressurized liquid extraction (PLE) is another tech- nique that lends itself to automation. Utilizing PLE, the sample and solvent are pressurized and heated. The main advantages of this method are fast extraction times and limited solvent use. Interfering compounds such as lipids, pigments and sterols can be co-extracted [20]. Unless these compounds are removed in a subsequent cleanup step, these compounds may impair the efficiency of a chromatographic column and quantitative analysis [21]. Microwave extraction entails immersing and heating the sample in a liquid capable of absorbing microwave radiation. There are two types of microwave extraction techniques; one using closed vessels known as micro- wave-assisted extraction (MAE) and the other technique using open vessels known as focused microwave assisted solvent extraction (FMASE). FMASE typically requires a slightly longer extraction time since the temperature of the extraction is limited by the boiling point of the sol- vent system. In addition to low solvent volumes and fast extraction times, microwave extraction offers the impor- tant advantage of the ability to perform simultaneous extractions of multiple samples. Typically solvent mix- tures or systems are employed that combine two or more solvents together in different ratios to achieve the desired solvent properties [21]. 2. Materials and Methods 2.1. Chemicals Organic solvents were all HPLC grade or better. Di- chloromethane (DCM) and acetone were from Mallin- ckrodt Chemicals and ethyl acetate (EtOAc) was from EMD Chemicals. Sodium sulfate was purchased from Fisher Scientific. Solid phase extraction (SPE) tubes (6 mL) containing 1 g of Florisil with stainless steel frits were purchased from Supelco Analytical (Supelclean™ ENVI™ Florisil®). The internal standard (phenanthrene- d10) was purchased from Isotec through Sigma Aldrich. N, O-bis-(trimethylsilyl) trifluoroacetamide (BSTFA) was purchased from TCI America. Analytical standards of the target compounds were purchased from Sigma Al- drich. 2.2. Microwave Assisted Extraction Samples were extracted without stirring in a Milestone Ethos EZ Microwave Lab Station equipped with 100 mL Teflon vessels rated to withstand 30 bar of internal pres- sure. Prior to use the Teflon vessels were cleaned with a solution of water and Alconox. This is followed by mi- crowaving with 8.5 mL of DI water, 1.0 mL concentrated nitric acid and 0.5 mL of 30% hydrogen peroxide to 110˚C for ten minutes to rid the vessels of residual or- ganics. This is followed by microwaving with 2 mL of concentrated NaOH and 8 mL of water to 110˚C to neu- tralize any residual acid that could react at elevated tem- perature and pressure with the sediments. Finally, just prior to use the vessels are rinsed with acetone. Sediment samples are prepared by pouring off any su- pernatant layer of water and then homogenized. Any obvious foreign material such as large rocks, sticks or leaves were then eliminated prior to extraction. About 5 g of wet sediments are placed in the microwaveable ves- sels enough DI water is added to bring the sediment to 24% moisture. Water was also added to the dry sand used during the method development. The local heating of water facilitated by microwave energy is thought to help liberate target molecules [22,23]. A 30 mL volume of a 1:1:1 mixture of DCM /EtOAc/acetone was then added to the sediment or sand in the extraction vessel. The vessel is sealed and shaken vigorously for a few seconds. The microwave parameters are a 10-min ramp to 110˚C, hold for 10 min, then cool the vessels in the microwave for 30 min to <50˚C prior to further process- ing. Prior to opening, each vessel is again shaken vigor- ously. 2.3. Sample Cleanup and Preconcentration A 58 degree short stem glass funnel loaded with a tab of baked glass wool to trap the sediment. The funnel is set loosely on top of the 60 mL plastic BD Luer-Lok syringe with the plunger removed. A 25 mm 0.2 mm PTFE sy- ringe filter is attached to the bottom of the syringe. The filter is connected by a union to a 6 mL Florisil SPE car- tridge (1 g Supelclean ENVI made by Supelco) precon- ditioned with 10 mL of the 1:1:1 mixture of DCM/ EtOAc/acetone solvent and filled with approximately 4 g of anhydrous sodium sulfate. The extract is poured through the funnel into the syringe. The funnel is re- Copyright © 2011 SciRes. IJG  T. J. BROWN ET AL.269 moved and the extract is then passed through this cleanup system by positive pressure using the syringe plunger directly into the evaporation glassware (LAB- CONCO RapidVap 600 mL glass evaporative tube). The microwave container was then rinsed with 6 mL of 1:1:1 DCM/EtOAc/acetone that is passed through the cleanup system generating about 36 mL of total extract. The extract is concentrated by evaporation under a ni- trogen blanket (13,800 Pa) at 70˚C to a final volume of 1 mL using a LABCONCO RapidVap N2 Evaporation System. The vortex mixing action of the evaporation system is left off for most of the evaporative process to yield the best recovery of the compounds. When the ex- tract is less than 2 mL and is contained in the stem of the tube the vortex is turned on at the lowest setting of 24%. If the concentrated extract is nearly clear or light am- ber in color the extract is transferred into a 2 mL GC vial and 50 µL of the 100 ng/µL internal standard phenan- threne-d10 is added. When the extract is a dark orange or brown in color, indicating the potential presence of hu- mic interferences. The extract is pipetted into a small 15 mL centrifuge tube and centrifuged at 1500 rpm for 30 seconds. The supernatant is pipetted into a 2 mL GC vial and the internal standard is added. The vial is mixed on a Baxter Super Mixer II for 10 seconds prior to GC/MS analysis. 2.4. Gas Chromatography/Mass Spectrometry The AOCs in the concentrated extracts were quantified on an Agilent 6890N/5973N GC/MSD. It was operated using positive electron impact ionization (70 eV) and in the full-scan mode from 45 - 450 mass/charge ratio (m/z). The GC/MS was equipped with a 30 meter Restek RTX- 5Sil MS w/Integra Guard with a 0.25 mm ID and 0.25 µm film thickness. A 2 µL volume was injected in splitless mode. The injection port temperature was 290˚C, the purge flow was 6.1 mL/min, and the transfer line was maintained at 250˚C. The oven temperature was pro- grammed as follows: 40˚C (hold 3 min), ramped at 8˚C/min to 100˚C (hold 4.50 min), then ramped at 9˚C /min to 290˚C and (hold 2 min) with pressure control set for a constant flow of helium carrier gas of 3.0 mL/min. As a measure of quality control, lab blanks were run to guard against laboratory contamination and compound carryover. An injection internal standard, 5.00 ng/µL of phenanthrene-d10 is used for quantification purposes. Multiple ion monitoring of the mass spectra along with retention time was used for target compound identifica- tion. 2.5. MAE Method Validation Ashed (400˚C for 4 hours) Ottawa reagent-sand (Fisher Scientific, Fairlawn, NJ USA) and 4 stream sediment samples from Fountain Creek near Colorado Springs and Pueblo, Colorado were utilized in the validation of the method. Eight samples (5 g) of each were spiked with 10 g of each compound. Also, three unfortified blank sam- ples of both sand and sediment were extracted for quality control purposes. The sand serves as a method blank to prevent and alert against laboratory contamination. The sediment samples were stored at 4˚C prior to extraction. Sand samples were spiked just prior to placing them in the microwave for extraction. The sediment samples were spiked, mixed and allowed to equilibrate at room temperature for 24 hours before MAE. The unfortified sediment samples contained trace but quantifiable amounts of phenanthrene and benzo[a]pyrene which were subtracted from the spiked sample results. The ini- tial method detection limits (IMDL) were determined according to the procedure outlined by the U.S. Envi- ronmental Protection Agency [24]. 2.6. Derivatization While not part of the final reported and applied method, to help provide a more sensitive analysis of some of the target compounds, especially bisphenol-A and triclosan, extract derivatization with a silylation was tested. After mixing the final extract, 50 µL of the extract was pipet- ted into another 2 mL GC vial containing a 350 µL, coni- cal pulled point insert. Then 50 µL of N, O-bis-(trime- thylsilyl) trifluoroacetamide (BSTFA) is added to the extract, close the vial and heat at 70˚C for 30 minutes for derivatization. The derivatization of the calibration stan- dard solutions is conducted simultaneously using the same protocol. All compounds with active hydrogens can be derivatized. 2.7. Sample Sites Sediments from four sites along upper (UF) and lower (LF) Fountain Creek near Colorado Springs, Colorado were collected on March 25th 2009 with approximate locations of between 38˚51- 48'N latitude and 104˚55 – 47'W longitude. The four sites were 46.32 km (LF-2), 53.83 km (LF-1), 65.46 km (UF-2), and 77.57 km (UF-1) from the confluence of Fountain Creek and the Arkansas River. Fountain Creek was originally ephemeral, flowing only from snowmelt and precipitation, but base flow is currently dominated by wastewater effluent and flow year around. A 2.54 cm PVC pipe was punched 10 cm into the sediment five times in a transect across the creek at each site to collect a composite sediment sample. The samples were stored at 4˚C until extraction. To further validate the utility of the MAE method, 8 Copyright © 2011 SciRes. IJG 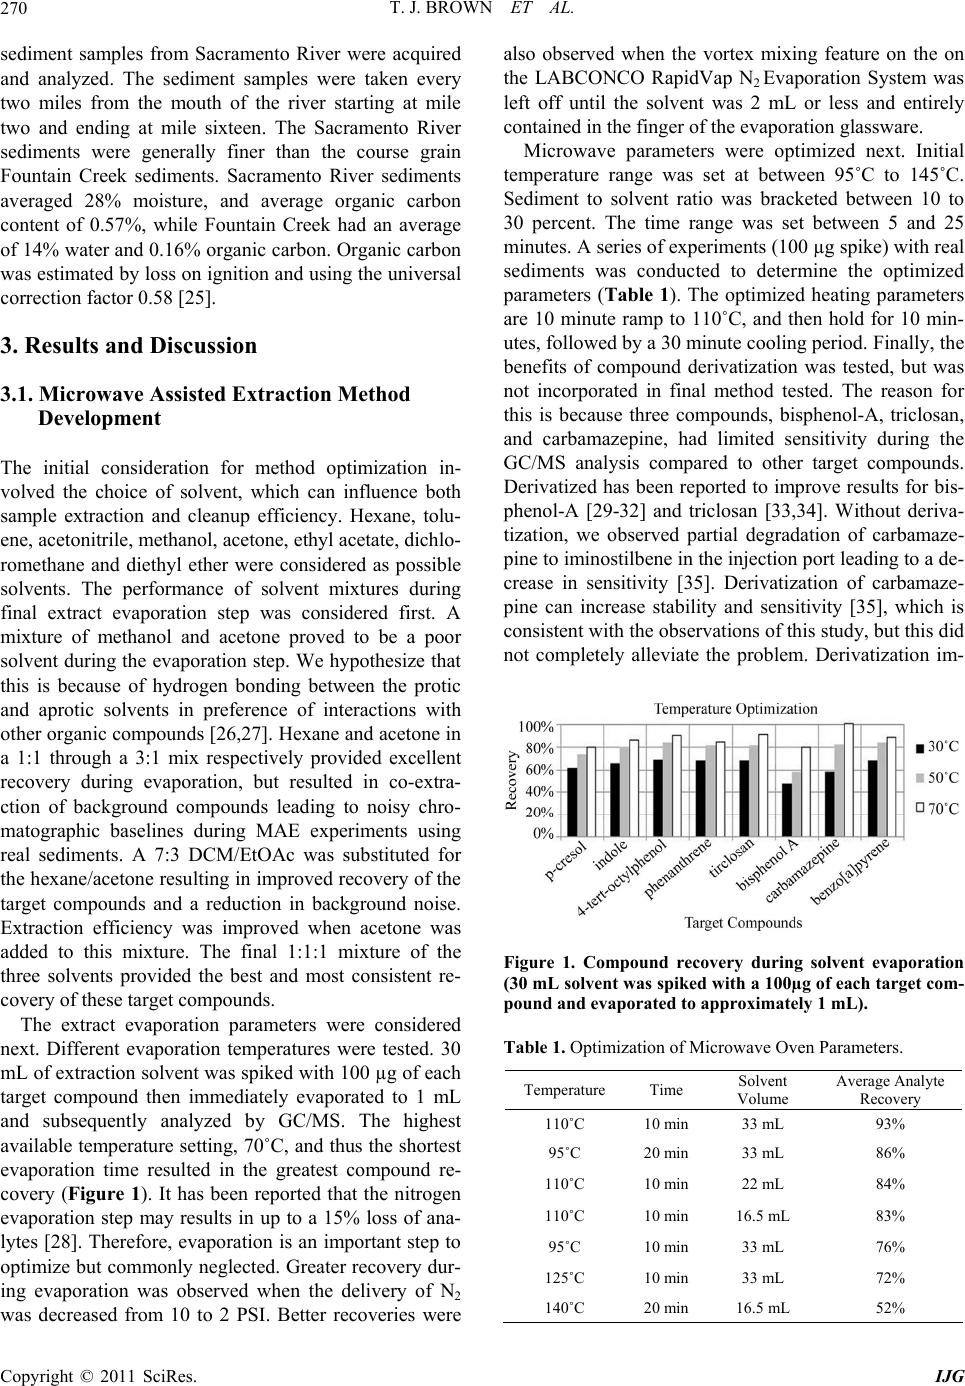 T. J. BROWN ET AL. 270 sediment samples from Sacramento River were acquired and analyzed. The sediment samples were taken every two miles from the mouth of the river starting at mile two and ending at mile sixteen. The Sacramento River sediments were generally finer than the course grain Fountain Creek sediments. Sacramento River sediments averaged 28% moisture, and average organic carbon content of 0.57%, while Fountain Creek had an average of 14% water and 0.16% organic carbon. Organic carbon was estimated by loss on ignition and using the universal correction factor 0.58 [25]. 3. Results and Discussion 3.1. Microwave Assisted Extraction Method Development The initial consideration for method optimization in- volved the choice of solvent, which can influence both sample extraction and cleanup efficiency. Hexane, tolu- ene, acetonitrile, methanol, acetone, ethyl acetate, dichlo- romethane and diethyl ether were considered as possible solvents. The performance of solvent mixtures during final extract evaporation step was considered first. A mixture of methanol and acetone proved to be a poor solvent during the evaporation step. We hypothesize that this is because of hydrogen bonding between the protic and aprotic solvents in preference of interactions with other organic compounds [26,27]. Hexane and acetone in a 1:1 through a 3:1 mix respectively provided excellent recovery during evaporation, but resulted in co-extra- ction of background compounds leading to noisy chro- matographic baselines during MAE experiments using real sediments. A 7:3 DCM/EtOAc was substituted for the hexane/acetone resulting in improved recovery of the target compounds and a reduction in background noise. Extraction efficiency was improved when acetone was added to this mixture. The final 1:1:1 mixture of the three solvents provided the best and most consistent re- covery of these target compounds. The extract evaporation parameters were considered next. Different evaporation temperatures were tested. 30 mL of extraction solvent was spiked with 100 µg of each target compound then immediately evaporated to 1 mL and subsequently analyzed by GC/MS. The highest available temperature setting, 70˚C, and thus the shortest evaporation time resulted in the greatest compound re- covery (Figure 1). It has been reported that the nitrogen evaporation step may results in up to a 15% loss of ana- lytes [28]. Therefore, evaporation is an important step to optimize but commonly neglected. Greater recovery dur- ing evaporation was observed when the delivery of N2 was decreased from 10 to 2 PSI. Better recoveries were also observed when the vortex mixing feature on the on the LABCONCO RapidVap N2 Evaporation System was left off until the solvent was 2 mL or less and entirely contained in the finger of the evaporation glassware. Microwave parameters were optimized next. Initial temperature range was set at between 95˚C to 145˚C. Sediment to solvent ratio was bracketed between 10 to 30 percent. The time range was set between 5 and 25 minutes. A series of experiments (100 µg spike) with real sediments was conducted to determine the optimized parameters (Table 1). The optimized heating parameters are 10 minute ramp to 110˚C, and then hold for 10 min- utes, followed by a 30 minute cooling period. Finally, the benefits of compound derivatization was tested, but was not incorporated in final method tested. The reason for this is because three compounds, bisphenol-A, triclosan, and carbamazepine, had limited sensitivity during the GC/MS analysis compared to other target compounds. Derivatized has been reported to improve results for bis- phenol-A [29-32] and triclosan [33,34]. Without deriva- tization, we observed partial degradation of carbamaze- pine to iminostilbene in the injection port leading to a de- crease in sensitivity [35]. Derivatization of carbamaze- pine can increase stability and sensitivity [35], which is consistent with the observations of this study, but this did not completely alleviate the problem. Derivatization im- Figure 1. Compound recovery during solvent evaporation (30 mL solvent was spiked with a 100µg of each target com- pound and evaporated to approximately 1 mL). Table 1. Optimization of Microwave Oven Parameters. Temperature Time Solvent Volume Average Analyte Recovery 110˚C 10 min 33 mL 93% 95˚C 20 min 33 mL 86% 110˚C 10 min 22 mL 84% 110˚C 10 min 16.5 mL 83% 95˚C 10 min 33 mL 76% 125˚C 10 min 33 mL 72% 140˚C 20 min 16.5 mL 52% Copyright © 2011 SciRes. IJG  T. J. BROWN ET AL.271 proved calibration sensitivity for the bisphenol-A, and triclosan by a factor of 6.6 and 3.3, respectively. In fact, the calibration sensitivity of all the derivatized com- pounds improved to some extent with the exception of indole, which contains a difficult to derivatize secondary amine. 3.2. MAE Method Performance The performance of the MAE and GC/MS quantification method reported here (Table 2) is comparable to other extraction/quantification methods, including other MAE based methods, employed for organic contaminants in sediments and other solid samples. For example Lopez- Avila et al.[28] reported recoveries of PAHs in an opti- mized microwave method of 101% for benzo [a] pyrene and 81.9% for phenanthrene for a soil-sediment suspen- sion, which is comparable with this MAE method of 113% recovery for benzo[a]pyrene and 62% recovery of phenanthrene in sediment. Seven out of the eight com- pounds included in this study were included in a pres- surized liquid extraction (PLE) based method developed by Burkhardt et al. [8]. Overall the recoveries of target analytes using this MAE method are slightly better than those reported by Burkhardt et al. [8], and the IMDLs are comparable. In particular the recovery of bisphenol-A was improved using MAE compared to PLE. EPA method 1694 has LC/MS/MS reported a detection limit for carbamazepine of 1.6 µg/kg and for triclosan of 56 µg/kg The detection limit of our MAE method for car- bamazepine 64.6 µg/kg is much greater than the EPA method, but our triclosan IMDL of 66.8 µg/kg was very close to the EPA method [36]. Because of its proven capability to extract compounds with a wide range of physico-chemical properties from sediments, there is a high likelihood that other emerging AOCs could be added or substituted with the eight ana- lytes in this study. The major advantage of this MAE method over some other possible extraction procedures is the ability to perform 12 extractions simultaneously and a quick clean-up step thereby dramatically reducing the time required for sample preparation. The primary limi- tation that occurred during the development of the method reported here is the larger than desired standard deviations for some compounds that ultimately results in higher detection limits, which may be improved with a microwave oven that includes a stirring provision. 3.3. AOCs in Sediments As a test of the MAE method reported here, a small set of sampling of the Fountain Creek Watershed was con- ducted on March 25, 2009. Some portions of Fountain Creek, particularly those in the Lower Fountain Creek below Colorado Springs, CO are dominated by waste- water effluent. The results are summarized in Figure 2. Many of the target compounds were detected below the calculated method detection limits, which are designated with an “a” in Figure 2. In such instances all reporting criteria with the exception of the IMDL were met. In those instances where compounds were detected below the IMDLs the estimated concentrations have been in- cluded. This may in part reflect the paucity of organic matter present in Fountain Creek sediment. Sample UF-1 was extracted in triplicate to assess method precision. The precision for the detected compounds are good ex- cept for triclosan, which was only quantified in one of the three samples extracted. To further test the reported method, 8 sediment sam- ples from the Sacramento River were also extracted and analyzed. Of the target compounds included in this me- thod, only the two PAHs, phenanthrene and benzo [a] pyrene were detected in the Sacramento River sediments. Benzo[a]pyrene was detected in all of the Sacramento Table 2. MAE Method Recoveries and IMDLs. Sand Sediment Target Compounds Recovery (%) IMDL (µg/kg) Recovery (%) IMDL (µg/kg) p-cresol 128.8 175.0 83.6 85.9 indole 89.3 27.3 48.9 44.3 4-tert-octylphenol98.6 27.9 59.5 100.8 phenanthrene 98.5 36.7 62.0 13.9 triclosan 97.8 139.7 97.1 66.8 bisphenol-A 96.5 110.4 100.9 113.7 carbamazepine 105.0 79.9 110.1 64.6 benzo[a]pyrene 111.1 45.0 112.9 71.6 Figure 2. Concentrations of target compounds in sediments collected on March 25, 2009 along Upper Fountain (UF) Creek and Lower Fountain (LF). Creek near Colorado Springs, Colorado. The capped black lines represent ± 1 standard deviation of triplicate extractions of UF-1. The “a” indicates an estimated concentration that falls below the 99% confidence MDLs. Copyright © 2011 SciRes. IJG  T. J. BROWN ET AL. 272 sediments tested three of which were above the IMDL. The concentration ranged from an estimated 61.1 µg/kg to 185.1 µg/kg. Phenanthrene was positively identified in six of the sample sites only one sample came close to the detection limit of 13.9 µg/kg. 4. Conclusions The microwave extraction method reported here is a rapid, low cost extraction method that lends itself to si- multaneous screening of multiple samples. The MAE method proved to reliable measure eight physicochemi- cally diverse organic compounds in river sediments. The sensitivity of the quantitation method and therefore de- tection limits may be improved by addition of a derivati- zation step or operation of the GC/MS in the single ion monitoring (SIM) mode. However, even without deri- vatization or SIM, this MAE method had similar per- formance to other accepted extraction methods. The method was successfully applied to the detection and measurement of several target compounds in two differ- ent set of sediment samples. 5. Acknowledgements This research was supported by the College of Science and Mathematics at Colorado State University – Pueblo. 6. References [1] D. W. Crawford, N. L. Bonnevie and R. J. Wenning, “Sources of Pollution and Sediment Contamination in Newark Bay, New Jersey,” Ecotoxicology and Environ- mental Safety, Vol. 30, No. 1, 1995, pp. 85-100. doi:10.1006/eesa.1995.1010 [2] B. Ngabe, T. F. Bidleman and G. I.Scott, “Polycyclic Aromatic Hydrocarbons in Storm Runoff from Urban and Coastal South Carolina,” Science of the Total Environ- ment, Vol. 255, No. 1-3, 2000, pp. 1-9. doi:10.1016/S0048-9697(00)00422-8 [3] P. C. Van Metre, A. J. Horowitz and B. J. Mahler, “Ef- fects of Hurricanes Katrina and Rita on the Chemistry of Bottom Sediments in Lake Pontchartrain, Louisiana, USA,” Environmental Science and Technology, Vol. 40, No. 22, 2006, pp. 6894-6902. doi:10.1021/es060933g [4] Department of Health and Human Services, Agency for Toxic Substances and Disease Registry Toxic FAQs for Cresols, 2008. [5] F. Stuer-Lauridsen, M. Birkved, L. P. Hansen, H.-C. Hol- ten Lutzhoft and B. Halling-Sorensen, “Environmental Risk Assessment of Human Pharmaceuticals in Denmark after Normal Therapeutic Use,” Chemosphere, Vol. 40, 2000, pp.783-793. doi:10.1016/S0045-6535(99)00453-1 [6] A. S. Stasinakis, G. Gatidou, D. Mamais, N. S. Thomaidis and T. D. Lekkas, “Occurence and Fate of Endocrine Dis- ruptors in Greek Sewage Treatment Plants,” Water Re- search, Vol. 42, No. 6-7, 2008, pp. 1796-1804. doi:10.1016/j.watres.2007.11.003 [7] P. L. Ferguson and B. J. Brownawell, “Analysis of Non- ylphenol and Nonylphenol Ethoxylates in Environmental Samples by Mixed-mode High-Performance Liquid Chromatography-Electrospray Mass Spectrometry,” Journal of Chromatography A, Vol. 938, No. 1-2, 2001, pp. 79-91. doi:10.1016/S0021-9673(01)01091-3 [8] M. R. Burkhardt, R. C. ReVello, S. G. Smith and S. D. Zaugg, “Pressurized Liquid Extraction Using Water/Iso- propanol Coupled with Solid-Phase Extraction Cleanup for Industrial and Anthropogenic Waste-Indicator Com- pounds in Sediment,” Analytica Chimica Acta, Vol. 534, No. 1, 2005, pp. 89-100. doi:10.1016/j.aca.2004.11.023 [9] S. Morales, P. Canosa, I. Rodriguez, E. Rubi and R. Cela, “Microwave Assisted Extraction Followed by Gas Chro- matography with Tandem Mass Spectrometry for the De- termination of Triclosan and Two Related Chlorophenols in Sludge and Sediments,” Journal of Chromatography A, Vol. 1082, No. 2, 2005, pp. 128-135. doi:10.1016/j.chroma.2005.05.059 [10] M. Robson, K. Spense and L. Beech, “Stream Quality in a Small Urbanized Catchment,” Science of the Total En- vironment, Vol. 357, No. 1-3, 2006, pp. 194-207. doi:10.1016/j.scitotenv.2005.03.016 [11] Y. Kitada, H. Kawahate, A. Suzuki and T. Oomori, “Dis- tribution of Pesticides and Bisphenol A in Sediments Col- lected from Rivers Adjacent to Coral Reefs,” Chemos- phere, Vol. 71, No. 11, 2008, pp. 2082-2090. doi:10.1016/j.chemosphere.2008.01.025 [12] P. Vazquez-Roig, R. Sergarra, C. Blasco, V. Andreu and Y. Pico, “Determination of Pharmaceuticals in Soils and Sediments by Pressurized Liquid Extraction and Liquid Chromatography Tandem Mass Spectrometry,” Journal of Chromatography A, Vol. 1217, No. 16, 2010, pp. 2471- 2483. doi:10.1016/j.chroma.2009.11.033 [13] USEPA PBT Profiler, “Assessing Chemicals in the Ab- sence of Data,” http://www.pbtprofiler.net/. [14] M. Vighi, “The Fugacity Approach as a Tool for the Pre- diction of Environmental Exposure of Organic Chemicals: Value, Limitations and Research Needs,” Science of the Total Environment, Vol. 134, No. 1, 1993, pp. 325-334. doi:10.1016/S0048-9697(05)80033-6 [15] USEPA, “Persistent, Bioaccumulative and Toxic Profiles Estimated for Organic Chemicals,” Environmental Sci- ence Center under contract of the Office of Pollution Prevention and Toxics, Washington, 2008. [16] C.-Y. Cheng, L.-L. Liu and W.-H. Ding, “Occurrence and Seasonal Variation of Alkylphenols in Marine Organisms from the Coast of Taiwan,” Chemosphere, Vol. 65, No. 11, 2006, pp. 2152-2159. doi:10.1016/j.chemosphere.2006.06.017 [17] W. B. Jensen, “The Origin of the Soxhlet Extractor,” Jour- nal of Chemical Education, Vol. 84, No. 12, 2007, pp. 1913-1914. doi:10.1021/ed084p1913 [18] C. S. Eskilsson and E. Bjorklund, “Analytical-Scale Mi- crowave-Assisted Extraction,” Journal of Chromatogra- Copyright © 2011 SciRes. IJG  T. J. BROWN ET AL. Copyright © 2011 SciRes. IJG 273 phy A, Vol. 902, No. 1, 2000, pp. 227-250. doi:10.1016/S0021-9673(00)00921-3 [19] G. Anitescu and L. L.Tavlarides, “Supercritical Extrac- tion of Contaminants from Soils and Sediments,” Journal of Supercritical Fluids, Vol. 38, No. 2, 2006, pp. 167-180. doi:10.1016/j.supflu.2006.03.024 [20] L. Dabrowski, H. Gierfielewicz-Mozajska, M. Biziuk, J. Gaca and J. Namiesnik, “Some Aspects of the Analysis of Environmental Pollutants in Sediments Using Pressurized Liquid Extraction and Gas Chromatography-Mass Spec- trometry,” Journal of Chromatography A, Vol. 957, No. 1, 2002, pp. 59-67. doi:10.1016/S0021-9673(02)00287-X [21] USEPA, SW-846 Method, 3546: Microwave Extraction, Washington D.C., 2007, p. 3546. [22] H. Budzinski, M. Letellier, P. Garrigues and K. Le Menack, “Optimisation of the Microwave-Assisted Ex- traction in Open Cell of Polycyclic Aromatic Hydrocar- bons from Soils and Sediments Study of Moisture Ef- fect,” Journal of Chromatography A, Vol. 837, No. 1-2, 1999, pp. 187-200. doi:10.1016/S0021-9673(99)00067-9 [23] M. Letellier, H. Budzinski, L. Charrier, S. Capes and A. M. Dorthe, “Optimization by Factorial Design of Focused Microwave Assisted Extraction of Polycyclic Aromatic Hydrocarbons from Marine Sediment,” Fresenius Jour- nal of Analytical Chemistry, Vol. 364, No. 3, 1999, pp. 228-237. doi:10.1007/s002160051329 [24] US CFR, “Guidelines Establishing Test Procedures for the Analysis of Pollutants (Appendix B to Part 136, Defi- nition and Procedures for the Determination of the Me- thod Detection Limit),” Title 40: Protection of Environ- ment, 1997. [25] E. E. Schulte and B. G. Hopkins, “Estimation of Organic Mater by Weight Loss-on-ignition,” In: F. R. Magdoff Ed., Soil Organic Mater: Analysis and Interpretation, Soil Science Society of America, Madison, 1996, pp. 21-31. [26] C. Diaz, L. Barrio and J. Catalan, “Characterization of Ternary Solvent Mixtures: The Methanol/Ethanol/Acetone Mixture,” Chemical Physics Letters, Vol. 371, No. 5-6, 2003, pp. 645-654. doi:10.1016/S0009-2614(03)00319-1 [27] J.-M. Kim, S.-M. Chang, I.-H. Kim, Y.-E. Kim, J.-H. Hwang, K.-S. Kim and W.-S. Kim, “Design of Optimal Solvent for Extraction of Bio-active Ingredients from Mulberry Leaves,” Biochemical Engineering Journal, Vol. 37, No. 3, 2007, pp. 271-278. doi:10.1016/j.bej.2007.05.006 [28] V. Lopez-Avila, R. Young and W. F. Beckert, “Micro- wave-Assisted Extraction of Organic Compounds from Standard Reference Soils and Sediments,” Analytical Chemistry, Vol. 66, No. 7, 1994, pp. 1097-1106. doi:10.1021/ac00079a027 [29] A. M. Saillenfait, J. P. Sabate and F. Gallissot, “Develop- mental Toxic Effects of Diisobutyl Phthalate, The Methyl-branced Analogue of Di-n-butyl Phthalate, Ad- ministered by Gavage to Rats,” Toxicology Letters, Vol. 165, No. 1, 2006, pp. 39-46. doi:10.1016/j.toxlet.2006.01.013 [30] K. Szyrwinska, A. Kolodziejczak, I. Rykowska, W. Wasiak and J. Lulek, “Derivatization and Gas Chromatog- raphy-Low-Resolution Mass Spectrometry of Bisphenol A,” Acta Chromatographica, Vol. 18, 2007, pp. 49-58. [31] Bureau of Chemical Safety HDFD, Determination of Bisphenol A in Liquid Infant Formula, 2008. [32] United Chemical Technology Inc., Bisphenol A Analysis in Water by GC/MS Using an ENVIRO-CLEAN®200 mg C18 Extraction Cartridge, 2008. [33] G. Gatidou, N. S. Thomaidis, A. S. Stasinakis and T. D. Lekkas, “Simultaneous Determination of the Endocrine Disrupting Compounds Nonylphenol, Nonylphenol Eth- oxylates, Triclosan and Bisphenol A in Wastewater and Sewage Sludge by Gas Chromatography-Mass Spec- trometry,” Journal of Chromatography A, Vol. 1138, No. 1-2, 2007, pp. 32- 41. doi:10.1016/j.chroma.2006.10.037 [34] Z. Xie, R. Edinghous, G. Floser, A. Caba and W. Ruck, “Occurrence and Distribution of Triclosan in the German Bight (North Sea),” Environmental Pollution, Vol. 156, No. 3, 2008, pp. 1190-1195. doi:10.1016/j.envpol.2008.04.008 [35] A. Dasgupta, ed., “Advances in Chromatographic Tech- niques for Therapeutic Drug Monitoring,” CRC Press Taylor and Francis Group, Boca Raton, 2010. [36] USEPA, “Method 1694: Pharmaceuticals and Personal Care Products in Water, Soil, Sediment, and Biosolids by HPLC/MS/MS,” Washington D.C., 2007.
|