Journal of Electromagnetic Analysis and Applications
Vol. 3 No. 12 (2011) , Article ID: 16523 , 5 pages DOI:10.4236/jemaa.2011.312082
Detection of Damage and Crack in Railhead by Using Eddy Current Testing
![]()
1Department of Electrical and Computer Engineering, Yokohama National University, Yokohama, Japan; 2Railway Technical Research Institute, Tokyo, Japan.
E-mail: d10sd194@ynu.ac.jp
Received September 22nd, 2011; revised October 20th, 2011; accepted November 13th, 2011.
Keywords: Nondestructive testing, Eddy current testing, Railhead, Crack
ABSTRACT
Eddy current testing is a nondestructive testing method, which is used to detect discontinuities and defects in conductive materials. Using this technique, two different types of artificial defects in a railhead were evaluated in order to analyze the relationship between different types of defects and eddy current signals, and to obtain data on the size of the rail surface defects and crack location. The actually used rail sample was also studied. Surface cracks and defects were clearly observed as amplitude and phase changes of detected signals. This study succeeds in quantitatively analyzing and discriminating the damage types.
1. Introduction
The constant increase of railway use and loading capacity, the contact between the wheels of the trains and the rail becomes more frequent, which increases the rail load. This makes the rail surface prone to fatigue and damage. If this surface damage is not addressed, it is likely to evolve into transverse cracking and horizontal cracks internally. In order to avoid accidents, human casualties, and loss of service, the early nondestructive safety evaluation of rail surface becomes very important.
Nondestructive testing is one of the most important testing methods. The following are some nondestructive testing methods applied in rail flaw detection. Although visual detection is the simplest and oldest method used in rail flaw detection, it is time consuming and subjective, which may lead to erroneous conclusions. Currently, the most popular rail testing methods are the ultrasonic and the eddy current testing methods [1-6]. Ultrasonic testing involves the reflection of acoustic waves to detect internal defects [7,8]. It is quick, extremely reliable, and reaches deep into the structure. However, the display of the ultrasonic testing results is not easy to understand; moreover, this method often requires treatment of the surface under examination.
Detection methods in rail testing have been recently developed. The ultrasonic testing of the weld of inside the rail head is advantages in accuracy and intuition, but it is incapable to detect the defect on the surface or near the surface [9]. The detection method which combines ultrasonic wave and eddy current tests has been also studied. This testing method uses multiple sensor probes and is able to detect the rail flaws inside and on the surface of the rail track. But, its analytical performance on the degree and type of flaws is unsatisfactory [10]. The high-speed flaw detection using eddy current can evaluate the location and extent of the rail damage. However, it has been difficult in intuitively displaying the different types of rail defects [11].
The research described in this paper aims to distinguish and quantitatively analyze the types of surface defects. In this study, we listed three representative rails for eddy current testing. One of the rails had a surface defect, and it was used to test the sensitivity of the amplitude of the eddy current signal to the hollow surface of the rail. The second rail had an artificial side crack, and it was used to test the sensitivity of the eddy current signal phase to the crack. Finally, the third rail was in actual use with a rugged surface and cracks.
2. System Configuration and Inspection Methods
An inspection system of rail flaws used in this study included a detection coil and an excitation coil, which formed an eddy current sensor probe shown in Figure 1.

Figure 1. Dimension of eddy current sensor probe.
Two eddy current sensor probes were used. One was for detecting the signal from a rail. It was positioned on a tested sample and scanned along the rail length. Another was for reference. It was positioned in air far from a sample. Two detection coils in each sensor probe were connected in a differential circuit, which was common technique in magnetic sensor. The controller (Kaisei Engineer Co., Ltd.) supplied an excitation current to a series connection of two excitation coils and amplified a signal from the detection coils.
The width of the railhead was 65 mm; thus, the detection coil in the sensor probe could not effectively evaluate the entire plane of the rail top. Therefore, the position of the sensor probe was varied in five different positions along the width as indicated in Figure 2. The scan speed of the sensor probe was 2.5 mm/s and the data acquisition rate was 8 point/s (3.2 point/mm). The frequency of the exciting magnetic field was 5 kHz.
3. Results and Discussion
3.1. Artificial Defect
Eddy current testing was performed on a railhead with a hollow surface (a concave shape). The artificial hollow was prepared using a grinding machine. The dimension of the depressed elliptic was 30 mm × 75 mm as shown in Figure 3(a). The thickness (depth) was 0.6 mm, which was maximum at around the center of the hollow. The sensor prove was scanned along the rail at the center position (0 mm in Figure 2).
Figures 3(b) and (c) show the amplitude and phase changes in the detection signal from this artificially damaged rail. It was found that the amplitude was significantly changed at the position of the hollow, but that the phase signal was almost constant. The phase should be also changed by the surface hollow, but its change ratio is small compared with the amplitude change.
During rail testing, due to the presence of the artificial flaw, the relative distance between the excitation coil and the eddy current loop generated at the sample surface at the artificial flaw increases. The eddy current intensity at the artificial hollow is reduced than that at the defect-free area. Therefore, at the location of the artificial flaw, the reverse magnetic field generated by the eddy current is reduced and the detected amplitude is smaller than that at the defect-free area. The phase of the detected signal does not directly related to the current intensity changes of eddy current, so the phase change is negligible. It is concluded that the amplitude of detected signal changes according to the uneven surface, whereas that the phase does not change in the testing system used in this study.
3.2. Artificial Cracks
This section describes the flaw detection of artificially prepared side cracks of different sizes. The locations and sizes of the simulated cracks are shown in Figure 4(a). These cracks were positioned at 5 mm below the sample surface. The surface was flat throughout the sample. These dimensions were 20 mm × 50mm, 40 mm × 50 mm, 60 mm × 50 mm. The thickness of the crack was constant at 2 mm. The sensor probe was scanned along
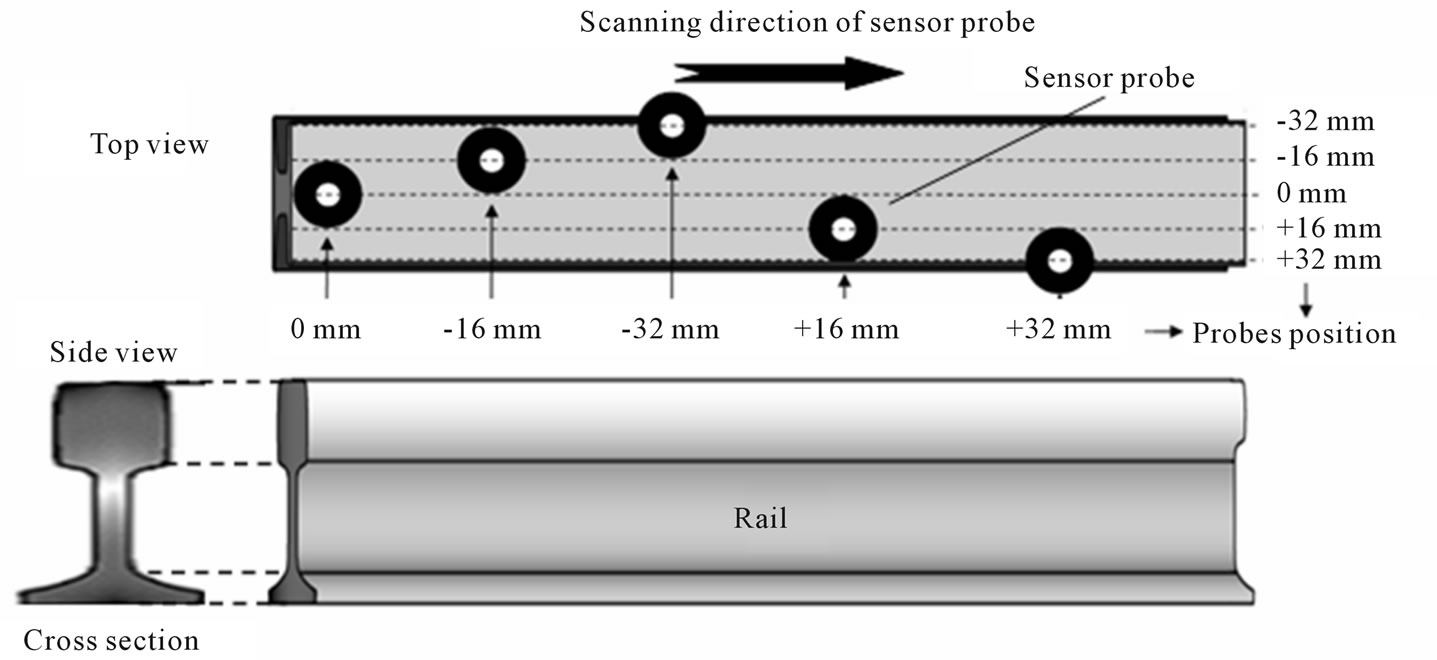
Figure 2. Position and scanning direction of eddy current sensor probe on railhead.
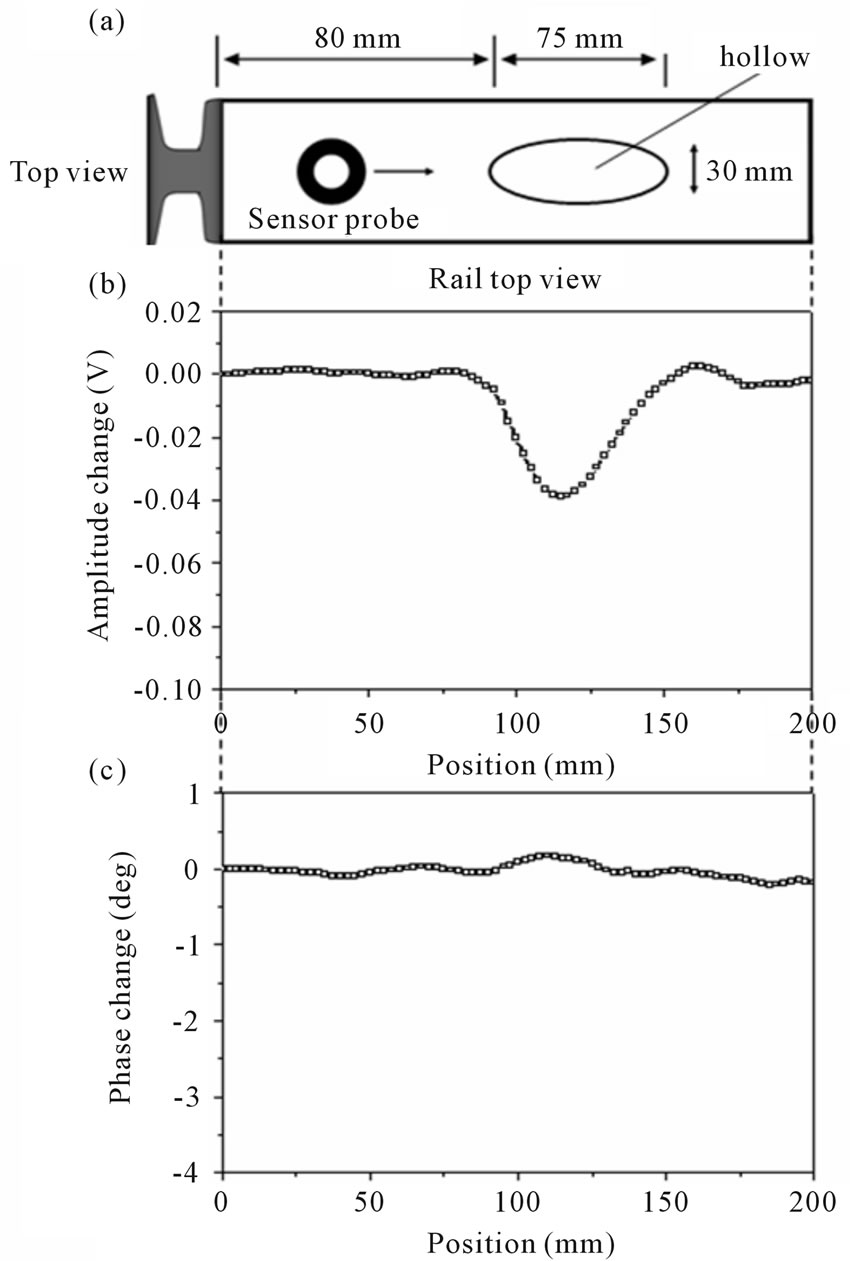
Figure 3. (a) Schematic of artificially hollowed railhead; (b) and (c) amplitude and phase changes of detection signal from the railhead.
the rail at the edge (+32 mm in Figure 2) of the railhead as shown in Figure 4(a).
Figures 4(b) and (c) show the amplitude and phase changes of detection signal for three simulated artificial side cracks, respectively. The amplitude change attributed to the existence of the artificial side crack was not significantly observed. The amplitude should be principally affected by the inside cracks, but its change ratio was small. As for the detected phase signal, there were significant changes in the range of 55 - 80 mm, 165 - 225 mm, and 288 - 346 mm. These positions agreed with the positions of side cracks.
Because of the existence of cracks, the eddy current cannot maintain its original circular path, but bypasses the cracks. When the conduction path of the eddy current in the presence of cracks is longer than that without the cracks, the increase of the bypass path results in the delay in phase of eddy current. It is found that the phase variations of the three cracks differ in position. This is due to the difference in crack sizes.
The eddy current density is mostly localized at the railhead surface due to the skin effect. A skin depth, δ depends on the exciting field frequency, f as described by the following formula:
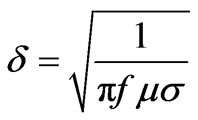 (1)
(1)
where μ and σ are permeability and conductivity of a sample, respectively. Using a relative permeability of μr = 500 and σ = 4.8 × 10⁶ S/m for cast steel material of rail, the skin depth is 0.145 mm at a frequency of 5 kHz. It is
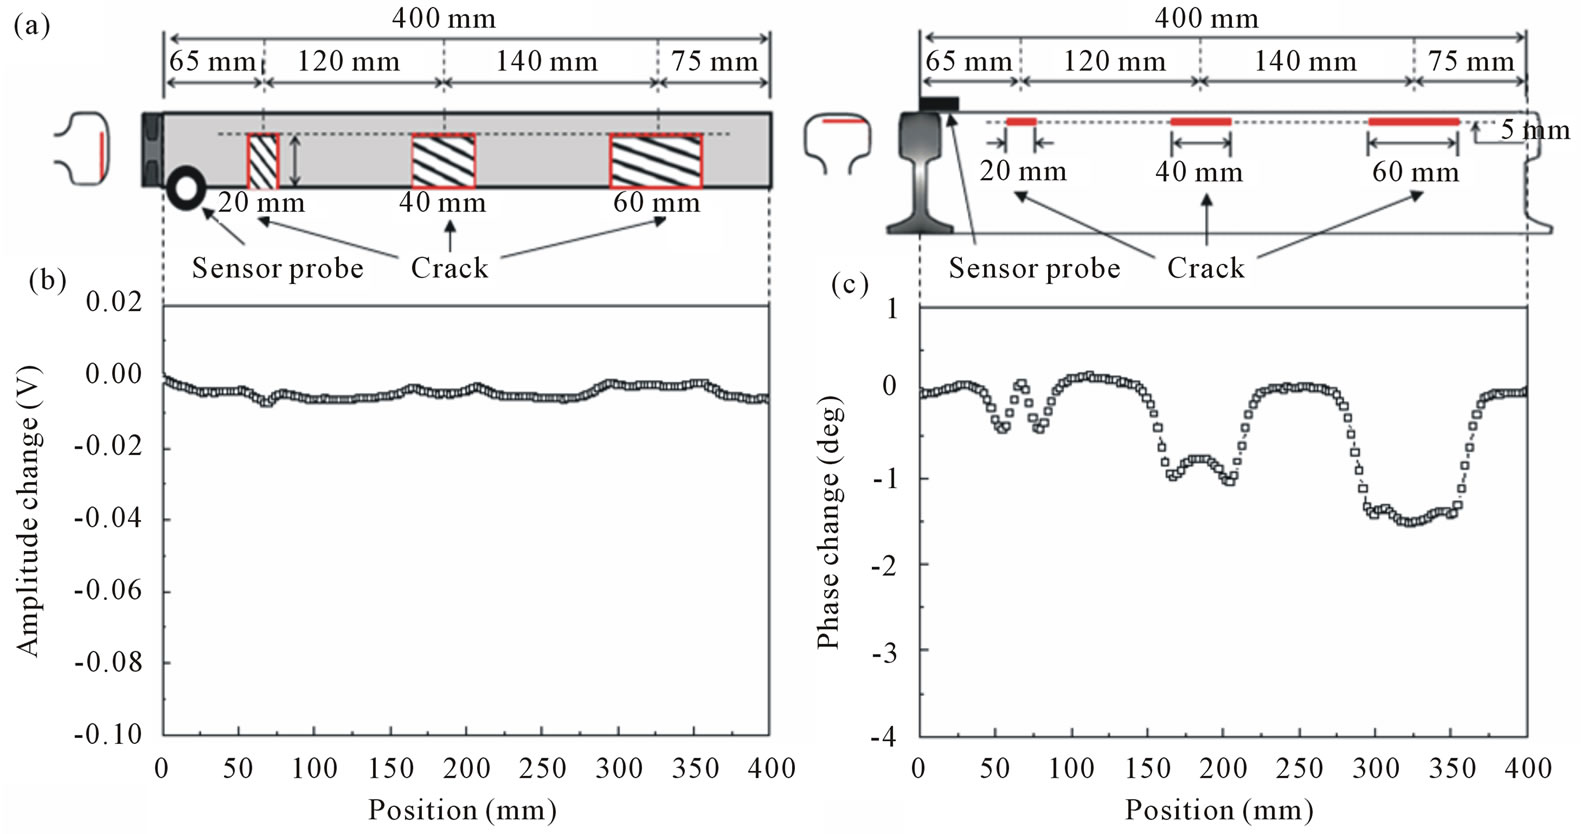
Figure 4. (a) Three artificially prepared side cracks of different sizes; (b) and (c) amplitude and phase changes of detected signal from the rail head.
considered that the cracks positioned at the 5 mm below the sample surface can not be detected because of this thin skin depth. If the sensor prove was scanned along the rail at its center line, the cracks can not be detect. But in case that the sensor prove was scanned along the rail edge (+32 mm in Figure 2), the magnetic field could reach the side cracks through the air space of the side of the sample rail. This magnetic field distribution in the air space was modulated by the existence of the side cracks, which resulted in the detection of the side cracks positioned at much deeper than the skin depth.
3.3. Surface Damage and Crack in Actually Used Rail
In this section, the eddy current testing of an actually used rail is discussed. The sample rail had a rugged surface with thin cracks as shown in Figure 5(a). In this test, five positions of the sensor probe were examined as indicated in Figure 2. The sensor probe was scanned at

Figure 5. (a) Photo and schematic images of actually used rail sample; (b) and (c) amplitudes and phase changes of detection signal of actual rail.
each line of +32, +16, 0 (center), −16 and −32 mm from the center line of the rail length direction.
Figures 5(b) and (c) show the testing results of the amplitude and phase changes for the actually used railhead sample, respectively. The railhead had cracks of 30 - 60 mm and a hollow on its surface. The hollow was approximately elliptic shape of 40 mm × 110 mm. The amplitude change was clearly observed at the position of the hollow in case of the probe scan at −16, 0 and +16 mm lines. When the sensor probe was scanned along the rail edge at +32 and −32 mm, the amplitude change did not change due to the existence of the follow. It was because that the follow was positioned at the railhead center with its width of about 40 mm. The maximum depth of the hollow was approximately 0.6 mm at the center and the amplitude change was maximum in the probe scan at the center of 0 mm. These detected signals of amplitude change were plotted as a function of the position of the railhead as shown in Figure 6. The shape and size of the hollow are realized by both 3D and 2D images of the figure.
Significant phase changes due to the surface cracks were observed for the probe scan at +16 and 0 mm, which agreed with the position of the cracks. The phase was slightly changed at +32 mm, but was not at −32 mm. This was because that the position of the cracks was localized at the edge (+32 mm side) of the railhead as shown by Figure 5(a). The phase change was observed at the position of 40 - 80 mm for the probe scan at −16 mm. It was presumably because of existence of cracks or damages which could not found by visual inspection or ultrasonic testing. As this phase change was not observed in other scan lines of +32, +16, 0 nor −32 mm, the unidentified crack or damage was considered to be localized around the line of −16 mm. The peak positions of phase changes for scan lines of +32, +16, 0 and −16 mm were plotted as shown by the left schematic in Figure 7.

Figure 6. 3D and 2D images of detected signals of amplitude change as a function of the position of the railhead surface.

Figure 7. Schematic and photographic images of a crack on the actually used rail sample.
The plotted points indicated by open circles in the figure are located on the actual crack identified by visual inspection (shown by the right photograph in the figure). It is significant to detect thin cracks on the railhead surface, because ultrasonic testing can not detect the surface cracks. The surface cracks may develop to inside of the rail.
From obtained results of the rails with artificial defects of two different types, it is found that analysis of changes in amplitude and phase of detected signals can accurately identify hollow and cracks of rail surface. This improvement develops the nondestructive testing of rail and other structural materials in identifying defects and distinguishing their types.
4. Conclusions
The eddy current testing of railhead was reported. The testing results of two railhead samples with artificially prepared defects indicated that the amplitude change induced to the detection coil corresponded to the surface roughness, and that the phase change corresponded to the surface cracks. Based on this characteristic, cracks and defects of an actually used rail sample were examined. It was found that the hollow and the surface cracks were clearly detected as the amplitude and phase changes, respectively. The detected signal indicated the existence of other defects, which were not identified by visual inspection or ultrasonic testing. This is significant development on eddy current testing, which is obtained from a large quantity of experiments and effective analytical methods in signal processing.
These experimental results will be examined by numerical analysis using finite element method. The optimization of sensor probes and measurement with various exiting frequency will be also expected to improve the detection sensitivity and accurately.
REFERENCES
- Z. Chen, N. Yusa and K. Miya, “Enhancements of Eddy Current Testing Techniques for Quantitative,” Nuclear Engineering and Design, Vol. 238, No. 7, 2008, pp. 1651- 1656. doi:10.1016/j.nucengdes.2007.12.015
- J. C. Aldrin and J. S. Knopp, “Crack Characterization Method with Invariance to Noise Features for Eddy Current Inspection of Fasterner Sites,” Journal of Nondestructive Evaluation, Vol. 25, No. 4, 2006, pp. 165-181. doi:10.1007/s10921-006-0014-5
- B. Helifa, A. Oulhadj, A. Benbelghit, I. K. Lefkaier, F. Boubenider and D. Boutassouna, “Detection and Measurement of Surface Cracks in Ferromagnetic Materials Using Eddy Current Testing,” NDT&E International, Vol. 39, 2006, pp. 384-390. doi:10.1016/j.ndteint.2005.11.004
- H. Yamada, T. Hasegawa, Y. Ishihara, T. Kiwa and K. Tsukada, “Difference in the Detection Limits of Flaws in the Depths of Multi-Layered and Continuous Aluminum Plates Using Low-Frequency Eddy Current Testing,” NDT & E International, Vol. 41, No. 2, 2008, pp. 108-111. doi:10.1016/j.ndteint.2007.08.004
- C. Mandache and J. H. V. Lefebvre, “Transient and Harmonic Eddy Currents: Lift-Off Point of Intersection,” NDT&E International, Vol. 39, No. 7, 2006, pp. 57-60. doi:10.1016/j.ndteint.2005.06.003
- D. Hur, M. Choi, D. Lee, S. Kim and J. Han, “A Case Study on Detection and Sizing of Defects in Steam Generator Tubes Using Eddy Current Testing,” Nuclear Engineering and Design, Vol. 240, 2010, pp. 204-208. doi:10.1016/j.nucengdes.2009.10.006
- K. Kimoto, S. Ueno and S. Hirose, “Image-Based Sizing of Surface-Breaking Cracks by SH-Wave Array Ultrasonic Testing,” Ultrasonics, Vol. 45, No. 1-4, 2006, pp. 152-164. doi:10.1016/j.ultras.2006.08.006
- R. Raisutis, R. Kazys, E. Zukauskas, L. Mazeika and A. Vladisauskas, “Application of Ultrasonic Guided Waves for Non-Destructive Testing of Defective CFRP Rods with Multiple Delaminations,” NDT&E International, Vol. 43, No. 5, 2010, pp. 416-424. doi:10.1016/j.ndteint.2010.04.001
- E. Jasiūniene and E. Ukauskas, “The Ultrasonic Wave Interaction with Porosity Defects in Welded Rail Head,” Ultrasound, Vol. 65, No. 1, 2010, pp. 12-18.
- H. M. Thomas and T. Heckel, “Advantage of a Combined Ultrasonic and Eddy Current Examination for Railway Inspection Trains,” European Conference on Non-Destructive Testing, Berlin, 25-29 September 2006, We.4.5.3.
- R. Pohl, A. Erhard, H. J. Montag, H. M. Thomas and H. Wustenberg, “NDT Techniques for Railroad Wheel and Gauge Corner Inspection,” NDT&E International, Vol. 37, No. 2, 2004, pp. 89-94. doi:10.1016/j.ndteint.2003.06.001