Int'l J. of Communications, Network and System Sciences
Vol. 5 No. 3 (2012) , Article ID: 18003 , 14 pages DOI:10.4236/ijcns.2012.53024
Improved Radio Network Dimensioning for Real-Time Polling Service on IEEE 802.16 Wireless Networks with QoS Consideration
Faculty of Engineering, Multimedia University, Cyberjaya, Malaysia
Email: thiawseng@gmail.com, {tcchuah, yftan}@mmu.edu.my
Received December 27, 2011; revised January 28, 2012; accepted February 29, 2012
Keywords: IEEE 802.16; Dimensioning; Analytical Model; Real Time Polling Service; QoS
ABSTRACT
Recently, applications of real-time polling service (rtPS) in IEEE 802.16 wireless networks have gained considerable popularity. These applications generate large amounts of real time traffic in the network and thus maintaining the quality of service (QoS) such as packet delay requirement in rtPS dominant networks is critical. Existing dimensioning methodology does not consider QoS parameters of rtPS in network dimensioning. Moreover, exhaustive and time-consuming simulations are required to evaluate the performance and QoS of rtPS. To overcome this problem, we propose an improved radio network dimensioning framework which considers QoS parameters of rtPS in network dimensioning. In this framework, an analytical model is developed to evaluate the capacity and performance of rtPS in IEEE 802.16 wireless networks. The proposed framework provides a fast and accurate means of finding the trade-off between system load and packet delay, thus providing network operators with an analytical tool that jointly considers coverage, capacity and QoS requirements for obtaining the minimum number of sites required. The accuracy of the proposed model is validated through simulations.
1. Introduction
The IEEE 802.16 family of wireless broadband standards has gained considerable attention from the telecommunication industry recently due to its capability of providing mobile broadband services and delivering real time content with quality of service (QoS) provisioning. The IEEE 802.16 standard defines five types of services [1]: Unsolicited Grant Service (UGS), Real-Time Polling Service (rtPS), Extended Real-time Polling Service (ertPS), Non-Real-Time Polling Service (nrtPS), and Best Effort (BE) service. Examples of rtPS such as mobile IPTV [2] and online gaming [3] have gained considerable popularity, particularly after the launch of IEEE 802.16-compliant smart phones. These applications generate large amounts of real time network traffic. Successful delivery of mobile IPTV and online gaming content over IEEE 802.16 networks depends on the network’s ability to schedule real time traffic with quality assurance [3,4]. Without quality assurance, distortion occurs and impacts user experience.
In a practical IEEE 802.16 network, QoS parameters such as packet delay and guaranteed throughput are handled through various scheduling schemes, e.g., the largest weighted delay first and the strict priority scheduling [5]. In these schemes, packets from rtPS have absolute priority to be scheduled first and thus the packet delay requirement is always guaranteed. As a result, QoS parameters such as packet delay of rtPS are usually not considered in network dimensioning exercise because they are deemed properly taken care of by the scheduler. In practice, no QoS parameter for rtPS is considered in network dimensioning and the system capacity of an IEEE 802.16 network is dimensioned based on the famous Shannon theorem [6]. According to this theorem, the capacity of a site is calculated based on the total packet throughput of the five types of services offered as a function of the average signal-to-interference-and-noise ratio (SINR).
Scheduling schemes such as largest weighted delay first and strict priority scheduling requires minimal queue size and does not guarantee packet delay performance in rtPS dominant networks if no QoS is considered in dimensioning [7]. When rtPS becomes the dominant service, the packet delay requirement of rtPS can no longer be fulfilled by the available scheduling schemes if the existing dimensioning approach, without efficient connection admission control (CAC) is used to dimension an rtPS dominant network [7]. Thus the key concern in resource allocation for rtPS traffic is fulfilment of the delay requirement while maintaining the required capacity. To date, the impact of QoS parameters on site capacity has not been quantified and no QoS parameters for rtPS are considered in network dimensioning. Therefore, network dimensioning for acceptable packet delay while achieving the highest data throughput is a challenging and important issue. An improved dimensioning methodology which incorporates the delay requirement of rtPS into network dimensioning is desirable.
In order to consider the delay requirement of rtPS in network dimensioning, a model which can be used to derive packet delays analytically for different SINRs is required. Packet delays are typically obtained through network simulations [8], a process which is time consuming and renders network dimensioning a challenging task. In the current work, we overcome this problem by introducing an analytical approach to obtain the packet delay information. There have been several studies which derive system capacity analytically [9,10]. In [9], the throughput and packet-access-delay performance of BE services are analyzed using a simple fixed-point method without considering the SINR. In [10], radio resource management is studied analytically where bandwidth adaptation and connection admission control are analyzed for all types of traffic. However, the works in [9,10] do not consider rtPS applications. To the best of our knowledge, no analytical study of network capacity planning with significant rtPS traffic has been carried out.
To fill this gap, in this paper, we propose an effective dimensioning framework for rtPS traffic in IEEE 802.16 networks such that the throughput requirement is satisfied while achieving a good compromise between resource utilization and delivery delay. In particular, an analytical model which complements the dimensioning process, is developed to investigate some important performance measures such as packet delay and average SINR of a cell. Extensive simulations have been carried out to verify the proposed analytical model. The contributions of this paper are summarized as follows: 1) An analytical model which considers AMC and network SINR is developed to evaluate packet delays at different levels of cell load. A matrix geometric method is adopted to obtain some performance measures analytically; 2) The performance of IEEE 802.16 networks with rtPS as the dominant service is studied using the model developed; 3) An effective dimensioning framework, which incorporates QoS requirements such as packet delay and minimum throughput required, is proposed. The proposed network dimensioning framework gives the minimum number of sites required as the output by jointly considering coverage, capacity and QoS requirements. The current work provides network operators with an analytical means for obtaining the minimum number of sites while meeting the required network performance. It also provides insights into the maximum admission levels for rtPS to achieve maximum capacity in a cell while fulfilling the delay requirement of rtPS.
This paper is organized as follows. Section 2 describes the proposed dimensioning framework. The analytical model which is developed to obtain packet delay information is also described. This is followed by the derivation of performance metrics to be used. In Section 3, simulation results are presented to validate the proposed dimensioning framework and the accuracy of the analytical model. The impact of different parameters towards network performance is also studied. We conclude the paper in Section 4.
2. The Proposed Analytical Framework
In this paper, we propose a dimensioning framework which jointly considers coverage, capacity and QoS requirements to determine the minimum number of sites needed for a network. A flowchart for the proposed framework is shown in Figure 1. QoS requirements such as packet delay and minimum throughput requirement are considered in the framework to derive network capacity and coverage, respectively. As shown in Figure 1, an analytical model is developed to characterize packet delivery across wireless channels; queuing analysis is then carried out to obtain packet delay and cell resource utilization information. The packet delay information obtained will be used as one of the inputs to derive network capacity. On the other hand, the cell resource utilization, which is defined as the fraction of cell resource occupied for data transmission, will be used for interfereence analysis. Interference analysis is performed to derive the interference margin; the latter will then be used to derive network coverage.
As shown in Figure 1, the dimensioning process starts by feeding network traffic and SINR requirement to the analytical model, followed by queuing analysis to obtain packet delay information. The packet arrival process and service time are modelled as a continuous time Markov chain (CTMC) process. To consider AMC in the proposed analytical model, packet transmission over wireless channels is modelled using a finite state Markov channel (FSMC) model. With the FSMC model, the CTMC process is expanded into multiple layers with different service rates based on the channel conditions. Through analysis using a matrix geometric method, performance measures such as packet delay and network utilization can be derived analytically. Having obtained such information, the network capacity can be derived. The CTMC process and the FSMC model as well as analysis of performance measures will be elaborated in
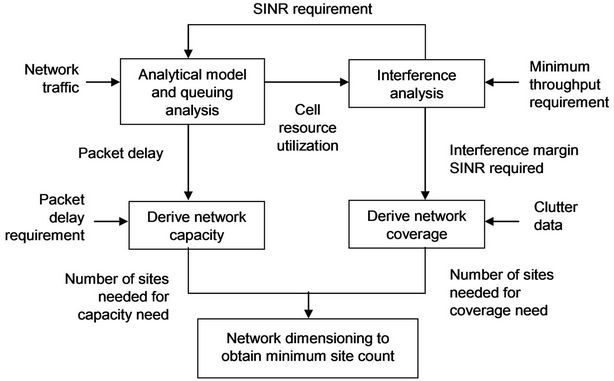
Figure 1. Proposed dimensioning methodology for IEEE 802.16 networks.
Sections A to D.
On the other hand, interference analysis is carried out to determine the interference margin and SINR required to achieve the minimum bit rate needed at the cell border. The interference margin is calculated based on the cell resource utilization obtained from the analytical model. Typically a higher interference margin is required for systems with higher utilization and vice versa. To fulfill the required minimum bit rate at the cell border, the SINR required by a specific modulation scheme is determined. The SINR required at the cell border and the interference margin obtained through interference analysis are used for coverage dimensioning to determine the number of sites needed for the desired coverage area. Clutter data such as building penetration loss and fading loss is needed to calculate the total radio propagation loss for coverage dimensioning. With the knowledge of the interference margin and the required SINR at the cell border, coverage dimensioning can be carried out to determine the number of sites needed for network coverage. Details of the interference analysis will be described in Sections E to F. Finally, results from both coverage and capacity dimensioning are analyzed together in Section G to compute the minimum site count which fulfils both the capacity and coverage requirements.
2.1. Latency Characterization over the Wireless Channel
In the IEEE 802.16 standard, AMC is adopted to optimize power and spectral efficiency according to the radio channel conditions. In this paper, a FSMC [10] is used to model the time-varying wireless channel of each subscriber station (SS). In the FSMC channel model, the discrete AMC architecture defined in the IEEE 802.16 standard is considered, where the SINR required is categorized into eight disjoint regions representing different deployable coding and modulation schemes as shown in Table 1 (denoted as ). Each region is designated by a state number n. The base station selects a proper modulation and coding scheme for each SS, according to the received SINR, with each modulation and coding scheme carrying different bits per tone, denoted as In.
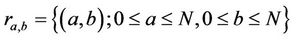
Based on these eight disjoint regions, an 8-state Markov channel model is formulated as shown in Figure 2. State 0 implies no transmission, which happens when the channel condition is very poor. In this case, the corresponding queue should not transmit any data in order to conserve resources.
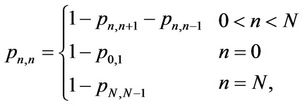
The probability of staying at state n, denoted as , is given by [10]:
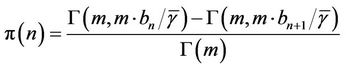 (1)
(1)
where  is the average SINR, m is a Nakagami fading parameter,
  is the Gamma function, and
  is the complementary incomplete Gamma function. The channel exhibits Rayleigh fading when m = 1. For a slow fading channel, the state transition matrix for the FSMC, P can be expressed as
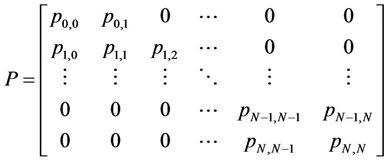 (2)
(2)
The transition probability from state n to k, denoted as , is obtained as follows
 (3)
(3)
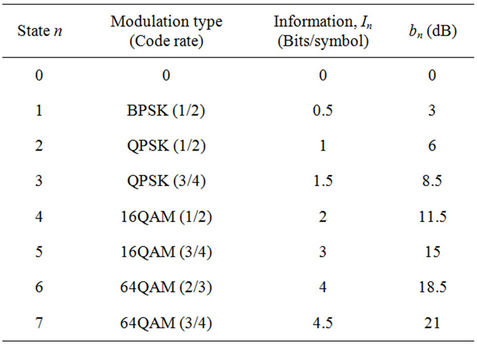
Table 1. State boundaries and the corresponding AMC level in the IEEE 802.16 wireless network.
 (4)
(4)
 (5)
(5)
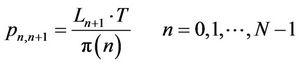
where T is the duration of a MAC frame, and Ln is the level crossing rate at bn corresponding to state n, which can be estimated as
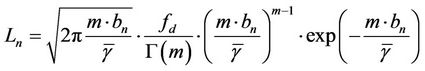 (6)
(6)
where  is the Doppler frequency.
In formulating the analytical model to study packet delays, we consider a single cell with a base station serving multiple connections with different services sharing a common scheduler over the air interface, as depicted in Figure 3. For each type of service, a separate queue is used for packet buffering before the scheduler. In practice, different scheduling approaches are used for different services. For example, UGS, ertPS and rtPS are scheduled based on strict priority scheduling [5]. The studies of UGS and ertPS have been reported in the literature and thus will not be pursued further in this paper. For nrtPS and BE traffic, since no delay requirement is imposed on both services, their performance will not be analyzed in this paper. Therefore, only transmission of rtPS over wireless channels is studied in this work. The scheduling of rtPS over wireless channels is performed adaptively on each frame where different transmission rates are used according to the channel quality.
In Figure 3,  denotes the average traffic arrival rate which is modelled as a Poisson process;
  denotes the average service rate over the wireless channel with state n, where
  and eight states (N = 8) are considered in this study. The state is selected by the scheduler based on the channel condition and is evaluated every transmission time interval (TTI). The service rate is negative exponentially distributed with
 , where
  is the maximum bit rate transmitted on the available bandwidth using the modulation scheme at state n.
  signifies the transition rate from state a to b and the state space is defined as
 .
.
2.2. System Modelling for Packet Transmission
The IEEE 802.16 scheduler which schedules rtPS traffic with strict priority scheduling scheme [5] can be described by a CTMC process. To consider AMC for packet transmission over wireless channels, the CTMC process is expanded using the FSMC model developed in Section
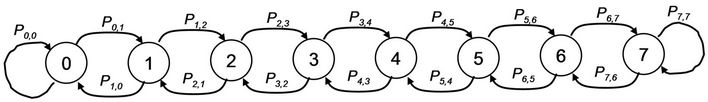
Figure 2. Finite state Markov channel model for the IEEE 802.16 wireless network.
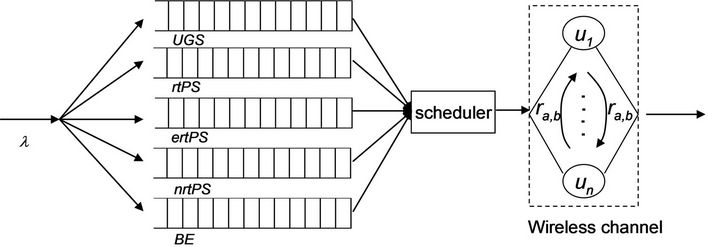
Figure 3. Downlink packet scheduler.
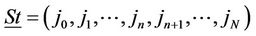
A. We define the FSMC state vector  as
as
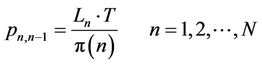
The CTMC process can be modelled by a two-dimensional state transition diagram as shown in Figure 4, which has proven to be useful in analyzing data performance [11] . We define the generator of the Markov chain for the system as Q. The state space for Q is 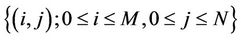 where M is the maximum buffer size for data packets. Each state is denoted by (i, j) where i is the index of the data packet in the system (including those in service and the queue buffer) and j is the index of channel state.
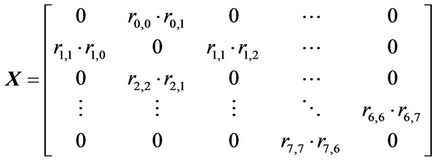
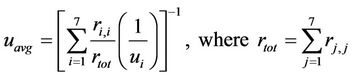
The data source is modelled as a Poisson process with a negative exponential distribution and a mean arrival rate of l. Assuming users are distributed homogeneously within a cell, the probability of users being scheduled in the specific state-n is denoted by pn,n. Thus, the arrival rate to each state is given by pn,nl. The service rate of packets is modelled as an 8-state Markov channel model described previously. The service rate for each state is determined by the number of bits transmitted on each orthogonal frequency division multiplexing (OFDM) symbol as given in Table 1. The arrival rate, L and the service rate of data, S can be formulated as in Equation (7). The rtPS traffic in the queue is scheduled by following a Markov modulated Poisson process (MMPP) and the transition probability between different channel states is specified by the infinitesimal generator matrix X, as given in Equation (7). The average service rate mavg is given in Equation (8).
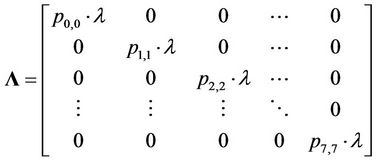
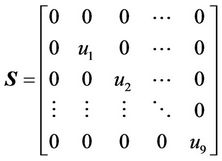 (7)
(7)
 (8)
(8)
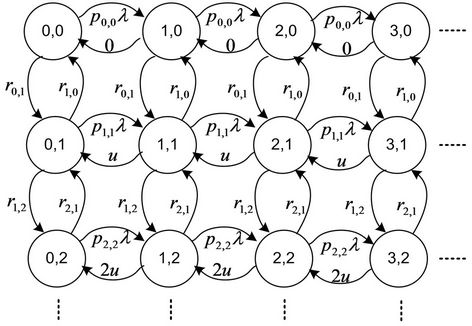
Figure 4. State transition diagram for rtPS in the IEEE 802.16 wireless network.
From the channel model, the transition probability between states, pn,k is obtained for different SINR values, bn. Thus, these transition probabilities are mapped to the model where the transition rate between states for each TTI,  is identical to pn,k.
According to Neut’s theory [12] , the transition matrix of this Markov chain, Q is generalized as
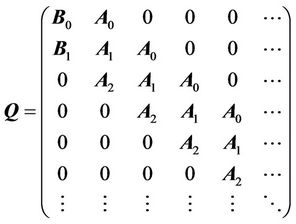 (9)
(9)
Each element of B0, B1, A0, A1, A2 has dimension N ´ N, where A0 and A2 are equal to L and S, respectively, while A1 is given by
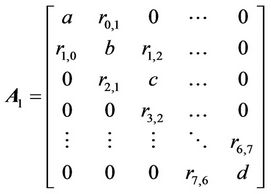
where
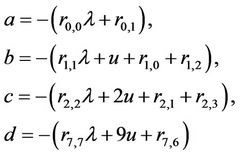 (10)
(10)
The probability of each state is expressed as q. To obtain the state probabilities we need to solve the following
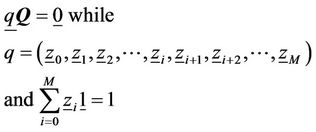 (11)
(11)
where  is a vector of probabilities of level i in the state transition diagram and
 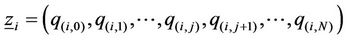 . According to Neut’s theory [12] and the algorithm in [13] the steady state probability of a CTMC can be solved by exploiting matrix geometric properties. The probability of each state
  can be obtained through the matrix quadratic equation as given in the Appendix.
2.3. Analysis of Packet Delivery Delay
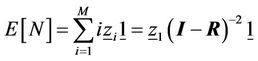
Once the probability of each state  is known, the average number of data packets in service
  can be obtained as
 (12)
(12)
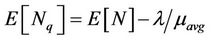
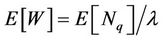
The average number of data packets in queue,  and the mean packet delay,
  are given by Equations (12) and (13), respectively.
 (13)
(13)
 (14)
(14)
2.4. Analysis of System Capacity with rtPS
To study the system throughput of the IEEE 802.16 wireless network, we consider an OFDM physical layer whose system capacity depends on the available bandwidth BW and the total number of sub-carriers NFFT. To calculate the system capacity, we first define the duration of an OFDM symbol, tOFDM which is given as [14]
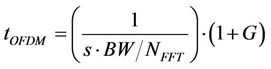 (15)
(15)
where s is the sampling factor, while G denotes the ratio between the sampling factor and the cyclic prefix length. With a channel bandwidth of 5 MHz, there are 256 subcarriers (NFFT = 256) but only 192 subcarriers (NFFT, used = 192) are used for data transmission. With a sampling factor of 144/125 and a cyclic prefix ratio, G, of 1/4, the OFDM symbol duration, tOFDM is 55.5 ms. This gives the number of raw symbols per frame  for each frame duration,
  , as
, as . A frame duration of 20 ms carries 360 symbols which include both control and data information.
To calculate spectral efficiency, only data-carrying symbols are considered and the symbols used for control bits in the frame,  need to be subtracted. Each downlink frame consists of data channels and control channels. The control channels include the preamble, the Frame Control Header, the downlink map (DL-MAP) and uplink map (UL-MAP) massages. For binary phase shift keying (BPSK) modulation, 15 symbols are used for the control channels, leaving 345 symbols for the downlink data burst. Thus, the spectral efficiency,
  for state n is given by Equation (16), where
  denotes the number of bits per symbol as shown in Table 1.
 (16)
(16)
The spectral efficiencies of different states  are summarized in Table 2.
The overall system throughput is contributed by all SSs connected to the base station. Each SS has a different channel state due to different distances from the base station. The probability of each SS staying on the respective channel states is given in Equation (1). This probability is a function of the average SINR in the network. Thus, the maximum capacity of the IEEE 802.16 network with an average SINR of  for a given bandwidth of BW can be obtained as
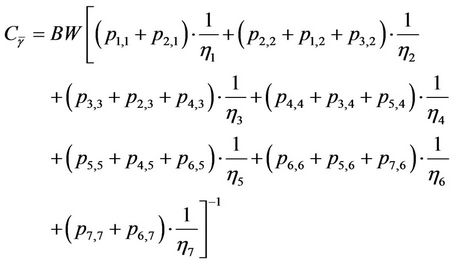 (17)
(17)
where  are the transition probabilities discussed previously.
The load of a cell or simply cell load is defined as the fraction of maximum capacity of a cell used for data transmission. In this paper, we define the normalized cell load l for the system, calculated based on the number of users in the cell,  and the average bit rate for each user,
  as follows
 (18)
(18)
Thus, the cell load is directly impacted by the number of users in the system. More users in the system lead to a higher cell load thus yielding a higher delay due to more packets being queued in the buffer. It was previously shown in Equation (14) that packet delay is a function of packet arrival.
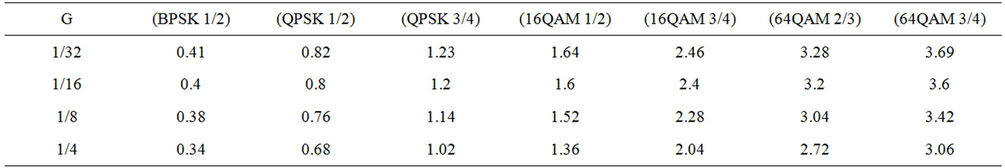
Table 2. Spectral efficiencies of different coding and modulation schemes.
For rtPS like video calls, the system capacity needs to be traded off to fulfill the packet delay requirement. The study in [15] shows that the maximum tolerable delay,  for a video call with 380 kbps variable bit rate (VBR) traffic is 50 ms. Thus, admission control needs to be implemented to limit the average throughput in the cell in order to control the queuing delay. If a packet is not transmitted after the maximum delay, it will be discarded from the queue. The admission threshold for rtPS,
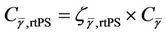
  needs to be set on the cell load such that the packet delivery delay always fulfils the maximum delay requirement, as given by
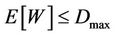 . In a cell with
 , the maximum cell capacity for rtPS,
  is given by Equation (18)
 (19)
(19)
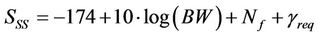
2.5. Analysis of Minimum Bit-Rate at the Cell Border
It is always the interest of network operators to fulfil certain coverage probability within a cell area while maintaining the minimum bit rate requirement at the cell border. The main goal of our proposed methodology for coverage planning is to determine the cell radius which can satisfy a minimum bit rate,  at the cell border with an SINR at the cell border,
  greater than or equal to a target threshold for an assigned percentage of time. The minimum downlink bit rate at the cell border,
  is given by
 (20)
(20)
where BW is the total available downlink bandwidth and  is the spectral efficiency achievable at state n by using a specific modulation scheme with the required SINR,
  given in Table 1. The modulation scheme used at the cell border requires a minimum SINR of
  to stay in state n.
Thus, to dimension the cell coverage with a specific minimum bit rate at the cell border, the minimum SINR requirement needed for a specific modulation,  is considered in the calculation of receiver’s sensitivity of the SS,
  as given by
 (21)
(21)
where  is the noise figure of the SS. The receiver’s sensitivity will be used in the link budget calculation to determine the cell range of a base station.
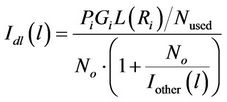
The SINR on the mth tone for base station a, generated for a normalized downlink cell load of l is given by [16]
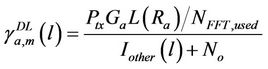 (22)
(22)
where  is the transmit power from the serving base station, Ga is the transmitter antenna gain while
  is the attenuation between base station a and the user located at distance
 .
.  is the average per-tone interference power generated from users in other cells with an average cell load of l.
  is the noise power per-tone. Assuming the sub-channels are assigned randomly to the users, the average SINR in the cell,
with a cell load of l, is given as , with an average of K tone utilized. Thus, in order to sustain a minimum bit rate
  at the cell border, the average SINR in the cell,
  with the cell load of l, should be greater than or equal to
 .
.
2.6. Analysis of Coverage Impact Due to Intercell Interference
Due to spatial reuse of frequency in neighbouring cells, most multi-cell wireless systems are exposed to inter cell interference (ICI). ICI appears in the form of “collisions” when the schedulers of neighbouring cells assign the same resource to concurrent transmissions that interfere with each other. The most commonly employed frequency collision avoidance method is static ICI coordination with frequency reuse-n, where each cell is assigned one of the available n frequency bands. However, this solution is bandwidth inefficient and it can become a bottleneck to achieve high data rates as only a fraction of the bandwidth is available in one cell. On the other hand, with frequency reuse of one, all base stations use the same set of frequencies for data transmission. The main drawback of this method is ICI. However, frequency reuse of one can be considered if the loss in cell capacity due to ICI is less than that due to bandwidth wastage by frequency reuse of n. For improved bandwidth efficiency, frequency reuse of one is still preferable in IEEE 802.16 wireless networks. There has been considerable attention from researchers to study interference coordination methods to address the interference issues [17] .
In this section, frequency reuse of one is considered and a generic method to include ICI in coverage studies is discussed. Assume that users are distributed homogeneously in the network, the average per-tone interference power from K neighbouring cells,  towards the serving cell-a is proportional to the number of users in the network and is given as
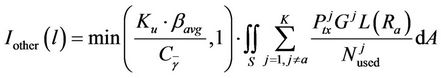 (23)
(23)
where the probability of a neighbouring base station occupying the same tone index as the desired user, i.e., the probability of collision or hit, is given as
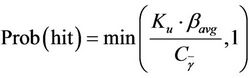 , where
  is the number of users in the cell. The hit probability increases with the number of users and becomes unity once all frequency tones are occupied. The interference level is directly influenced by the number of users
  and the subscriber average bit rate
 .
.
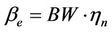
With an increase of cell load level in the network, the downlink interference level will increase accordingly and should be considered in coverage planning. For this reason, a downlink interference margin , which depends on the total downlink power from the serving cell,
  and the distance of the SS to the serving base station,
  is introduced in link budget calculation. As coverage needs to be maintained for SSs located at the cell edge, the interference margin at the cell edge has to be evaluated and included in coverage dimensioning, as given by
 (24)
(24)
In a loaded network, the interference margin,  is included in link budget calculation to obtain the cell coverage. With link budget calculation, the maximum downlink path loss
  is obtained as
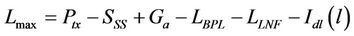 (25)
(25)
where  is the base station output power,
  is the sensitivity of the SS’s receiver,
  is the antenna gain of the base station,
  is the building penetration loss while
  is the log-normal fading margin .
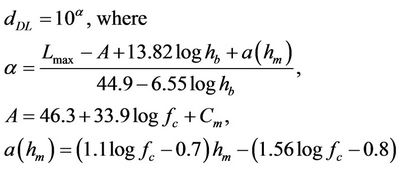
With the maximum path loss , the cell range
  can be obtained using an empirical model such as the Okumura-Hata prediction model or the Cost-231 Hata model, as given by
 (26)
(26)
where  is the carrier frequency in kHz,
  and
and  denote the heights of the base station and mobile station antenna, respectively, and
  is the clutter attenuation factor. The coverage area for a 3-sector site,
  with a cell load of l is given by
 (27)
(27)
2.7. Dimensioning Based on Coverage and Capacity Requirement
In the proposed dimensioning methodology shown in Figure 1, two sets of calculations with varying loads per cell are performed. In one, only the requirement on cell border bit rate is taken into consideration to conduct coverage dimensioning. In the other, the QoS requirement on packet delay is considered to perform capacity dimensioning. QoS requirement is considered in the dimensioning process and discussed in Sections A to C. Capacity dimensioning is studied in Section D while coverage dimensioning is discussed in Section F. The number of sites needed for capacity,  can be calculated with knowledge of the total number of subscribers,
  and the traffic per subscriber,
  , while the number of sites needed for coverage,
  can be calculated with knowledge of the total required coverage area,
  and clutter type.
  and
and  are given respectively as
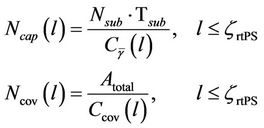 (28)
(28)
With the number of sites needed for coverage and capacity derived individually for every level of cell load l, the freedom to find the minimum number of sites needed for the network can be obtained. As illustrated in Figure 5, a higher cell load requires more sites to fulfill the coverage requirement. On the other hand, a lower cell load will lead to more sites to meet the capacity requirement. To fulfill the minimum packet delay requirement, the system throughput needs to be compromised. The tradeoff between delay and throughput is scaled through a system admission threshold as given in Equation (18). This yields a higher number of sites in order to satisfy the delay requirement, as shown in Figure 5.
 (29)
(29)
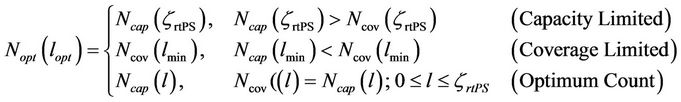
The optimum site count,  is reached when the site count needed for coverage matches the site count needed for capacity with an optimum load of
 , as given by Equation (29). On the other hand, in a capacity limited network, the cell is loaded up to the admission threshold,
  while the coverage requirement can still be fulfilled. In a coverage limited network, the site can be built as large as possible while maintaining a minimum desired cell load,
  due to the very low cell capacity required. The optimal number of sites obtained from the proposed dimensioning method gives the lowest number of sites needed for minimal capital investment on the network.
3. Numerical Results
We evaluate the accuracy of the proposed analytical model through extensive computer simulations and illustrate the impact of two parameters, namely cell load and SINR, on the performance metrics in terms of 1) packet delivery delay; 2) cell throughput; 3) number of rtPS users supported; 4) cell range and 5) coverage probability. A simulator is used to emulate packet scheduling for different users under different channel conditions based on their distances from the base station. A Poisson model is adopted to model the packet arrival process. The SINR for different states in the IEEE 802.16 network as shown in Table 1 are adopted. Similar to [15], a video call with 380 kbps VBR traffic having a maximum delay of 50 ms is studied. If a packet is not transmitted after the maximum delay, it is discarded from the queue. A single queue scheduler is used to schedule packets of different modulation schemes over the air interface. A cluster of seven 20 m-height base stations equipped with omni directional antennas with an antenna gain of 18 dBi is considered. All base stations are coordinated in hexagonal grids. A bandwidth of 5 MHz (NFFT = 192) over a carrier with frequency of 2.3 GHz in an urban environment is chosen for the study. We assume a typical urban clutter with pedestrians moving at 3 km/h, yielding a Doppler shift of fd = 5 Hz. A Rayleigh fading model is assumed and the cell range is calculated using the Okumura-Hata propagation model. The scheduler schedules frames over the air interface every 10 ms TTI.
Based on the analytical model, Equations (1)-(14) are solved numerically to obtain the packet delay information as a function of load for different average SINRs in the network. The complexity of the analytical model depends on the number of iterations needed to approximate R, where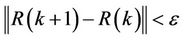 . The number of iterations needed for
 ,
,  and
and  are 1180, 1840 and 2000, respectively. The number of iterations is still fairly low to achieve a good approximation of R. The complexity is greatly reduced compared to the simulation approach in obtaining the packet delay information. Analytical results are then compared with those obtained from simulations for a number of scenarios with different sets of parameters.
Figure 6 shows the impact of cell load on the packet delivery delay. We solve Equations (1)-(14) for a typical set of parameters ( ,
,  ,
, ) to derive the packet delivery delay value. As shown in Figure 6 the results obtained analytically are found to be similar to
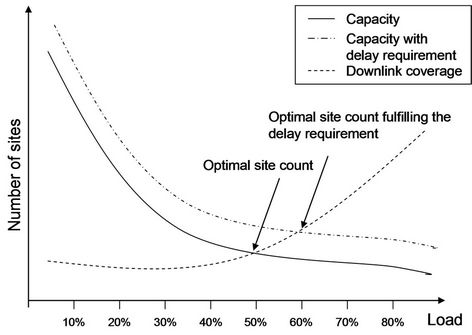
Figure 5. The number of sites required for coverage and capacity as a function of cell load.
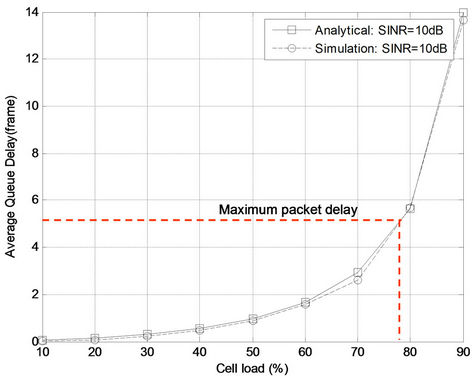
Figure 6. Packet delay as a function of cell load at SINR = 10 dB.
those obtained from simulations. It is observed that packet delay increases exponentially with an increase in cell load. With a maximum delay of 50 ms, only up to five frames are queued in the buffer to fulfil the delay requirement. As shown in Figure 6, the delay requirement of rtPS is no longer fulfilled when the cell load exceeds 78%. As a result, scheduling schemes such as strict priority scheduling and largest weighted delay first [5] can no longer guarantee the delay requirement of rtPS in a rtPS-dominant high load network. Thus, the admission threshold for rtPS is suggested to be capped at 78% of the total system load, as given by Equation (19) to fulfil the delay requirement of the video call in the cell with .
.
Figure 7 shows the impact of different average SINR value on the packet delivery delay in different cell loads. It is observed that packet delay only varies slightly under various SINR environments with the same normalized cell load. Thus, the admission threshold for rtPS in various SINR environments is different, as defined by  in Equation (19). In an environment with an average SINR of 10 dB, users are more evenly distributed among the states compared to those at SINR of 20 dB. Thus, an uneven distribution of users in each state yields a longer queue in the buffer, resulting in slower packet delivery. For video calls with a maximum delay of 50 ms, only five MAC packets can be buffered since each packet will be scheduled every 10 ms.
To gain an insight into the relationship between packet delay and cell throughput in different cell loads and SINR environme nts, we solve Equations (15)-(19). Figure 8 shows the result on the impact of different average SINR values in the network towards both packet delay and cell throughput. As shown in Figure 8, the results obtained analytically are found to be similar to those obtained from simulations. It is observed that with a higher
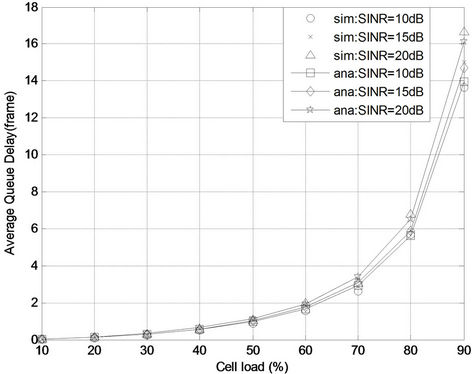
Figure 7. Packet delay as a function of cell load at different SINRs.
average SINR, users experience a higher cell throughput with lower packet delays. With a lower average SINR, the probability of users operating in lower order modulation is higher, thus leading to a lower cell capacity and fewer users supported in the network. The packet delay increases exponentially with an increase in cell load. To meet the delay requirement of rtPS, the number of video call users supported per cell needs to be scaled down. Thus, the total number of video call users supported is limited to meet the delay requirement.
Figure 9 shows the impact of delay requirement on the number of rtPS users supported per cell at different SINR values. As shown in Figure 9, the cell throughput is traded-off to meet the delay requirement of rtPS service. The admission control on rtPS is applied to limit the number of users admitted so that the quality of real time
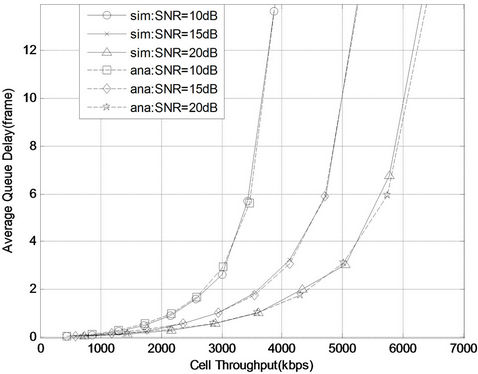
Figure 8. Trade-off of cell throughput for delay requirement at different SINR values.
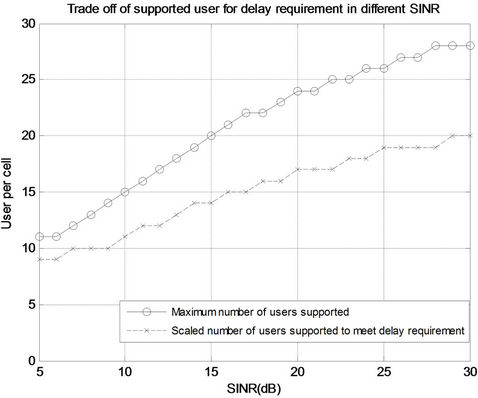
Figure 9. Trade-off of number of rtPS users supported per cell for 10 ms delay at different SINRs obtained from the proposed analytical model.
service is satisfactory and the delay requirement is fulfilled. Admission control keeps track of the resource used by rtPS in the cell; it also ensures that the traffic will not exceed a configurable threshold. Figures 8 and 9 show that capacity and QoS requirements have been jointly considered in determining the number of users that can be supported in the network. Without considering QoS requirements, the packet delay can be immeasurable when the cell load is approaching the maximum limit. Thus, it is crucial to consider QoS requirements in dimensioning rtPS dominant networks.
Figure 10 shows the impact of cell load on the cell range for four types of clutter: dense urban with clutter attenuation factor,  , urban with
 , suburban with
  and rural with
 , with frequency reuse of one and no interference cancellation scheme is considered. As shown in Figure 10, the cell range reduces with the increase in cell load. With an increase in cell load, the overall interference power from neighboring cells,
  towards the serving cell will increase and thus a higher interference margin
  is needed to maintain the minimum SINR requirement at the cell border, as given by Equations (23)-(26). A higher value of
  yields smaller cells and thus, it is seen from Figure 10 that cell coverage is being traded off for a higher capacity in the cell.
Figure 11 shows the impact of cell load towards coverage probability for achieving the minimum required bit rate at the cell border. This result shows the trade-off between the throughput at the cell border and coverage probability at different load levels in the cell. In this case, QPSK (3/4) modulation is needed for a spectral efficiency of 1.02 bps/Hz at the cell border as given in Table 2. This gives a coverage probability of 93% for the network planned for 25% of cell load. However, the coverage probability drops to 88% when the load increases to
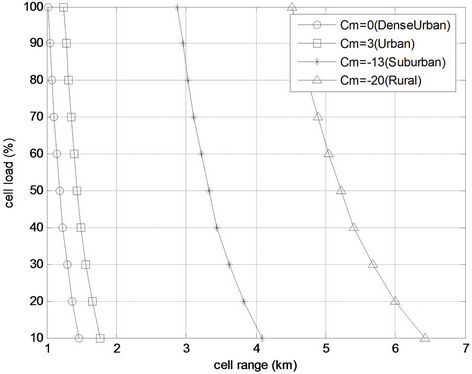
Figure 10. Cell range for different load levels in the cell obtained from the proposed analytical modal.
50%.
The coverage study in this paper is extended to evaluate the impact of different base station transmit powers towards the average SINR in a cell for different load conditions. The results obtained from simulations are shown in Figure 12. The interference power from neighboring cells,  or known as ICI appears in the form of “collisions” when the schedulers of neighboring cells assign the same resource to concurrent transmissions that interfere with each other. With a frequency reuse factor of one, an increase in load increases the hit probability, thus increasing the noise level at the cell. As shown in Figure 12, for cell loads exceeding 50%, the SINR values are similar for different transmit power levels as the network is interference limited. This implies that the increase in base station transmit power does not
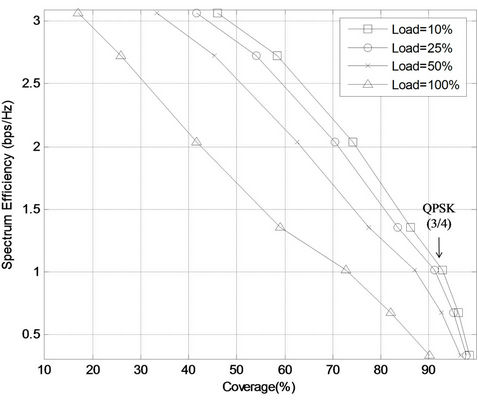
Figure 11. Trade off of coverage throughput and coverage probability at different cell loads obtained from the proposed analytical model.
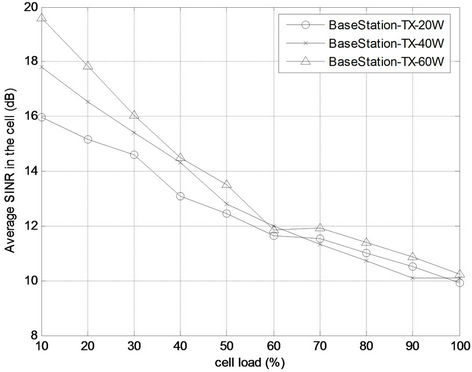
Figure 12. Average SINR in the network with different average cell loads obtained from simulations.
help improve the SINR in a highly loaded network. When the cell load is low, the SINR is dominated by thermal noise and it can be seen that a higher base station transmit power can be used to improve the SINR and coverage performance. A greenfield macro site is typically unloaded and coverage limited due to the maximum available transmit power of the base station equipment. In coverage-limited scenarios, the cell size is limited by the maximum path loss allowed in the link budget, in particular the minimum SINR requirement needed for a specific modulation,  as given in Equation (22). In an unloaded network, interference from other cells is minimal and thus the network is limited by thermal noise. In a noise limited network, an increase in base station transmit power can improve SINR and thus increase cell range. On the other hand, a loaded macro cell is typically limited by the available DL capacity of the cell; in particular, the DL interference capacity limit. For DL interference limited scenarios, the cell size is limited by the interference from other cells,
  as
as . Thus, an increase in base station transmit power will only increase the overall
  and does not help improve the SINR and cell range, as shown in Figure 12. In conclusion, the increases in base station transmit power will help increase the cell range in a noise limited network but not for the case of interference limited networks.
From the results presented in Figures 6-12, it is important to jointly consider coverage, capacity and QoS requirement together in network dimensioning. Figure 13 shows the dimensioning results using the proposed methodology where the optimal number of sites fulfiling the coverage, capacity and QoS requirements is obtained. Two sets of dimensioning are performed by varying the cell load from 10% to 100%. In one, only the requirement on cell coverage is taken into consideration, in the other, only the requirements on network capacity based on different traffic usage behaviors and delay requirements are considered. From Figure 13, it can be seen that a high cell load requires many sites to fulfil the coverage requirement but fewer sites to meet the capacity requirement, and vice versa for low loads. The optimal load of a cell is identified to the cell load which gives the lowest site count from coverage and capacity dimensioning. In this case study example, a suburban area of 140 km2 with 300,000 subscribers is considered. The results shows that six is the minimum site count where the optimum cell load of 33% fulfils both the coverage and capacity requirements for an average of 2 GB/month usage per subscriber. When the subscriber profile is raised to 6.5 GB/month, the cell load increases tremendously. The optimal number of sites needed to fulfill both coverage and capacity requirements are achievable with more than 90% of cell load. From Figure 13, it is clear that the network is capacity limited and the delay

Figure 13. Optimized site count based on coverage and capacity consideration obtained from the proposed analytical model.
requirement needs to be considered in determining the maximum cell capacity. As previously shown in Figure 6, a maximum cell capacity of 82% is needed to fulfil the delay requirement and thus this has increased the site count needed from nine sites to ten sites.
In summary, a higher traffic profile per subscriber will drive a higher cell load, leading to a higher number of sites. In order to fulfill the packet delay requirement of rtPS, the admission threshold needs to be determined, and the maximum cell load allowed needs to be capped at this admission threshold level. When rtPS becomes the dominant service, network dimensioning has to be revisited and QoS requirements should be considered in order to ensure better user experience. In this paper, we focus on scheduling for rtPS applications. Another important and promising service in IEEE 802.16 networks are chatty applications, such as instant messaging and social networking applications, which are expected to become dominant services in the future. Our further research will focus on networks with both rtPS and chatty applications as dominant traffic.
4. Conclusion
In this paper, an improved dimensioning framework for rtPS-dominant IEEE 802.16 networks is proposed. The proposed network dimensioning framework estimates the minimum number of sites required by jointly considering coverage, capacity requirement, and QoS requirements. Furthermore, a simple and efficient analytical method for evaluating the capacity and performance of rtPS in IEEE 802.16 wireless networks has been proposed. This dimensioning framework incorporates an analytical model which considers AMC and network SINR values to evaluate packet delay in the network. With this dimensioning framework, the admission threshold for rtPS to fulfill the packet delay requirement can be identified easily. Simulations have been conducted to demonstrate the effectiveness and efficiency of the proposed framework and verify the accuracy of the analytical model. This study is useful for engineers in designing efficient IEEE 802.16 wireless networks and provides network operators with an analytical means for obtaining the minimum number of sites required by jointly considering coverage, capacity and QoS requirements.
REFERENCES
- IEEE 802.16aTM-2003, “IEEE Standard for Local and Metropolitan Access Network Part 16: Air Interface for Fixed Broadband Wireless Access Systems—Amendment 2: Medium Access Control Modifications and Additional Physical Layer Specifications for 2-11 GHz,” 2003.
- M. J. Montpetit, N. Klym and T. Mirlacher, “The Future of IPTV: Adding Social Networking and Mobility,” 10th International Conference on Telecommunications, Zagreb, 8-10 June 2009, pp. 405-409.
- X. Wang, T. Kwon, Y. Choi, M. Chen and Y. Zhang, “Characterizing the Gaming Traffic of World of Warcraft: From Game Scenarios to Network Access Technologies,” IEEE Network, Vol. 26, No. 1, 2012, pp. 27-34. doi:10.1109/MNET.2012.6135853
- D. J. Reid, A. Srinivasan and W. Almuhtadi, “QoS Performance Testing of Multimedia Delivery over WiMAX Networks,” 1st International Conference on Data Compression, Communications and Processing, Palinuro, 21- 24 June 2011, pp. 271-274.
- K. Wongthavarawat and A. Ganz, “Packet Scheduling for QoS Support in IEEE802.16 Broadband Wireless Access System,” International Journal of Communication Systems, Vol.16, No. 1, 2003, pp. 81-96. doi:10.1002/dac.581
- K. H. Goh, T. S. Kiong, J. Koh and D. Yap, “WiMAX Capacity Estimation through Channel Characteristic Simulation,” Proceedings of IEEE 2008 6th National Conference on Telecommunication Technologies and IEEE 2008 2nd Malaysia Conference on Photonics, Putrajaya, 26-27 August 2008.
- M. Andrews, K. Kumaran, K. Ramanan, A. Stolyar, P. Whiting and R. Vijayakumar, “Providing Quality of Service over a Shared Wireless Link,” IEEE Communications Magazine, Vol. 39, No. 2, 2001, pp. 150-154. doi:10.1109/35.900644
- H. Kassim and M. D. Baba, “Performance Analysis of Fixed and Mobile WiMax Networks Using NCTUns Tools,” IEEE Control and System Graduate Research Colloquium, Shah Alam, 27-28 June 2011, pp. 159-165. doi:10.1109/ICSGRC.2011.5991849
- H. L. Vu, Sa. Chan and L. L. H. Andrew, “Performance Analysis of Best-Effort Service in Saturated IEEE 802.16 Networks,” IEEE Transaction on Verhicular Technology, Vol. 59, No. 1, 2010, pp. 460-472. doi:10.1109/TVT.2009.2033191
- D. Niyato and E. Hossain, “A Queuing-Theoretic and Optimization-Based Model for Radio Resource Management in IEEE 802.16 Broadband Wireless Networks,” IEEE Transaction on Computers, Vol. 55, No. 11, 2006, pp. 1473-1488. doi:10.1109/TC.2006.172
- X. Y. Fang and D. Ghosal, “Analyzing Packet Delay Across a GSM/GPRS Network,” Examination Report, United Kingdom Patent Office, 24 July 2003, pp. 1-10.
- M. F. Neuts, “Matrix-Geometric Solutions in Stochastic Models, an Algorithmic Approach,” Johns Hopkins University Press, Baltimore, 1981.
- W. J. Stewart, “Introduction to the Numerical Solution of Markov Chains,” Princeton University Press, Princeton, 1994.
- A. Belghith and L. Nuaymi, “WiMAX Capacity Estimation and Simulation Results,” Vehicular Technology Conference, VTC Spring, Berlin, 2008, pp. 1741A-1745A.
- I. Gutiérrez, F. Bader, R. Aquilué and J. L. Pijoan, “Contiguous Frequency-Time Resource Allocation and Scheduling for Wireless OFDMA Systems with QoS Support,” EURASIP Journal on Wireless Communications and Networking, Vol. 2009, 2009, Article ID: 134579.
- L. M. A. Jalloul and S. P. Alex, “Coverage Analysis for IEEE802.16e/Wimax System,” IEEE Transaction on Wireless Communication, Vol. 7, No. 11, 2008, pp. 4627-4634. doi:10.1109/T-WC.2008.070665
- A. Triki and L. Nuaymi, “InterCell Interference Coordination Algorithms in OFDMA Wireless Systems,” 2011 IEEE Vehicular Technology Conference (VTC Spring), Budapest, 15-18 May 2011, pp. 1-6.
Appendix
The probability of staying in state-i,  can be written as a function of the previous state,
  as follows
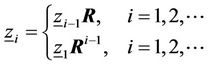 (30)
(30)
where the square matrix R is a non-negative solution to the matrix quadratic equation. Using global balance equations, Equation (11) can be further expanded by using Equation (30) as follows
 (31)
(31)
From the global balance equation we can derive
 (32)
(32)
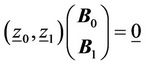
Since Equation (31) does not have full rank, normalization of Equation (11) is needed to arrive at a unique solution
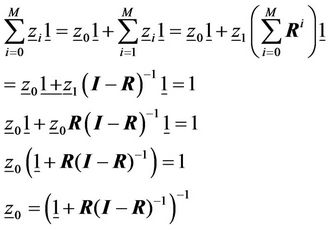 (33)
(33)
In order to solve for R, we first set i = 1.
 (34)
(34)
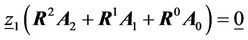
Equation (33) is valid when either  or when the quadratic equation within the parentheses equals
 . Since
 , the matrix R follows from the following matrix quadratic equation:
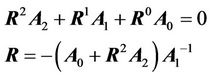 (35)
(35)
To solve for the value of R, some approximation on R can be made as follows
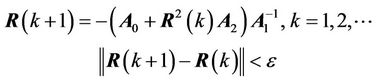 (36)
(36)
In this study, we choose  to achieve good accuracy.