Journal of Water Resource and Protection
Vol.07 No.04(2015), Article ID:54955,8 pages
10.4236/jwarp.2015.74029
Evaluating Groundwater Pollution Using Hydrochemical Data: Case Study (Al Wahat Area East of Libya)
Salam M. Rashrash1, Bahia M. Ben Ghawar1, Abdelrahim M. Hweesh2
1Faculty of Engineering, Geological Engineering Department, Tripoli, Libya
2General Water Authority, Tripoli, Libya
Email: srashrash@yahoo.com, gloriamuftah@yahoo.com, Ahweesh@yahoo.co.uk
Copyright © 2015 by authors and Scientific Research Publishing Inc.
This work is licensed under the Creative Commons Attribution International License (CC BY).
http://creativecommons.org/licenses/by/4.0/


Received 19 February 2015; accepted 22 March 2015; published 24 March 2015
ABSTRACT
Water is one of the most challenging current and future natural resources, which will directly affect the environment and development by the changes in its quantity, quality and regional distribution. However, Water quality is the critical factor that influences human health and irrigation proposer. This work aims to investigate hydrochemical analysis and geochemical processes influencing the groundwater of Al Wahat area (Jalou, Awjla and Jukherra), which is located in central east Libya. Thirty four water samples collected from domestic and agricultural water wells were analyzed and used for conventional classification techniques which were Piper, Durov and Stiff diagrams to evaluate geochemical processes. Cluster analysis was used to identify the water type and ions concentration and distribution. Results show significant increase of dissolved salts, especially Nitrates. Elevated nitrates concentration can be attributed to either the disposal of untreated sewage water from disposal ponds and septic tanks or the infiltration of irrigation water saturated with fertilizing chemicals. Therefore, irrigation wells revealed that suffering from nitrate contamination caused an increase of the chance of nitrate pollution. In addition, contour maps present a sudden increase in the total dissolved salts (TDS) in the northeastern part coincident with the highest of secondary ions of NO3 content, indicating the infiltration of irrigation water which is responsible partially for the groundwater degradation. Hydrogeochemical facie is NaCl type and enrichment of Na+ and Cl− can be attributed to urban untreated wastewaters and high rate of evapotranspiration. The concentrations of heavy elements such as Zn, Pb, Cu, Cd, Ni and Cr were low and within the WHO ranges.
Keywords:
Al Wahat Area, Shallow Groundwater, Chemical Compound Analysis

1. Introduction
Fresh water in the Mediterranean regions represents 3% of the world’s water resources though it gathers 7.3% of the world’s population. 30 million Mediterranean citizens have no access to healthy water (PNUE [1] ).
Much of the population in Libya is concentrated within a narrow strip along the Mediterranean coast; the bulk of the ground water potential is located to the south in the desert area such as the Murzuq and Al Kufra basin. Much of the ground water is used in irrigated agriculture, which represents 80% of total consumption (Alghariani [2] ).
Groundwater can become contaminated from natural sources or numerous types of human activities. Waste from residential, commercial, industrial and agricultural activities can seriously affect groundwater quality. These contaminants may reach groundwater from activities on the land surface, such as industrial waste storage or spills, from sources below the land surface but above the water table, such as septic systems, from structures beneath the water table, such as wells, or from contaminated recharge from the aquifers.
The survey was performed cross Al Wahat area, about 6400 km2 between 520,000 and 600,000 longitude E, and 3,174,000 and 3,254,000 latitude N (UTM WGS1984, zone 34). Data from ten water wells were not quite so extensive, but wells distributed throughout the region (Figure 1). Therefore, follow-up chemical variability of water, in particular, increased concentrations of dissolved salts of the Al Wahat area. Conducting chemical analyzes is to determine the extent of contamination and evaluate the quality and appropriateness of the use of urban and agricultural. In fact, understanding the origin and mechanisms of the salinization process is essential for preventing further deterioration of groundwater resources in the study area.
Consequently, the objective of this study is to understand the fluctuation and water quality of lower Middle Miocene aquifer. GWA [3] reported, for Jalo and Awjlah water situation study, that the main a semi-confined aquifer was post Middle Miocene. This aquifer, called the Marada Formation, is a series of fluviatile, medium- to coarse-grained sands with minor thicknesses of clay strata from the southwest, and grade finally into marine limestones, dolomites, shales, and clays with minor thicknesses of sandstones and sands beyond that area to the northeast (Wright et al. [4] ). The water samples taken from wells have a depth ranging from 100 to 200 m.
2. Methodology
Thirty four water samples are taken from drinking, Piezometric and irrigation shallow aquifer. Two of these wells are used for domestic water supply, and the others are used to supply agricultural farms. Physical and chemical parameters of groundwater; pH, electrical conductivity (EC), total dissolved solids (TDS), total hardness (TH), Ca2+, Mg2+, Na+, K+,  , Cl−,
  ,
,  were measured by using the standard methods.
Delineating of the hydrochemical processes and defining groundwater types of hydrochemical facies was derived by constructing scatter plots, Piper, Durov and Stiff diagrams. This allowed to represent all chemical parameters (major and trace elements) and to study their relationship in the aquifer system. Using of these methods facilitates the interpretation of the evolutionary trends and the hydrochemical processes occurring in the groundwater system. In additional, Multivariate statistical analysis (cluster analysis or principal components analysis “PCA”) is widely used to identify the sources of solutes in a groundwater system (Meng and Maynard [5] ). It offers a better understanding of water quality and allows comparison of different samples of waters (Yidana et al. [6] ). SURFER8 software used to elaborate the necessary maps.
3. Results and Discussion
The physical and chemical compositions of the Groundwater samples were statistically analyzed and the results (minimum, maximum, mean, and standard deviation of ions) obtained were summarized, and compliance with WHO [7] and EU [8] drinking water standards in Table 1.
Hydrochemical analysis presents the cations sodium (Na+) is more abundant in the ground water (Figure 2(a)), while all the cations Ca2+, Mg2+ and K+ are decreases respectively. The second most abundant anion is Cl− concentration increase (up to 2600 mg/L) to the central part of the study area, close to well 3 (Figure 2(b)), Considering that (Cl−) is a major indicator that might be used to infer infiltration of waste water from cesspits into ground water (Foppen [9] ). Sulfate ( ) is the second anion present and has high concentration after the Cl−. It increases on the north direction at wells 4 and 10. The presence of
  frequently indicates a recharge in mixed water or a simple dissolution. Thus, the total anion charge of the samples decreases from the Cl− to the

Figure 1. Location of the study area (after National Spatial Policy 2006).

Table 1. Evaluation of physical and chemical parameters of groundwater samples of the study area based on WHO (2006) and EU (1998) standards.
NA: Not available.
 (a)
(a) (b)
(b)
Figure 2. Cation sodium (Na+) and anion chloride (Cl−) ions concentration (mg/l) through the study area. (a) Na+; (b) Cl−.
 ,
,  ,
,  to
to . This can be interpreted in terms of increasing weathering susceptibility from carbonates to halite. This trend also shows the presence of these diverse lithological components within aquifer systems. Generally, all cations and anions are increased toward centre of study area around well 5 and enrichment of Na+ and Cl− is also possible, related to urban wastewaters and high rate of evapotranspiration.
Cluster analysis is a data classification technique and one of the most powerful tools for analyzing water hydro-geochemical data (Reeve et al. [10] ; Ochsenkuehn et al. [11] ). This technique allows relationship investigation between the observations or the variables of a dataset, in order to recognize the existence of groups. The CA was used to split the standardized chemico-physical data into groups (clusters) based on similarities (or dissimilarities) so that each cluster represents a specific process in the aquifer system (Ragno et al., [12] ; Templ et al., [13] . The result of the analyses is a graph, called dendrogram, which is a present Cl-Ca and SO4-Na ions peers have close regression coefficient and the water type of samples were mainly HCO3.
Nitrate levels for groundwater sources varied from 0 to 199 mg/l (Table 1). Contamination with waste water that might be infiltrating into it from surrounded cesspits. This inference might be supported [ ], elaborated within the same Table, where it is noted that range (highest in well 5). Nitrate concentration map (Figure 3) construct to illustrate major trend of increments and pollution trend.
The pH value is an important index of acidity or alkalinity and the concentration of hydrogen ion in GW Murugesan et al. [14] . The pH values of all water samples of different wards were found in permissible range of 7 - 8.5 according to WHO [7] recommended values. Electrical conductivity (EC) represents the total concentration of soluble salts in water. It is used to measure the salinity hazard to crops as it reflects the TDS in groundwater. Throughout the Al Wahat area, there is an increment from south to north.
TDS of groundwater salinity of post Middle Miocene values indicate a large range of variation from 1045 mg/L to about 7216 mg/L. It shows a strong mineralization of the water in the central and north direction of the study area. The water salinity in this area increases from south to north, which is illustrating existence of recharge processes at the southern part of the area. On other words, low TDS values, characterizing the southern and western border of the study area, reveal the dilution of the groundwater by the recharge coming from the southern border this region. Also, gradual increase of groundwater salinity is related to the abundance of evaporitic and marly deposits. Based on the total dissolved solids content in water after Todd [15] all the water in the study area was classified as brackish water because of TDS values between 1000 and 10,000 mg/L, as summarized in Table 1. According to Sawyer and MaCarty [16] , total hardness classification scheme indicates the water samples were very hard (>300).
Piper-trilinear diagram permits the cation and anion compositions of samples to be represented on a single graph in which major groupings or trends in the data can be discerned visually (Freeze and Cherry [17] ). Also, it is used to assess the hydrogeochemical facies. Based on the contents of major cations and anions, all samples fall within NaCl type, or type II (Na-K-Cl-SO4) as shown in Figure 4. While Figure 5 shows the comparison between the shapes of Stiff diagrams which reflects the concentration of water-quality constituents for the groundwater samples of the Al Wahat area. The samples 3, 4 and 5 show the highest concentration of chloride and (sodium + potassium).

Figure 3.  concentration (mg/l) map of the study area.
 (a)
(a) (b)
(b)
Figure 4. Piper-trilinear and Durov diagrams.
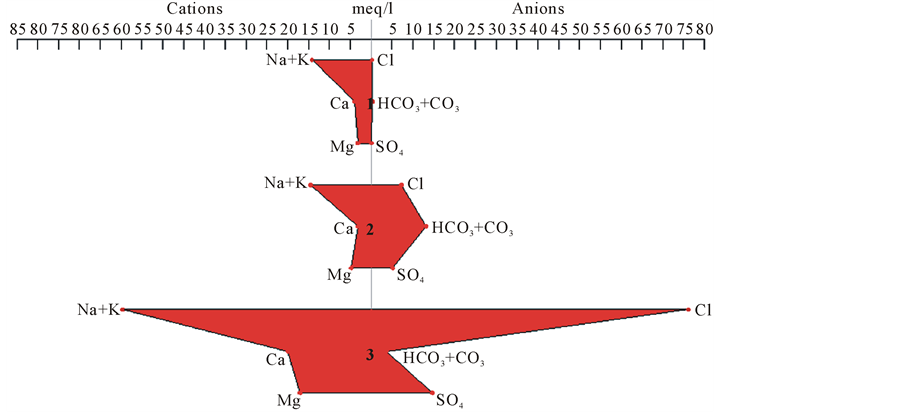


Figure 5. Stiff diagram of Al Wahat groundwater samples.

Figure 6. Gibbs diagram of Al Wahat groundwater samples.
The mechanism controlling water chemistry and the functional sources of dissolved ions can be assessed by plotting the ratios of [Na+/(Na+ + Ca2+)] and [Cl−/(Cl− + HCO3−)] as functions of TDS (Gibbs [18] ). Figure 6 presents Gibbs diagram of the water samples, clearly showing that the samples have become saline by evaporative enrichment. As noted, evaporation greatly increases the concentration of ions formed by chemical weathering, leading to higher salinity (Jalali [19] ). The chemical composition of these water were mainly controlled by weathering reactions, as well as from dissolution of both carbonate and silicate minerals from them and by the interaction between the aquifer rocks and groundwater.
4. Conclusion
Hydrogeochemical studies are a useful tool which can help manage the quality of water resources. However, high concentration of  is related to pollution, where
  has no known lithologic source, which is attributed to the urban wastewaters and agricultural practices involving chemical (nitrogenous) fertilizer applications. The cationic concentrations are ranged in the order of Na+ > Ca2+ > Mg2+ > K+, while it is
  > Cl− >
  >
>  >
>  for anions. Therefore, the study showed that all samples lay over normal chloride (<15 meq/l), and normal sulfate (<6 meq/l) except that water samples were taken from wells 1 and 2. However, they lay under normal bicarbonate water type. The Piper-trilinear diagram showed the predominance of fall within NaCl type, or type II (Na-K-Cl-SO4) water type. All water samples fell within the recommended non permissible limit, except the water sample of well 1 and 2. All the physicochemical parameters of the water samples were not within the WHO (2006) and EU (1998) guidelines for drinking water and were non-suitable for human consumption in domestic uses except wells which were as mentioned above. According to the overall evaluation of the quality of the shallow ground water of the Al Wahat studied area, more hydrochemical investigations at central and north direction of the study area are required in general. Isotope analysis is recommended to determine the source of nitrates.
Acknowledgements
The authors like to acknowledge the General Water Authority for providing the laboratory data.
References
- PNUE Programme des Nations Unies pour l’Environnement (2004) Plan d’Action pour la Méditerranée: MAP Technical Report Series No. 158.
- Alghariani, S.A. (2002) Future Perspectives of Irrigation in Southern Mediterranean Region: Policies and Management Issues. In: Al-Rasheed, M., Singh, V.P. and Sheriff, M.M, Eds., Proceedings of the International Conference on Water Resources Management in Arid Regions, 313-320.
- GWA (2002) General Water Authority. Unpublished Report.
- Wright, E.P., et al. (1974) Jalu-Tazerbo Project: Phase I Final Report. Institute of Geological Sciences, London. (Unpublished)
- Meng, S.X. and Maynard, J.B. (2001) Use of Statistical Analysis to Formulate Conceptual Models of Geochemical Behaviour: Water Chemical Data from the Botucatu Aquifer in Sa˜o Paulotate, Brazil. Journal of Hydrology, 250, 78- 97. http://dx.doi.org/10.1016/S0022-1694(01)00423-1
- Yidana, S.M., Ophori, D. and Banoeng-Yakubob, B. (2008) A Multivariate Statistical Analysis of Surface Water Chemistry Data―The Ankobra Basin, Ghana. Journal of Environmental Management, 86, 80-87. http://dx.doi.org/10.1016/j.jenvman.2006.11.023
- WHO (2006) Guideline for Drinking Water Quality. 3rd Edition, World Health Organization.
- EU (1998) Council Directive 98/83/EC of 3 November 1998 on the Quality of Water Intended for Human Consumption. Official Journal of the European Communities, L330, 32-54.
- Foppen, J.W.A. (2002) Impact of High-Strength Was Tewater Infiltration on Groundwater Quality and Drinking Water Supply: The Case of Sana’a, Yemen.
- Reeve, A.S., Siegel, D.I. and Glaser, P.H. (1996) Geochemical Controls on Peatland Pore Water from the Hudson Bay Lowland: A Multivariate Statistical Approach. Journal of Hydrology, 181, 285-304. http://dx.doi.org/10.1016/0022-1694(95)02900-1
- Ochsenkuehn, K.M., Kontoyannakos, J. and Ochsenkuehn, P.M. (1997) A New Approach to a Hydrochemical Study of Ground Water Flow. Journal of Hydrology, 194, 64-75. http://dx.doi.org/10.1016/S0022-1694(96)03218-0
- Ragno, G., De Luca, M. and Ioele, G. (2007) An Application of Cluster Analysis and Multivariate Classification Methods to Spring Water Monitoring Data. Microchemical Journal, 87, 119-127. http://dx.doi.org/10.1016/j.microc.2007.06.003
- Templ, M., Filzmoser, P. and Reimann, C. (2008) Cluster Analysis Applied to Regional Geochemical Data: Problems and Possibilities. Applied Geochemistry, 23, 2198-2213. http://dx.doi.org/10.1016/j.apgeochem.2008.03.004
- Murugesan, A., Ramu, A. and Kannan, N. (2006) Water Quality Assessment for Uttamapalayan Municipality in Theni District, Tamil Nadu, India. Pollution Research, 25, 163-166.
- Todd, D.K. (1980) Groundwater Hydrology. 2nd Edition, John Wiley and Sons Inc., Hoboken, 315.
- Sawyer, G.N. and McCarthy, D.L. (1967) Chemistry of Sanitary Engineers. 2nd Edition, McGraw Hill, New York.
- Freeze, R.A. and Cherry, J.A. (1979) Ground Water. Prentice Hall, Inc., Englewood Cliffs, 604 p.
- Gibbs, R.J. (1970) Mechanisms Controlling World Water Chemistry. Science, 17, 1088-1090. http://dx.doi.org/10.1126/science.170.3962.1088
- Jalali, M. (2007) Salinization of Groundwater in Arid and Semi-Arid Zones: An Example from Tajarak, Western Iran. Environmental Geology, 52, 1133-1149. http://dx.doi.org/10.1007/s00254-006-0551-3