Journal of Water Resource and Protection
Vol.06 No.14(2014), Article ID:50900,9 pages
10.4236/jwarp.2014.614121
Discharge Simulation in a Data-Scarce Basin Using Reanalysis and Global Precipitation Data: A Case Study of the White Volta Basin
Yoichi Fujihara1*, Yukiyo Yamamoto2, Yasuhiro Tsujimoto2, Jun-Ichi Sakagami3
1Faculty of Bioresources and Environmental Sciences, Ishikawa Prefectural University, Nonoichi, Japan
2Japan International Research Center for Agricultural Sciences, Tsukuba, Japan
3Faculty of Agriculture, Kagoshima University, Kagoshima, Japan
Email: *yfuji@ishikawa-pu.ac.jp
Copyright © 2014 by authors and Scientific Research Publishing Inc.
This work is licensed under the Creative Commons Attribution International License (CC BY).
http://creativecommons.org/licenses/by/4.0/


Received 24 July 2014; revised 21 August 2014; accepted 15 September 2014
ABSTRACT
Basins in many parts of the world are ungauged or poorly gauged, and in some cases existing measurement networks are declining. The purpose of this study was to examine the utility of reanalysis and global precipitation datasets in the river discharge simulation for a data-scarce basin. The White Volta basin of Ghana which is one of international rivers was selected as a study basin. NCEP1, NCEP2, ERA-Interim, and GPCP datasets were compared with corresponding observed precipitation data. Annual variations were not reproduced in NCEP1, NCEP2, and ERA-Interim. However, GPCP data, which is based on satellite and observed data, had good seasonal accuracy and reproduced annual variations well. Moreover, five datasets were used as input data to a hydrologic model with HYMOD, which is a water balance model, and with WTM, which is a river model; thereafter, the hydrologic model was calibrated for each datum set by a global optimization method, and river discharge were simulated. The results were evaluated by the root mean square error, relative error, and water balance error. As a result, the combination of GPCP precipitation and ERA-Interim evaporation data was the best in terms of most evaluations. The relative errors in the calibration and validation periods were 43.1% and 46.6%, respectively. Moreover, the results for the GPCP precipitation and ERA-Interim evaporation were better than those for the combination of observed precipitation and ERA-Interim evaporation. In conclusion, GPCP precipitation data and ERA-Interim evaporation data are very useful in a data-scarce basin water balance analysis.
Keywords:
Reanalysis Data, Global Precipitation Data, Ungauged Basin, Hydrologic Model, Discharge Simulation, Africa

1. Introduction
A large number of hydrologic models have been developed up to the present. Some models are able to simulate water use with human activities as well as natural water cycles (e.g., [1] -[3] ). Furthermore, physically sophisticated hydrologic models such as SWAT (Soil and Water Assessment Tool) developed by [4] are opened as a public domain model, and nowadays, anyone can run a sophisticated hydrologic model without any difficulties. Moreover, these hydrologic models are used in the impact assessment on river discharge of climate change and to establish water resources planning based on the simulations.
However, in developing countries and international rivers, it is often very difficult to obtain meteorological and hydrological data which are input into hydrologic models. Also the quality of observation data is extremely poor, and the situation that meteorological and hydrological observations have been stopped happens quite often. Drainage basins in many parts of the world are ungauged or poorly gauged, and in some cases existing measurement networks are declining [5] . Therefore, sometimes it is impossible to apply a hydrologic model to simulation because of observation, even if there is a hydrologic model.
On the other hand, datasets from general circulation models and products estimated by satellites have been developed drastically recently. The spatial and temporal resolution of those data becomes higher rapidly. A representative dataset is re-analysis data, which is frequently used for a water balance analysis in global or continental scale and climate studies (e.g., [6] -[9] ). Moreover, Biemans et al. [10] compared seven global gridded precipitation datasets at river basin scale in terms of mean annual and seasonal precipitation. Getirana et al. [11] assessed different precipitation datasets including reanalysis data in the Negro River basin which is the most important tributary of the Amazon basin. Kotsuki and Tanaka [12] discussed four precipitation data sets to estimate runoff in Southeast Asia. However, simulated runoffs using these data sets have not been examined in African basins, which are sometimes hampered by the fact that only little hydro-meteorological information is available [13] .
In this study, the utility of reanalysis and global precipitation datasets are examined in the rainfall-runoff analysis in the Volta River basin, which is one of the representative basins in Africa. NCEP1 (National Centers for Environmental Prediction and National Center for Atmospheric Research Reanalysis 1), NCEP2 (NCEP and Department of Energy Reanalysis 2), ERA-Interim (European Reanalysis-Interim), and GPCP (Global Precipitation Climatology Project) datasets are compared with corresponding observed precipitation data. Datasets are used as input data to a hydrologic model and river flows are simulated and the simulation results are compared with the observed data.
2. Study Area
The Volta River basin which is one of international rivers was selected as a study basin. The Volta River basin shared between five riparian countries: Benin, Burkina Faso, Ghana, Ivory Coast and Mali [14] . The Volta River basin is very flat. The predominant land use types are Guinea savannah in the southern and Sudan savannah in the northern part. The main geological systems of the basin are Precambrian platform and a sedimentary layer, the Voltaian sandstone basin [13] . The predominant soil types are lixisols in the southern and arenosols in the northern part.
The Volta River basin is situated in the semi-arid to sub-humid climate zone with mean annual temperature between 27˚C and 36˚C in the northern and between 24˚C and 30˚C in the southern part [13] . Mean annual precipitation ranges from less than 300 mm (North) to more than 1500 mm in the South whereof around 80% falls between July and September. Evapotranspiration is a very important factor in this region. The mean annual potential evaporation lies between 2500 mm in the North and 1500 mm in the South [13] .
3. Methods
3.1. Data
Reanalysis data are a consistent and high quality historical analysis dataset spanning the past several decades using the latest data assimilation system, numerical prediction models, and a high-performance supercomputer (e.g., [15] ). Some numerical prediction centers carried out their reanalysis projects and open those data by a web site. In this study, NCEP1 [16] made by NCEP (National Centers for Environmental Prediction) and NCAR (National Center for Atmospheric Research) were selected. NCEP2 [17] made by NCEP and DOE (Department of Energy) and ERA-Interim (European Reanalysis-Interim) [18] developed by ECMWF (European Centre for Medium-Range Weather Forecasts) were also selected (Table 1). Daily precipitation and evaporation data can be collected up to the present. However, collection period is from 1997 to 2009, considering other meteorological data.
In addition to reanalysis data, some high resolution global precipitation data are developed using satellite data and ground observation data. GPCP (Global Precipitation Climatology Project) one-degree daily [19] is selected in these data sets (Table 1). These data are based on multiple passive microwaves, infrared satellite observations and gauge observations. Its temporal resolution is daily and spatial resolution is 1˚ × 1˚ latitude/longitude grid. Since GPCP is only precipitation dataset and other metrological data are not distributed, ERA-Interim evaporation data are therefore used because its spatial resolution is the highest among reanalysis datasets. The data period is from 1997 to 2009 which is the same as reanalysis data sets.
In order to validate the accuracy of reanalysis and global precipitation datasets, daily rainfall data at Tamale city from Ghana Meteorological Agency (GMet) was collected. The data from 1975 to 2009 could be collected. When the accuracy of reanalysis data and global precipitation datasets are compared, the data from 1997 to 2009 (13-year) are used, which is the same as reanalysis and global precipitation datasets.
River flow data from GRDC (Global Runoff Data Centre) was also collected. A hydrologic model described in 3.2 with reanalysis data and global precipitation data sets are run. Simulated runoff is then compared with the river flow data from GRDC to validate the accuracy of datasets. Considering the observation period and data qualities, NAWUNI station in White Volta River was selected as a target point (Figure 1). The basin area up to NAWUNI is about 92,950 km2. River flow data from 1975-2006 could be collected. However, considering the period of reanalysis data and global precipitation datasets, the river flow data from 1997 to 2006 is used to compare simulation and observation.
3.2. Hydrologic Model and Its Application
Whole study area is from −6˚W to 3˚W and 5˚N to 15˚N, which covers whole Volta River basin. This domain (9˚ × 10˚) is divided by 0.5˚ latitude-longitude spatial resolution (18 × 20 grids). At each grid cell, a water balance model which is explained in 3.2.2 and 3.2.3 is applied to calculate runoff which is subsequently routed through a grid-based flow network to simulate stream flows at selected points within the basin. Grid-based flow network is based on STN-30 (Simulated Topological Network) made by [20] and its flow directions were modified by a map indicating actual river flow routes and locations.
HYMOD (Hydrology Model) was adopted as a water balance model (Figure 2), developed by [21] . The model assumes that the soil moisture storage capacity (c) varies across the catchment and, therefore, that the proportion of the catchment with saturated soils varies over time. The spatial variability of soil moisture capacity is described by the following distribution function
 (1)
(1)
where : maximum soil moisture storage (mm),
 : degree of spatial variability of the stores (-). Evaporation from the soil moisture store occurs at the rate of the potential evaporation. Following evaporation, the remaining rainfalls are used to fill the soil moisture stores. Excess rainfall is sent to the routing module. The routing module divides the excess rainfall using split parameter
 and routes these through parallel conceptual linear reservoir meant to simulate the quick and slow flow response of the system. The flow from each reservoir is controlled by the quick flow residence time
 and the slow flow residence time
 . The simulated stream flow is therefore the addition of the outputs from each of these reservoirs. Number of parameters is five. Maximum and minimum values (Table 2) are decided based on the past research [22] .
WTM (Water Transport Model) was adopted as a river flow simulation proposed by [23] . This model is a quasi-linear reservoir model that computes discharge through each grid cell of the simulated river basin based on runoff inputs from HYMOD, a river networking system, channel transfer rates, and the timing and extent of floodplain inundation. For a single grid cell the flow and continuity equations are
 (2)
(2)

Table 1. Data sets used in this study.
Table 2. HYMOD parameters.

Figure 1. Map of the Volta River basin.
 (3)
(3)
 (4)
(4)
 (5)
(5)
 (6)
(6)
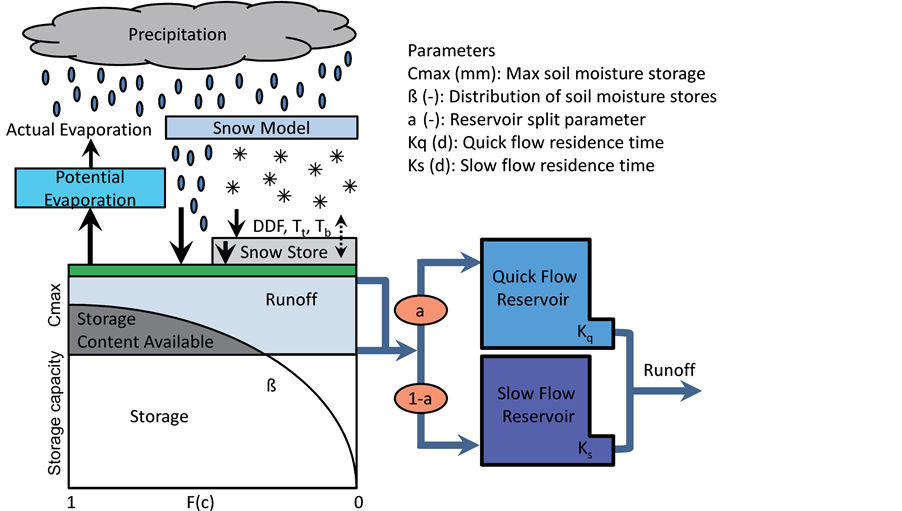
Figure 2. Diagram of the HYMOD conceptual hydrologic model [22] .
where : channel storage (m3),
 : floodplain storage (m3),
 : downstream transfer coefficient (-),
 : grid cell area (m2),
 : number of upstream donor cells,
 : runoff simulated by HYMOD (mm),
 : upriver inflow (m3),
 : discharge exported downstream (m3),
 : runoff generated locally within the grid cell considered (m3),
 : exchange between channel and flood plain (m3),
 : long term mean annual downstream discharge (m3). The coefficient
 determines the fraction (0.0 to 1.0) of potential volume change that is assigned to floodplain storage, and
 is the flood initiation parameter, giving the proportion (0.0 to 1.0) of long-term mean annual flow required to invoke floodplain exchanges. Maximum and minimum values (Table 3) are decided based on the past research.
Reanalysis data contain precipitation and evaporation data. However, GPCP is only precipitation data sets. Therefore, GCPC is combined with ERA-Interim evaporation data, because ERA-Interim is the highest spatial resolution among the reanalysis datasets used in this study. Observed meteorological data are also precipitation data only, and is combined with ERA-Interim evaporation data (Table 4). These five pattern data sets are used as input data to the hydrologic model, and optimized parameter is calibrated for each data and validated in terms of accuracy. 1997 to 2000 (4-year) is used as a calibration period and 2001 to 2006 (6-year) is used as a validation period.
ES (Evolution Strategy) was used to calibrate five parameters of HYMOD (Table 2) and three parameters of WTM (Table 3). ES is one of the global optimization methods [24] -[26] and is more powerful or efficient than SCE-UA (Shuffled Complex Evolution) method developed by University of Arizona. SCE-UA is most frequently used in parameter calibrations. Objective function to express the differences between observations and simulations is RMSE (Root Mean Square Error) which is tend to balance water volume and emphasizes the error at high flows.
 (7)
(7)
where : observed runoff,
 : simulated runoff, and
 : number of data.
4. Results and Discussion
4.1. Precipitation
The accuracy of precipitation data sets is compared. NCEP1, NCEP2, ERA-Interim, and GPCP of grid precipitation which includes Tamale city are compared with observed rainfall data (Figure 3). This figure shows that correlation coefficient is 0.64 - 0.66 in NCEP1 and NCEP2. On the other hand, correlation coefficient of ERA is 0.79, indicating that ERA is the best performance among reanalysis datasets. On the other hand, GPCP made by satellite and ground rainfall data has better correlation coefficient (0.86) than reanalysis data. Therefore, it is found that GPCP is the best datasets in terms of monthly rainfall accuracy among the sets.
Moreover, each data set and observed rainfall in annual rainfall were compared (Figure 4). This figure shows that NCEP1 and NCEP2 are quite overestimation compared with observations and annual variability does not match observations. Although ERA-Interim has a tendency to underestimate in later periods (2005-2009), annual variability quite matches with observations and much better accuracy than NCEP1 and NCEP2. On the other hand, annual variability of observed rainfall is quite well reproduced by GPCP, and its accuracy is the best in the data sets. Scatter plots of annual precipitations are shown in Figure 5. In NCEP1 and NCEP2, correlation coefficient is −0.18 - 0.15, indicating almost no-correlation in annual period. ERA-Interim is much better than
Table 3. WTM parameters.
Table 4. Input data sets used in this study.

Figure 3. Scatter plot of monthly rainfall for each data set.

Figure 4. Time series of annual rainfall for each data set.

Figure 5. Scatter plot of annual rainfall for each data set.
NCEP1 and NCEP2, but correlation coefficient is 0.46 and the performance is not good very much. On the other hand, GPCP of correlation coefficient is 0.70 and it is found that GPCP is much better than other data sets.
4.2. River Flow
Model parameters are calibrated for each data set (Table 4) using the ES, and simulation and observation are shown in Figure 6. In addition to RMSE as an objective function, relative error and water balance error are shown in Tables 5-7.
 (8)
(8)
 (9)
(9)
From Figure 6, it is found that simulation by NCEP1, NCEP2, and ERA is good accuracy in terms of seasonal variations, even if annual precipitation pattern is not well produced (Figure 5). However, relative error is 66.0% -


Figure 6. Time series of river flow for each data set.
Table 5. RMSE (m3/s) for simulated river discharge.
Table 6. Relative error (%) for simulated river discharge.
Table 7. Water balance error (%) for simulated river discharge.
157.9 % and water balance error is −2.4% - 32.7% even in calibration period (Table 6 and Table 7). And it is found that it is difficult to use these data sets in actual applications (e.g., water resources planning, construction, future prediction and so on). On the other hand, simulation results by GPCP are quite good agreement in hydrograph shapes. In terms of three evaluations (RMSE, Relative error, water balance error), the results of GPCP is the best performance in all except water balance error of validation period. Relative error is 43.1% in calibration and 46.6% in validation. Although observed data are not completely used in GPCP simulations, its accuracy is extremely good and it is quite surprising. Moreover, the simulation results done by OBS (observed precipitation at Tamale city and ERA-Interim evaporation) are the worst results among all data sets used in this study. It is found that only one observed precipitation datum does not represent spatial variability of rainfall in the basin.
The correlation coefficient between GPCP and observed data in monthly is 0.79 (Figure 3) and the correlation coefficient between GPCP and observed data in annual is 0.70 (Figure 5). Moreover, time series of annual rainfall were quite well reproduced by GPCP (Figure 4) and time series of river flows were quite well reproduced by the combination of GPCP and ERA-Interim (Figure 6). From these results, precipitation of GPCP and evaporation of ERA-Interim make good performance in rainfall-runoff analysis in data-scarce basin that use meteorological data cannot be used at all.
5. Conclusion
The utility of reanalysis data and global precipitation data were examined in the rainfall-runoff analysis for an ungauged basin. NCEP1, NCEP2, ERA-Interim, and GPCP data were compared with corresponding observed precipitation data. Although the reanalysis data such as NCEP1, NCEP2, and ERA had fair seasonal accuracy, annual variations were not reproduced in these data. However, GPCP data, which are based on remote sensing data, had good seasonal accuracy and reproduced annual variations, making it the best among the data sets examined. Furthermore, five pattern data sets were used as input data to a hydrologic model with HYMOD, which is a water balance model, and with WTM, which is a river model; thereafter, the hydrologic model was calibrated for each data set, and river flows were simulated. The results were evaluated by considering the root-mean-square error, relative error, and water balance error. The results indicate that the combination of GPCP precipitation and ERA evaporation data was the best in terms of most evaluations. The relative errors in the calibration and validation periods were 43.1% and 46.6%, respectively. Moreover, the results for the GPCP precipitation-ERA evaporation were better than those for the combination of observed precipitation and ERA evaporation. It was found that GPCP precipitation data and ERA evaporation data are very useful in an ungauged basin water balance analysis.
Acknowledgements
This research was partly supported by Japan Society for the Promotion of Science (JSPS) Grants-in-Aid Nos. 16380164 and 19208022. This study has been implemented as a part of the international research project entitled “Development of Rice Production Technologies in Africa” conducted by Japan International Research Center for Agricultural Sciences, Japan. The authors would like to extend their thanks to Dr. Stephen K. Nutsuga, Director, SARI for his meticulous consultation, and Mr. YahayaInusah and Mr. AlhassanZakaria who are principal technical officers in SARI for their dedicated assistance.
Cite this paper
YoichiFujihara,YukiyoYamamoto,YasuhiroTsujimoto,Jun-IchiSakagami, (2014) Discharge Simulation in a Data-Scarce Basin Using Reanalysis and Global Precipitation Data: A Case Study of the White Volta Basin. Journal of Water Resource and Protection,06,1316-1325. doi: 10.4236/jwarp.2014.614121
References
- 1. Haddeland, I., Lettenmaier, D.P. and Skaugen, T. (2006) Effects of Irrigation on the Water and Energy Balances of the Colorado and Mekong River Basins. Journal of Hydrology, 324, 210-223.
http://dx.doi.org/10.1016/j.jhydrol.2005.09.028 - 2. Hanasaki, N., Kanae, S. and Oki, T. (2006) A Reservoir Operation Scheme for Global River Routing Models. Journal of Hydrology, 327, 22-41.
http://dx.doi.org/10.1016/j.jhydrol.2005.11.011 - 3. Siebert, S. and Doll, P. (2010) Quantifying Blue and Green Virtual Water Contents in Global Crop Production as well as Potential Production Losses without Irrigation. Journal of Hydrology, 384, 198-217.
http://dx.doi.org/10.1016/j.jhydrol.2009.07.031 - 4. Arnold, J.G., Srinivasan, R., Muttiah, R.S. and Williams, J.R. (1998) Large Area Hydrologic Modeling and Assessment, Part 1: Model Development. Journal of the American Water Resources Association, 34, 73-89.
http://dx.doi.org/10.1111/j.1752-1688.1998.tb05961.x - 5. Sivapalan, M., et al. (2003) IAHS Decade on Predictions in Ungauged Basins (PUB), 2003-2012: Shaping an Exciting Future for the Hydrological Sciences. Hydrological Sciences Journal, 48, 857-880.
http://dx.doi.org/10.1623/hysj.48.6.857.51421 - 6. Lenters, J.D., Coe, M.T. and Foley, J.A. (2000) Surface Water Balance of the Continental United States, 1963-1995: Regional Evaluation of a Terrestrial Biosphere Model and the NCEP/NCAR Reanalysis. Journal of Geophysical Research, 105, 22393-22425.
http://dx.doi.org/10.1029/2000JD900277 - 7. Betts, A.K., Ball, J.H. and Viterbo, P. (2003) Evaluation of the ERA-40 Surface Water Budget and Surface Temperature for the Mackenzie River Basin. Journal of Hydrometeorology, 4, 1194-1211.
http://dx.doi.org/10.1175/1525-7541(2003)004<1194:EOTESW>2.0.CO;2 - 8. Su, F., Adam, J.C., Trenberth, K.E. and Lettenmaier, D.P. (2006) Evaluation of Surface Water Fluxes of the Pan-Arctic Land Region with a Land Surface Model and ERA-40 Reanalysis. Journal of Geophysical Research, 111, D5.
http://dx.doi.org/10.1029/2005JD006387 - 9. Bromwich, D.H., Fogt, R.L., Hodges, K.I. and Walsh, J.E. (2007) A Tropospheric Assessment of the ERA-40, NCEP, and JRA-25 Global Reanalyses in the Polar Regions. Journal of Geophysical Research, 112, D10111.
http://dx.doi.org/10.1029/2006JD007859 - 10. Biemans, H., Hutjes, R.W.A., Kabat, P., Strengers, B.J., Gerten, D. and Rost, S. (2009) Effects of Precipitation Uncertainty on Discharge Calculations for Main River Basins. Journal of Hydrometeorology, 10, 1011-1025.
http://dx.doi.org/10.1175/2008JHM1067.1 - 11. Getirana, A.C.V., Espinoza, J.C.V., Ronchail, J. and Filho, O.C.R. (2011) Assessment of Different Precipitation Datasets and Their Impacts on the Water Balance of the Negro River Basin. Journal of Hydrology, 404, 304-322.
- 12. Kotsuki, S. and Tanaka, K. (2013) Uncertainties of Precipitation Products and Their Impacts on Runoff Estimates through Hydrological Land Surface Simulation in Southeast Asia. Hydrological Research Letters, 7, 79-84.
http://dx.doi.org/10.3178/hrl.7.79 - 13. Wagner, S., Kunstmann, H. and Bardossy, A. (2006) Model Based Distributed Water Balance Monitoring of the White Volta Catchment in West Africa through Coupled Meteorological-Hydrological Simulations. Advances in Geosciences, 9, 39-44.
http://dx.doi.org/10.5194/adgeo-9-39-2006 - 14. Shahin, M. (2002) Hydrology and Water Resources of Africa. Water Science and Technology Library, 41, Kluwer Academic Publishers, Dordrecht, Boston, London.
- 15. Onogi, K., Tsutsui, J., Koide, H., Sakamoto, M., S., Kobayashi, Hatsushika, H., et al. (2007) The JRA-25 Reanalysis. Journal of the Meteorological Society of Japan, 85, 369-432.
http://dx.doi.org/10.2151/jmsj.85.369 - 16. Kalnay, E., Kanamitsu, M., Kistler, R., Collins, W., Deaven, D., Gandin, L., et al. (1996) The NCEP/NCAR 40-Year Reanalysis Project. Bulletin of the American Meteorological Society, 77, 437-471.
http://dx.doi.org/10.1175/1520-0477(1996)077<0437:TNYRP>2.0.CO;2 - 17. Kanamitsu, M., Ebisuzaki, W., Woollen, J., Yang, S.K., Hnilo, J.J., Fiorino, M. and Potter, G.L. (2002) NCEP-DEO AMIP-II Reanalysis (R-2). Bulletin of the American Meteorological Society, 83, 1631-1643.
http://dx.doi.org/10.1175/BAMS-83-11-1631 - 18. Dee, D.P., Uppala, S.M., Simmons, A.J., Berrisford, P., Poli, P., Kobayashi, S., et al. (2011) The ERA-Interim Reanalysis: Configuration and Performance of the Data Assimilation System. Quarterly Journal of the Royal Meteorological Society, 137, 553-597.
- 19. Huffman, G.J., Adler, R.F., Morrissey, M., Bolvin, D.T., Curtis, S., Joyce, R., McGavock, B. and Susskind, J. (2001) Global Precipitation at One-Degree Daily Resolution from Multi-Satellite Observations. Journal of Hydrometeorology, 2, 36-50.
http://dx.doi.org/10.1175/1525-7541(2001)002<0036:GPAODD>2.0.CO;2 - 20. Vorosmarty, C.J., Fekete, B.M., Meybeck, M. and Lammers, R. (2000) Global System of Rivers: Its Role in Organizing Continental Land Mass and Defining Land-to-Ocean Linkages. Global Biogeochemical Cycles, 14, 599-621.
http://dx.doi.org/10.1029/1999GB900092 - 21. Boyle, D.P., Gupta, H.V. and Sorooshian, S. (2000) Toward Improved Calibration of Hydrological Models: Combining the Strengths of Manual and Automatic Methods. Water Resources Research, 36, 3663-3674.
http://dx.doi.org/10.1029/2000WR900207 - 22. Kollat, J.B., Reed, P.M. and Wagener, T. (2012) When Are Multiobjective Calibration Trade-Offs in Hydrologic Models Meaningful? Water Resources Research, 48, Published Online.
- 23. Vorosmarty, C.J., Moore III, B., Grace, A.L., Gildea, M.P., Melillo, J.M., Peterson, B.J., Rastetter, E.D. and Steudler, P.A. (1989) Continental Scale Models of Water Balance and Fluvial Transport: An Application to South America. Global Biogeochemical Cycles, 3, 241-265.
http://dx.doi.org/10.1029/GB003i003p00241 - 24. Fujihara, Y., Oda, M., Horikawa, N. and Ogura, C. (2011) Hydrologic Analysis of Rainfed Rice Areas Using a Simple Semi-Distributed Water Balance Model. Water Resources Management, 25, 2061-2080.
http://dx.doi.org/10.1007/s11269-011-9796-z - 25. Fujihara, Y., Tanakamaru, H., Hata, T. and Tada, A. (2003) Calibration of Rainfall-Runoff Models Using the Evolution Strategy. Proceedings of the 1st International Conference on Hydrology and Water Resources in Asia Pacific Region, 2, 885-890.
- 26. Fujihara, Y., Tanakamaru, H., Hata, T. and Tada, A. (2004) Performance Evaluation of Rainfall-Runoff Models Using Multi-Objective Optimization Approach. Proceedings of the 2nd International Conference on Hydrology and Water Resources in Asia Pacific Region, 2, 575-582.
NOTES

*Corresponding author.