Journal of Water Resource and Protection
Vol. 3 No. 8 (2011) , Article ID: 6988 , 6 pages DOI:10.4236/jwarp.2011.38072
Groundwater Potential on the Jos-Bukuru Plateau, North Central Nigeria, Using Lineaments from Gravity Measurements
Department of Geology, University of Maiduguri, Maiduguri, Nigeria
E-mail: solomonnyusuf@yahoo.com
Received May 8, 2011; revised June 13, 2011; accepted July 18, 2011
Keywords: Groundwater Potential, Residual Anomaly, Lineament, Bin Size, Closure
ABSTRACT
The rocks of the Jos-Bukuru area in North Central Nigeria is characterized by negative and positive gravity residual anomalies ranging from –25 to +20 mGals. Lineaments were extracted from the gravity residual anomaly map for the purpose of assessing the groundwater resources in the area. The region is marked by more than one set of lineaments, each with its distinctive orientation and probably spacing. Lineaments shorter than 20 km in length are shallow structures suitable for this exercise because of their importance in groundwater recharge, transmission and discharge. In a bin size of 15˚ one major and one minimum striking directions between 000˚ and 030˚ were obtained. The major type lies between 000˚ and 015˚, while the minimum one is oriented within the 015˚ and 030˚ direction. These directions correspond to the stress axis of the essentially north—south trending geological structures of Nigeria. Invasions of mineralizing fluids might had sealed some of the joints and other fractures, however where the open spaces are not sealed, weathering and erosion widen and deepened the joints paving routes for surface water flows and direct seepage into the underlying strata. On the lineament density and lineament intersection maps the closures suggest probable discontinuity of the aquifer units. On this basis of the lineament density and the lineament intersection results, the area was divided into three hydrogeological zones. Site 1 is considered most favourable for water well development, while site 3 may result in low yields or even in abortive water wells.
1. Introduction
Internal movements within the earth generate stresses that are capable of deforming rocks. The deformation occurs in brittle ways, where the rocks change shape by fracturing. Joints are the most common fractures [1]. Virtually every rock exposure has joints in it. Joints and other geological structures are linear structures or lineaments. The presence of these geological structures in rocks favours migration and trapping of fluids on the surface or within the subsurface. One of the main tasks in geology is the recognition of lineaments. The traditional approach involves the inspection of rock outcrops. However, because of their limited breath and continuity many segments of lineaments may be overlooked on the ground. The small and localized effects of such segments exposed discontinuity from one outcrop to another, and are often insufficient to reveal their rectilinear relationship. Because geologic features are often large, structural analyses are conducted on regional scales, to provide a comprehensive look at the extent of faults, lineaments and other structural features. The applications therefore require small-scale imagery to cover the extent of the element of interest.
The study area constituting the Jos-Bukuru Younger Granite complex of north central Nigeria is shown in Figure 1. It is bounded by latitudes 9˚35' N and 10˚05' N and longitudes 8˚46' E and 9˚10' E. The area falls within the Naraguta southeast sheet 189 of the Federal Survey of Nigeria. The present work attempts to identify shallow geological structures that are important for migration and accumulation of groundwater. It also attempts identifying new optimal drilling sites for future boreholes.
2. General Geology of the Younger Granites
Nigeria has about fifty separate Younger Granites com-

Figure 1. Location map of the study area.
plexes. The individual massifs range in size from smaller stocks of less than 2.59 km2 to 1036 km2. Their outlines are either circular or elliptical. Several cycles of intrusions occur within one complex. The sizes of many of the structures are due to overlapping and superposition of separate intrusive cycles. The Younger Granites were preceded by extensive acid volcanism and emplaced by ring faulting and block subsidence. Granites and rhyolites underlay more than 90 percent of the total area of the Younger Granite province. Intermediate and basic rocks occur in many complexes.
Emplacement of the Younger Granites is associated with epeirogenic uplift [2]. Their age is Jurassic. The Older Granites and accompanying metamorphism of the basement represent the Pan African orogeny in Nigeria [3,4]. Volcanic rocks in most of the complexes have either been obliterated by later granite intrusions or eroded to the extent that their original pattern of distribution is conjectural. Where the lavas are well preserved they are invariably confined within the major peripheral ring faults.
Extensive and frequently overlapping zones of ring fracturing determined the form and distribution of most of the complexes. The emplacement of ring-dykes within circular and polygonal features initiated many of the intrusive cycles. The emplacement of the ring-dykes directly succeeded the volcanic cycle and many of the initial ring-fractures, which controlled the distribution of the volcanic eruptions, also served as the loci of the ringdykes. Polygonal forms of the ring dykes predominate among the narrower types that transgressed the migmatites and metasediments of the basement complex. Here strong structural patterns exerted a measure of control on the fracture directions. The ring dykes are generally steep structures and contact dipping outwards at angles less than 80˚ are uncommon.
3. Methodology
The main source of data for this study is a Bouguer anomaly map of the Jos-Bukuru Younger Granite complex and its environment on sheet 168 Naraguta southeast. Third order regional polynomial trend surface was fitted to the Bouguer anomaly field in an [5] environment to obtain a general surface view of the residual anomaly. The same software was used in digitizing, extracting and proper positioning of prominent features using the Universal Transverse Mercator (UTM) system. The [6,7] software were used to compose the maps created for appreciable presentation and to plot the rose diagram.
4. Residual Anomalies
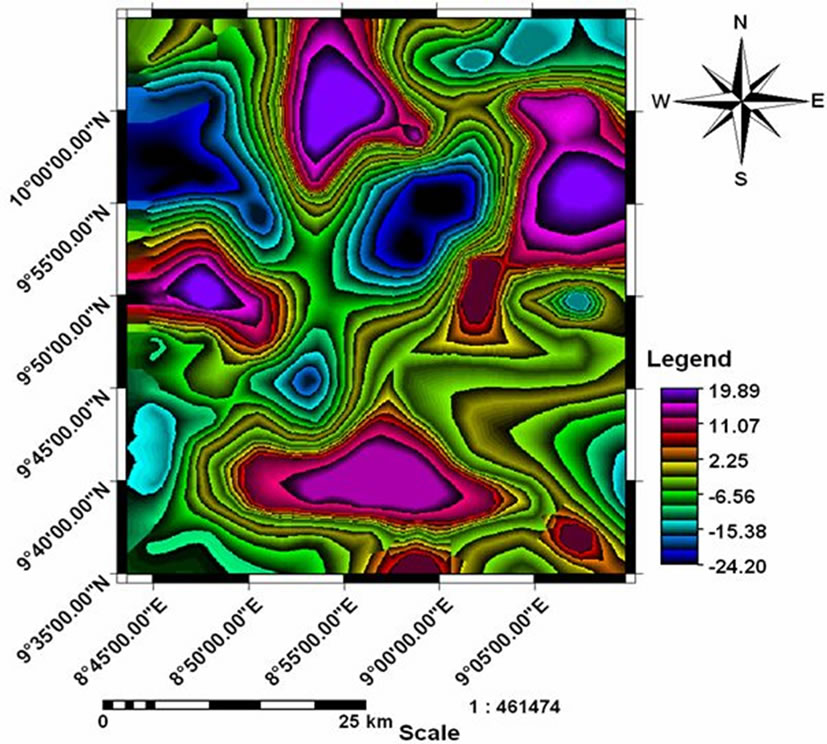
Residual mapping eliminates or reduces to minima the effects of deep-seated, non-commercial sources with as little distortion of the resultant anomaly as possible. The definition of the regional anomaly field from the Bouguer anomaly field was achieved by fitting third order polynomial trend surface in the [5] environment. Figure 2 shows the map of the residual anomaly in raster and digital elevation visualization forms after subtracting the regional anomaly field from the Bouguer anomaly field. The field is characterized by both negative and positive anomalies between –25 to +20 mGals. The negative values probably correspond to areas underlain by the intrusive Younger Granite rocks. The lowest negative values correspond to the outcropped Jos-Bukuru Younger Granite complex. The positive values may explain areas underlain by volcanic rocks [8]. Closures of the residual
 (a)
(a)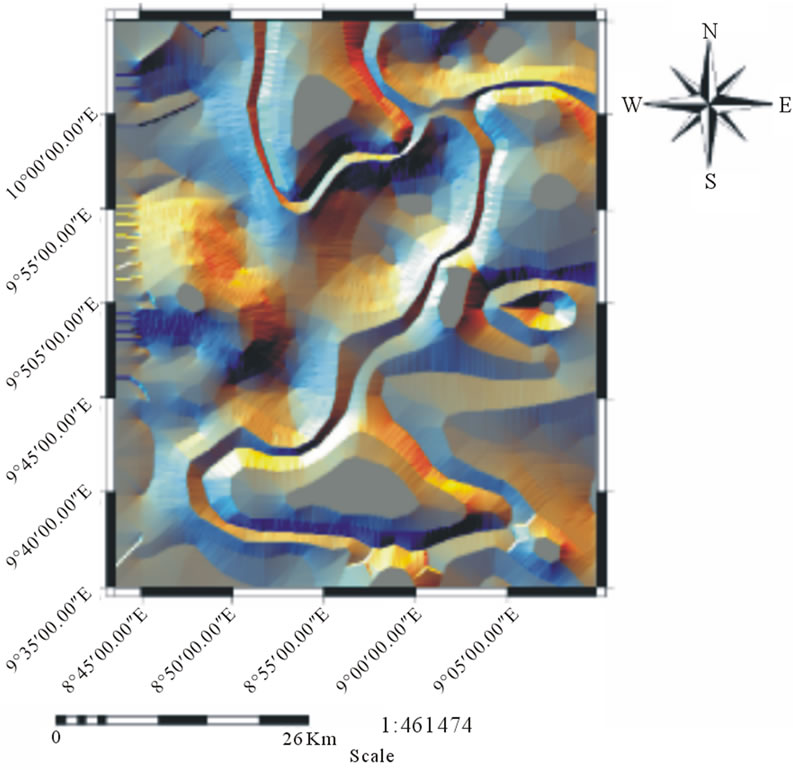 (b)
(b)
Figure 2. Residual anomaly field. (a) Raster, (b) Digital elevation model.
anomaly map are oriented along the north-south, northeast-southwest, north northwest-south southeast and eastwest directions.
5. Lineaments
Extractions of the lineaments from the residual anomaly map were performed in an [5] environment. The result is shown in Figure 3.
6. Lineament Direction Histogram
Figure 4 shows the magnitudes of individual lineament orientation shorter than 20 km long. The lengths of the lineaments are plotted against their respective directions. The gaps in the histogram indicate zones where individual lineament segments exceeded 20 km long. Such lineaments are deep-seated in origin that may represent regional subsurface faults. They are thus considered unsuitable for hydrogeological purposes.
7. Rose Diagram
The orientation data collected during the course of fracture analysis are summarized on the rose diagram, that is, on the two-dimensional plot shown in Figure 5. In preparing the rose diagram, the trend and/or strike data were organized into bin sizes of 15˚. Each bin size specifies the size of the angular sampling. A family of concentric circles provides scaled control for the number of fractureorientation readings that occupy each bin size. For each bin, the number of points from the selected data column controlled the bar length. A mirror image of the data is plotted in two directions by selecting bi-direction in the rose diagram plot properties menu.

Figure 3. Lineaments in the study area.

Figure 4. Individual fracture orientation histogram.
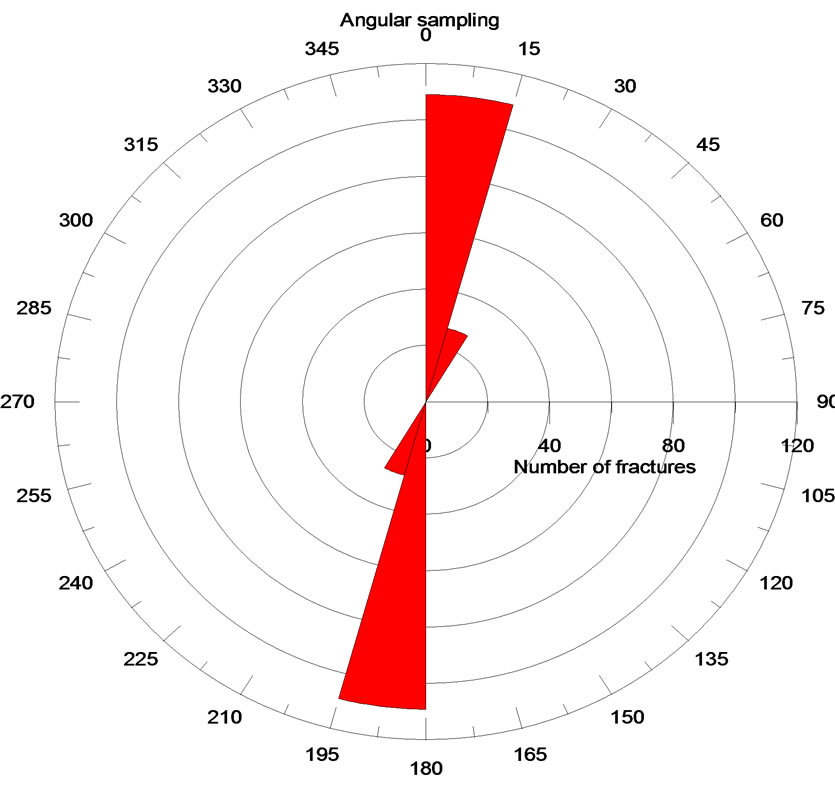
Figure 5. Bidirectional rose diagram.
8. Isolinear Contour (Lineament Density) Map
The isolinear contour or lineament density map displays the distribution of the lineaments in two-dimensional contour maps. The area was divided into equal area grids. The number of lineaments in each grid were counted and recorded. A lineament that extends beyond a domain boundary is counted within every grid area crossed. The numbers are assigned to the centre of each and then contoured at an appropriate interval depending on the density of the lineament. The lineament density image is shown in Figure 6.
9. Lineament Intersection Contour Map
Like the lineament density map, lineament intersection contour map was prepared by dividing the study area into equal grids. The number of intersections within each grid were counted, recorded and contoured. The result is shown in Figure 7.
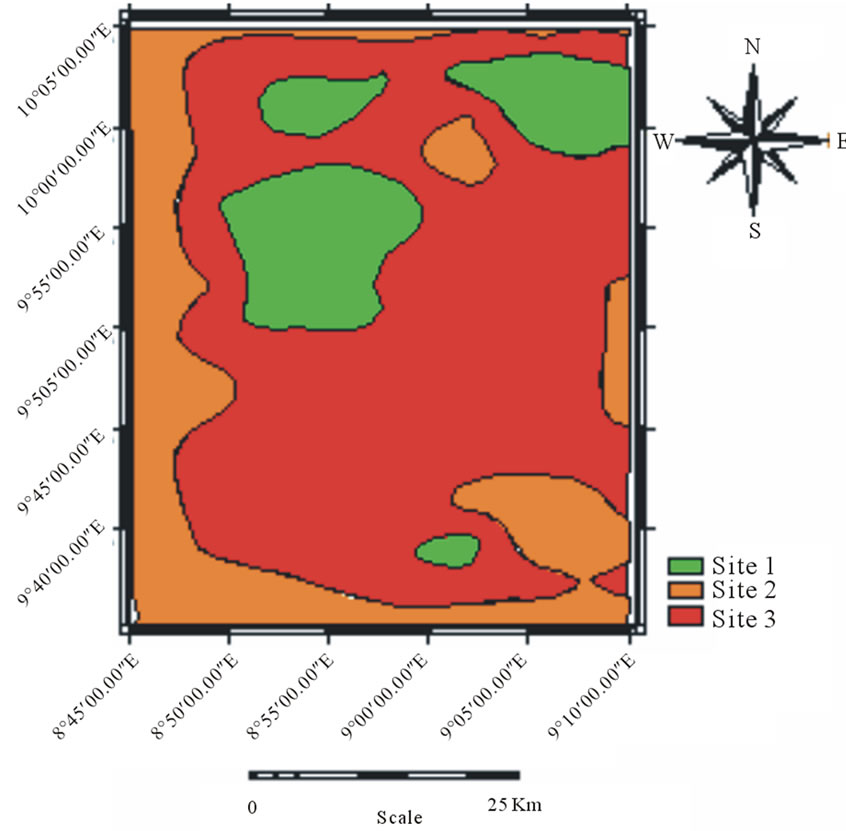
10. Boreholes’ Drilling Sites
Optimal drilling sites for future boreholes were deducted from the results of the analyses of the lineament density and lineament intersection maps. The area was classified into three drilling sites in order of priority (Figure 8).
11. Discussion
The occurrence of groundwater in areas underlain by crystalline rocks depends on the thickness of the overburden or the presence of fractures that are capable of
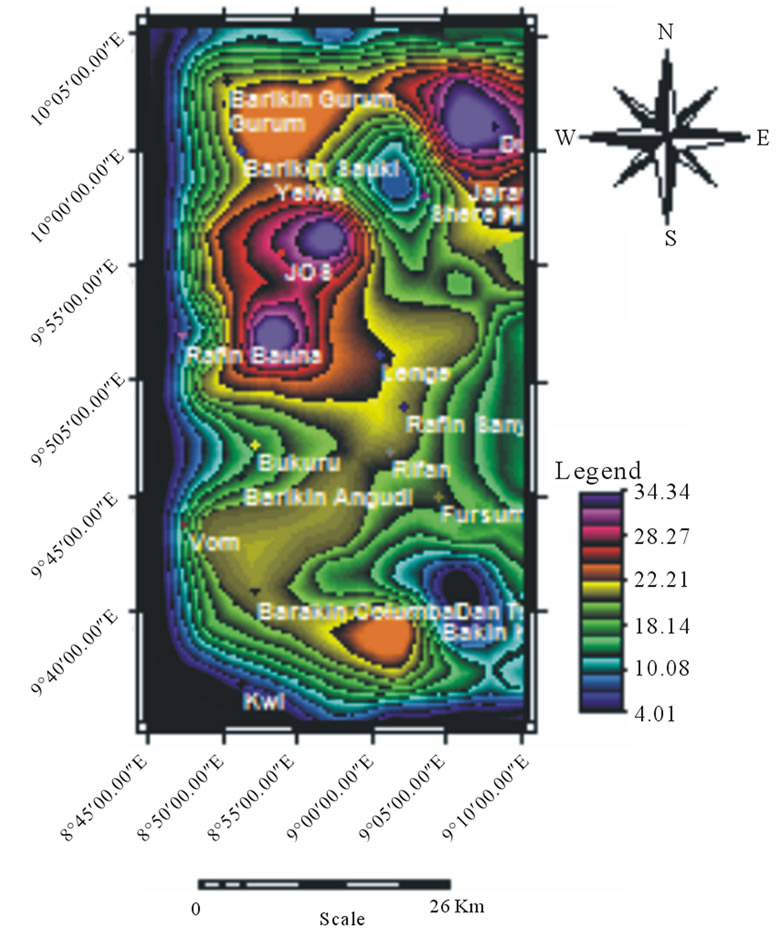
Figure 6. Lineament density.
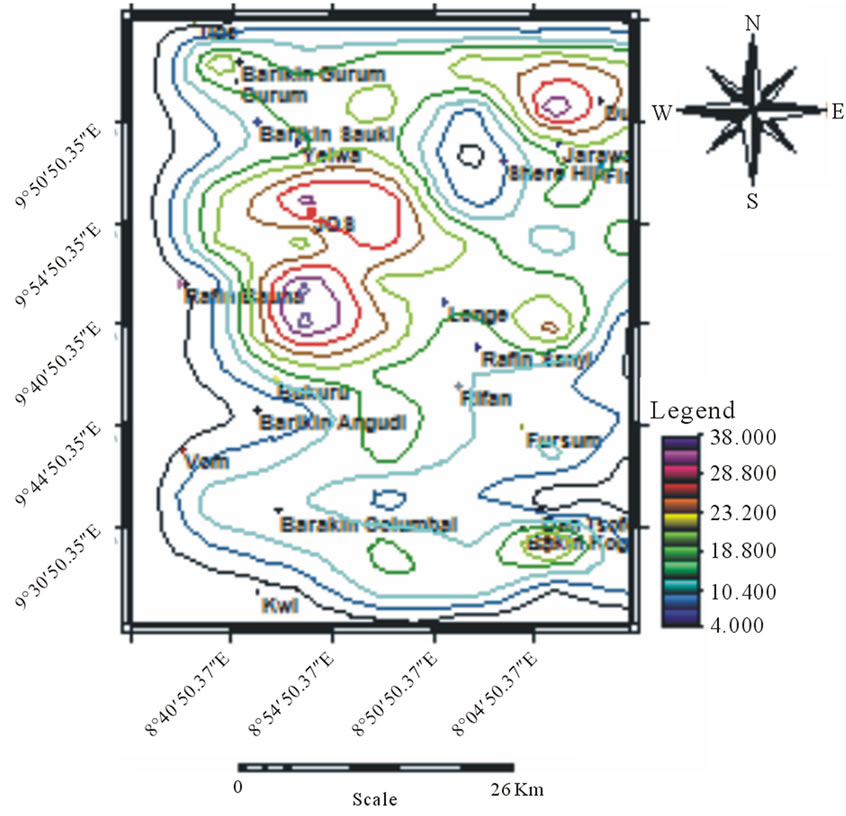
Figure 7. Lineament intersection.
holding water. The storage of the groundwater is often confined to the fractures and the fissures in the weathered zone [9]. Crystalline rocks generally have low porosity and low permeability; however, substantial yield could be obtained from the aquifers with effective exploration and exploitation techniques. The aquifer deposit usually contains gravels, sands, silts and clays. Very often the gravels and the sands are water bearing, hence they are the main targets for development of groundwater.
 (a)
(a)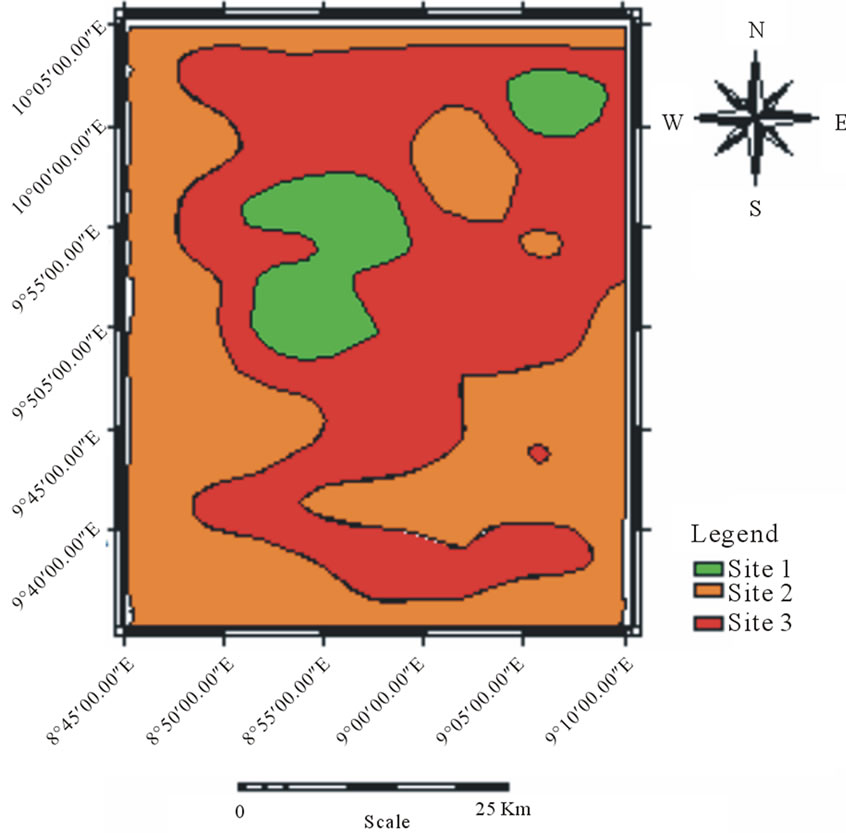 (b)
(b)
Figure 8. Optimal drilling sites. (a) Lineaments density; (b) Lineament intersection.
A good proportion of the water supply is derived from boreholes, supplemented by hand dug wells which tap the water table aquifer in the elluvium. Majority of these source of water supply are seasonal thereby making the communities to look for alternative water supply along stream beds. During this period livestock are watered from shallow pits dug in the stream channels.
In Figure 3, the extracted lineaments contain both major and minor ones. The major lineaments in this context comprise features longer than 20 km. Such structural features are interpreted as being deep seated and of tectonic in origin. The minor lineaments attain distances lower than 20 km. They are shallow structures and consist essentially of joints. The individual joints are only metres or tens of metres in length and spacing; however, they form in sets that can have regional continuity. A given outcrop area or region is typically marked by more than one set of joints, each with its own distinctive orientation and spacing. The great number of the lineaments in Figure 3 may be attributed to the contributions of these structures as they are among the most abundance geologic structures. Joints have the effects of subdividing rock bodies into myriad faceted chunks and pieces, each of which “joins” to its neighbour along joints, sometimes resembling blocks set side by side Where the open spaces are not sealed by mineralizing solutions weathering and erosion may widen and deepened the joints creating deep channels which eventually become routes for surface and subsurface water down slopes.
The degree of importance of a peak or maximum in an azimuth—frequency diagram may be attributed to the length (intensity or frequency). The longer the peak the more significant it is in geology, in that there is concentration of lineaments in that sector. Also a long narrow peak may indicate that such a set is directionally well defined. The shorter a lineament is the lower its tendency of being of deep seated origin. Thus Figure 4 depicts lower possibility of deeper structures. This may favour groundwater accumulation.
The bidirectional rose diagram shown in Figure 5 revealed the strikes of the lineaments in the area within 000˚ and 030˚. Longer lineaments lie essentially between 000˚ and 015˚ and shorter ones are within the 015˚ and 030˚ direction. Linear structures in Nigeria reported by [10-13] are generally oriented in the northsouth, northeast-southwest, northwest-southeast and sometimes eastwest trends.
High density concentration of the lineaments is associated with great number of the emplacement of the granites [14], and the north northeast—south southwest trend may suggests their orientation in that direction. Smaller intrusions are characterized by low concentration of lineaments. The frequency of the intersection of the lineaments probably indicates the intensity of the intrusions. High intensity closures are suitable sites for water well development.
Though the lineaments when present favour the occurrence of groundwater in crystalline terrains because they control groundwater recharge, transmission and discharge, however [15] pointed out that not every lineament is related to fracture or to groundwater. Lineaments important to the occurrence of groundwater suggested by [16] and supported by [17] are tensional fractures which are related to the main direction of tectonic stress, enlarged by brecciation and weathering.
Since some of the lineaments fall within the range of strikes exhibited by the maxima [18] of the essentially north—south trending geological structures, they are of considerable importance in hydrogeology. Some of the lineaments are drainage lines, that is, they are structurally controlled.
In Figure 8(a) good water wells may be expected around the northeast, north, west central and a small portion of the south. Second category boreholes may be sited at the western and parts of the northeast, east and southeast. Site 3 which covered more than half of the study area is unfavourable for boreholes as poor or abortive water wells are likely to result. Map for optimal drilling sites produced from the intersection of the lineaments in Figure 8(b) shows Site 1, located at the northeast and the west central parts suitable for water wells development. The second favoured area is around the western, eastern, southern and parts of the northeast, while site 3 is the least favoured area.
12. Conclusions
The Jos-Bukuru Granite complex is characterized by negative and positive residual anomalies. Negative values are underlain by granitic rocks. Lineaments extracted from gravity residual anomaly map show concentration of both major and minor lineaments. Lineaments shorter than 20 km long are structurally shallower in character and have hydrological and hydrogeological significance. The patterns of the closures and the availability of shallow water along stream channels suggest probable localization of the aquifers. On the basis of lineament density and lineament intersection, Site 1 may be considered to possess highest groundwater potential while Site 3 is not favourable for groundwater abstraction.
REFERENCES
- A. Maltman, “Geological Maps—An Introduction,” John Wiley & Sons Ltd, Baffins Lane, Chichester, West Sussex, England, 1990.
- D. C. Turner, “Structure and Petrology of the Younger Granite Ring Complexes,” In: C. A Ogbe, Ed., Geology of Nigeria, Rock View International, France, 1989, pp. 175-190.
- R. R. E. Jacobson, W. N. MacLeod and R. Black, “Ring Complexes in the Younger Granite Province of Northern Nigeria,” Geological Society of London, Memoirs, Vol. 1, 1958, pp. 5-72.
- O. Van Breeman and P. Bowden, “Sequential Age Trend for some Nigerian Mesozoic Granites,” Nature Physical Sciences, Vol. 242, 1973, pp. 9-11.
- ILWIS, Version 3.3, Academic, ITC (RSG/GSD), Netherlands, 2005.
- Golden Software, Surfer 8, Golden Software Inc., Golden, CO 80401 2003.
- Golden Software, Grapher5, Golden Software Inc., Golden, CO 80401, 2004.
- S. C. Alkali and S. N. Yusuf, “Gravity Study over Jos— Bukuru Younger Granite Complex, North Central Nigeria,” Archives of Physics Research, Vol. 1, No. 4, 2010, pp. 178-191.
- A. Onugba and O. M. Eduvie, “Hydrogeology of Nigeria. Paper on Groundwater Workshop,” Organized by United Nations Children’s Fund, Jos, 2003, p. 20.
- J. B. Wright, “Fracture System in Nigeria and Initiation of Fracture Zones in the South Atlantic,” Tectonophysics, Vol. 34, 1976, pp. 43-47. doi:10.1016/0040-1951(76)90093-7
- P. O. Oluyide, “Structural Trends in the Nigerian Basement Complex. Precambrian Geology of Nigeria,” Geological Survey of Nigeria Publication, Kaduna, 1988, pp. 93-98.
- A. N. Udoh, “An Interpretation of Satellite Imageries of Nigeria 7˚40' N. Precambrian Geology of Nigeria,” Geological Survey of Nigeria Publication, Kaduna, 1988, pp. 99-102.
- P. I. Olasehinde and M. O. Awojobi, “Geological and Geophysical Evidences of a North—South Fracture System East and West of the Upper Gurara River in Central Nigeria,” Water Resources Journal, Nigerian Association of Hydrogeologist, Vol. 15, 2004, pp. 33-37.
- I. B. Odeyemi, Y. B. Anifowose and Y. A. Asiwaju-Bello, “Multi-Technique Graphical Analyses of Fractures from Remote Sensing Images of Basement Regions of Nigeria,” Journal of Mining and Geology, Vol. 35, No. 1, 1999, pp. 88-105.
- C. Travaglia, “Groundwater Assessment in Hard Rocks. Case Histories: Upper Volta and the People Republic of Yemen,” Report of the 8th International FAO Training Course on Application of Satellite to Water Resources, Rome, 18 September 1983, p. 158.
- F. Caponella, “Remote Sensing Interpretation For GroundWater Surveying,” Report of the 13th Un/FAO/ UNESCO International Training Course, RSC series, Rome, Vol. 50, 1989, pp. 281-292.
- E. P. Dainelli, “Airborne Photographic Methods, Remote Sensing Application to Water Resources,” Report of the 13th Un/FAO/UNESCO International Training Course, RSC Series, Rome, Vol. 50, 1989, pp. 11-31.
- A. E. Bala, O. Batelaam and F. Smedt, “Using Landsat 5 and Imagery in the Assessment of Groundwater Resources in Crystalline Rocks around Dutsin-Ma, Northwestern Nigeria,” Journal of Mining and Geology, Vol. 36, No. 1, Nigerian Mining and Geosciences Society, 2000, pp. 65-92.