Journal of Water Resource and Protection
Vol. 1 No. 2 (2009) , Article ID: 615 , 6 pages DOI:10.4236/jwarp.2009.12016
Modeling and Control of pH in Pulp and Paper Wastewater Treatment Process
Shannxi University of Science & Technology, Xi’an, China
Email: kangjiayu@sust.edu.cn
Received March 24, 2009; revised April 12, 2009; accepted April 16, 2009
Keywords: Biological Treatment, pH, MATLAB, Cascade Control
ABSTRACT
Pulp and paper industry is responsible for large discharge of highly polluted effluents, which often be treated by biological treatment process. For biological treatment system, pH is an important environmental factor that can influence the activity of microorganisms. In general, the optimal pH for aerobic processes is around neutral pH (7_7.8) and for the anaerobic process is between 6.8_7.2. The control of pH is a difficult link in the biological treatment system due to its nonlinearity and large time-delay. Aiming at the difficult point in the pH control of the biological wastewater treatment system, a mathematical model of pH control is established in the essay. On this basis, a traditional PID control and a cascade control are adopted to carry out simulation and comparison with MATLAB. The results show that the cascade control has better comprehensive effect in terms of response speed, stability and disturbance resistance.
1. Introduction
Pulp and paper industry is the greatest industrial polluter in terms of wastewater volumes and organic discharges. The general characteristics of the pulp and paper industry effluent can be listed as: 1) high lignin content, 2) high absorbable organic halide concentration, 3) color, 4) low biodegradability which is indicated by their high chemical oxygen demand to biochemical oxygen demand ratios, and 5) potential toxicity problems.
The typical treatment processes for pulp and paper effluents are chemical precipitation, lagooning, activated sludge, and anaerobic treatment. It should be mentioned that the liquors from alkaline pulping, wood resins, and tannins are potentially toxic to methane bacteria. Moreover, the degradation of lignin by the anaerobic consortium is limited to the low molecular weight fraction. Until now aerobic treatment systems are the most widely used method to treat effluents from pulp plants. However when the economic concerns and the rate of treatment are considered, anaerobic treatment is an alternative that must be considered [1].
The anaerobic process has been successfully applied in the treatment of nontoxic and easily biodegradable wastewaters from pulp and paper plants, such as the effluents from mechanical pulping, from paper recycling and from evaporation condensates. In fact anaerobic reactor followed by aerobic reactor is more successful at reducing toxicity [2]. Reductive dechlorination may occur in anaerobic stage and produce less chlorinated organics. These organics may be further biotransformed in conventional aerobic stage.
Biological treatment such as aerobic and anaerobic process is indisputably the most effective, economical way used for treating pulp and paper effluents [2]. In biological treatment living organisms are used for purifying waste, which can be solid, liquid or gas. The substance that is degraded acts as a source of building blocs and/or energy source for the microorganisms so they can fulfill their goal in life, which is to multiply.
There are a lot of factors that influence the well being of microorganisms, such as temperature, pH, nutrient, etc. And pH is one of the most important factors. It should not be allowed to vary too much during a short time period since variations of the pH can be of big influence on the behaviour of bacteria, low pH(<6.8)and high (>8.2) as well as sudden increase or decrease of the pH, should be avoided. In general the optimal pH for aerobic processes is around neutral pH (7_7.8) [2-3] and for the anaerobic process is between 6.8_7.2 [4-5].
For pulp and paper wastewater, pH may vary considerably, depending on the raw material and manufacturing process utilized. For control of the pH in the system, an automatic dosing system is installed and strong acid (HCL) and strong base (NaOH) are adopted as neutralizing liquid in the system.
2. Basis and the Difficult Point of pH Control
As shown in the acid-base titration curve [6], the changes at the two ends of the curve are gentle, that is to say, the pH varies very little with the addition of strong acid (or strong base); however, the sensitivity is very high around the neutral point, and the pH is to change dramatically even when a little strong acid (or strong base) is added in. the sensitivity is very high near the neutral point, while is extremely low at the place far from the neutral point, and it has been proven by experiments that the nonlinearity of a strong acid-strong base neutralization process is more obvious than that of a weak acid-strong base process.
As for the pH control system in biological wastewater treatment, the target range of pH is required to be controlled within 7_7.8 for aerobic processes and 6.8-7.2 for the anaerobic process, which are just located in the vicinity of the neutral point of the titration curve, thus the sensitivity of change is high; on the one hand, a controller is required to have relatively high control precision, on the other hand, control difficulty is raised as the controller becomes more sensitive to lagging.
The pH control of the biological wastewater treatment system is an indispensable measurement item; however, it is difficult to control, for there are numerous phenomena that can not be described quantitatively. The main reasons are as follows:
1) Wastewater from pulp and paper mill may be either acidic or basic at different moments; therefore, two neutralization reagents are needed. The pH in the neutralization reaction has typical nonlinearity [7-8].
2) The acidic and basic ingredients contained in wastewater are complex, which causes the pH curve of the measured object to be difficult to determine.
3) There is pure lagging at the mixing, measuring and other links in the pH control process [9-10], so that the regulated amount fails to reflect the perturbation borne by the system in time. Even if a measuring signal reaches an adjustor and the adjustor receives a regulatory signal to take action instantly, it is not until after a pure lagging period that the regulated amount can be concerned and controlled. Therefore, such a process will inevitably generate a more significant overshoot and a longer control period. The existence of pure lagging also contributes to the difficulty of pH control.
3. Modelling of pH Control System
3.1. Model Building of pH Control Process in the Biological Wastewater Treatment System
For the reasons described above, it is necessary to carry out preliminary model building to a concerned object before a pH control proposal is put forward so as to facilitate the research and to further study the characteristics of the object.
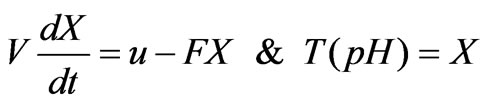
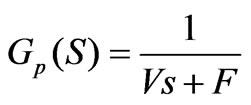
If the relation between the flow rate u of a neutralization flow and the flow rate F of a process flow in the neutralization process is assumed to be that: u«F, the following input/output relation can be worked out [11]:
 (1)
(1)
 (2)
(2)
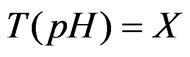
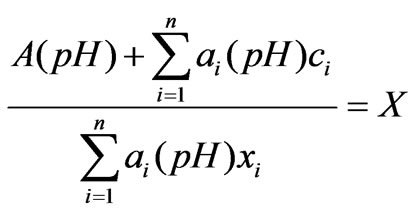
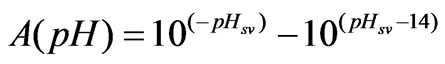
Wherein: F represents the flow rate of the process flow; u represents the flow rate of the neutralization flow; V represents the volume of the preparation pool; X represents the state variable of the model; T (pH) represents the back-titration cure of the process flow, the nonlinearity of the process is just contained in the back-titration cure T (pH) of the process flow, and the T (pH) is related to ingredients and concentration of all chemical substances added in the preparation pool; if all chemical ingredients in the whole system are known, the nonlinearity of the process can be expressed as follows:
 (3)
(3)
Wherein: n represents the number of the ions in the preparation pool, ci represents the ion concentration of the i th kind of process flow, and xit represents the concentration of the i th kind of neutralizing liquid,
 (4)
(4)
 Represents an acid-base weight factor, and it is equal to -1 for strong monacid and +1 for strong monoacidic base. Therefore, when there are only strong acid solution and strong alkaline solution, the concentration of solution can be directly combined; only when there are weak acid and weak base, a weight factor,
 , needs to be multiplied. The required volume of solution when it reaches a set point is determined by a weight sum, that is,
 . The weight sum is named as a strong acid equivalent which can directly reflect the amount of the neutralizing agent required for titrate the pH to a set value, and it can be taken as a control objective and has larger practical significance than the pH.
In the process of neutralization titration, the difference value between an actually measured pH and a set value is in line with a non-linear conversion process, and the numeral value is [12-13]:
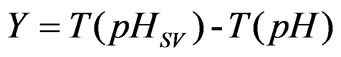 (5)
(5)
The process is dynamic balance output of pH; as long as there is a one-to-one relation between the pH and T (pH), the pH is controlled to be pHsv, which is equivalent to the control of Y, and the Y is set to be 0. In this way, the control problem of pH is converted into a linear problem.
The following study on pH control is based on the Formula (1) and the Formula (2) described above.
4. pH Control
As remarked above, the adjustment of the pH in the an aerobic wastewater treatment is completed in the preparation pool, and strong acid (HCL) and strong base (NaOH) are generally adopted as neutralizing liquid in a project.
The flow chart of pH neutralizing process is shown as Figure 1. In the Figure 1, F represents the flow rate of the process flow;  and
and  represent the flow rate of the neutralizing flow;
  and
and  represent the concentration of the neutralizing flow;
  represent the flow rate of the wastewater in a branch loop of the preparation pool;
  is the flow rate of the swage sent to the reactor.
The concentration of the acid liquor or alkali liquor to be added is calculated and adjusted according to the technology. It is prevented from fluctuating, so that we can focus on the stabilization of the flow rate of acid or base. We can take the acid adding single feeding process when the pH is too high as the study object to carry out further analysis so as to obtain a structural diagram of the system as shown in the Figure 2.
As shown in the Figure 2, the cascade control system forms two closed loops in terms of the structure, the flow loop and the pH loop, which are called auxiliary ring and main ring respectively. The flow PID controller controls the flow control valve according to the pH PID controller, thus ensuring that the pH can still meet the requirements under the condition of feeding disturbance.
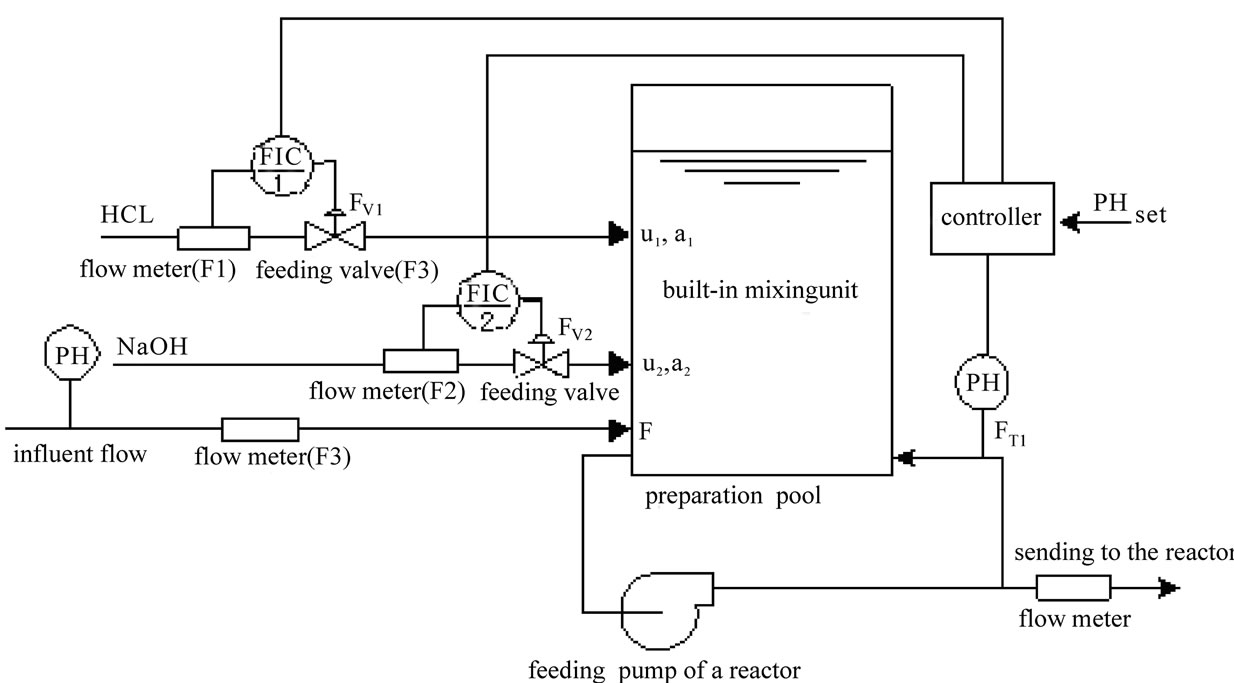
Figure 1. Flow chart of pH neutralizing control system.
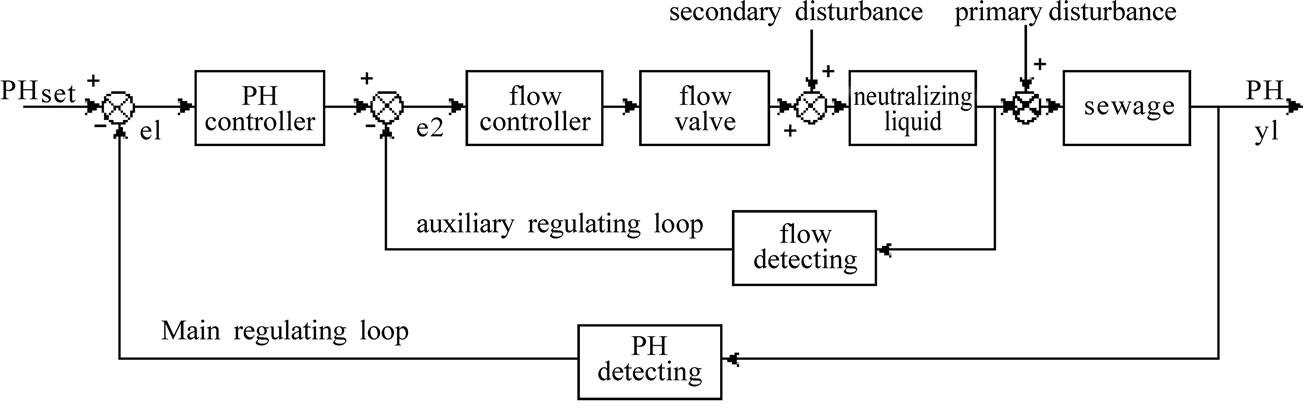
Figure 2. pH cascade control system.
Nevertheless, in the actual production process, it is inevitable that the mixing concentration of the neutralizing liquid has small difference and fluctuation in different times, however, the method described above can effectively eliminate the influence on pH adjustment caused by the fluctuation; as the flow self stabilization system can act quickly, the fluctuation of the concentration of the neutralizing liquid can be eliminated in a short time.
5. Simulation of the pH Cascade Control System
5.1. Building a Simulation Model
1) Model building of a main controlled object and an auxiliary controlled object in the cascade loops According to the preliminary model building of the neutralization process in section II, a first order model can be obtained:
The study on the pH control is based on the above two formulas; similarly, let’s take the acid adding process when the pH is too high as an example. The formulas are subject to Laplace transformation to obtain the following transfer function:
 (6)
(6)
Given the pure lagging caused by the pipeline and the detection process of a measuring instrument as well as a delay factor, the transfer function is converted into:
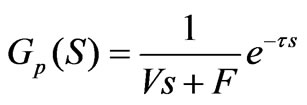 (7)
(7)
The Formula (7) shows the model of the pH neutralizing process; according to the actual situation, the parameters in the formula are respectively as follows:

All the parameters are written into the formula which is simplified into a standard form:
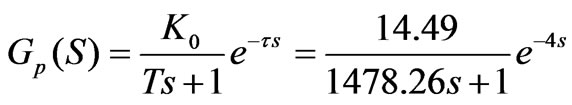 (8)
(8)
As for the flow adjusting process in the cascade control loops, the objective transfer function is as:
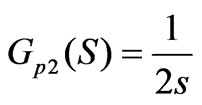 (9)
(9)
2) Selection of a main adjuster and an auxiliary adjuster in the cascade loops In the cascade control system, the main adjuster and the auxiliary adjuster have different tasks; their type selection, that is, the selection of adjusting action law, also have different requirements. The task of the auxiliary adjuster is to take quick action to offset the secondary disturbance in the auxiliary ring, and non-error adjustment of auxiliary parameters is not required, thus a P adjuster is adopted in the model building. However, the task of the main adjuster is to accurately maintain the regulated variable to meet production requirements, therefore, a PI adjuster is selected to eliminate residual error.
5.2. Setting the Parameters of the Adjusters
A step-by-step method is employed for the parameter setting of the cascade loop; in the method, the main ring and the auxiliary ring are set in sequence, and then the process is repeated to approach the optimal setting. The basic steps thereof include: setting the auxiliary ring, cutting off the main ring, working out the setting parameters of the auxiliary adjuster according to the setting method of a single loop, taking the just set auxiliary ring as a link of the main ring, and working out the setting parameters of the main adjuster according to the setting method of a single loop.
The relevant parameters of the main adjuster obtained through the method described above are as follows:
The parameter of the auxiliary adjuster is: ;
;
The parameter of the main adjuster is: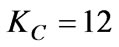 ,
, .
.
According to above parameters, we carry out the following simulation; wherein the ordinate axis represents pH, the horizontal axis represents time, and the unit is second (s):
1) Only under the action of PID, the step response curve of the pH control loop is in line with the Figure 3: From the Figure 3, we can know the overshoot  of the system is relatively large, while the adjusting time ts1 is relatively long.
2) Only when the pH control loop is under the action of PID and is affected by inlet water pH, fluctuation of the flow rate of the neutralizing fluid, and other disturbing factors, the system response cure is as shown in the Figure 4: We can learn that disturbance resisting capacity of the system is rather poor; when disturbed, the overshoot basically remains unchanged; however, the system still cannot enter a steady state 300 s later.
Figure 3. Simulation response curve of PID control
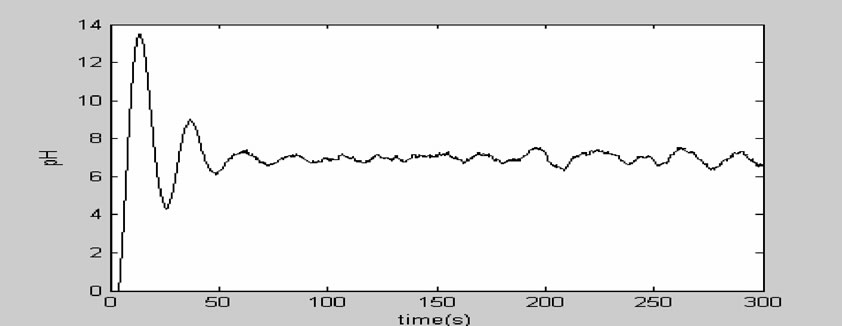
Figure 4. Simulation response curve under PID control when disturbed
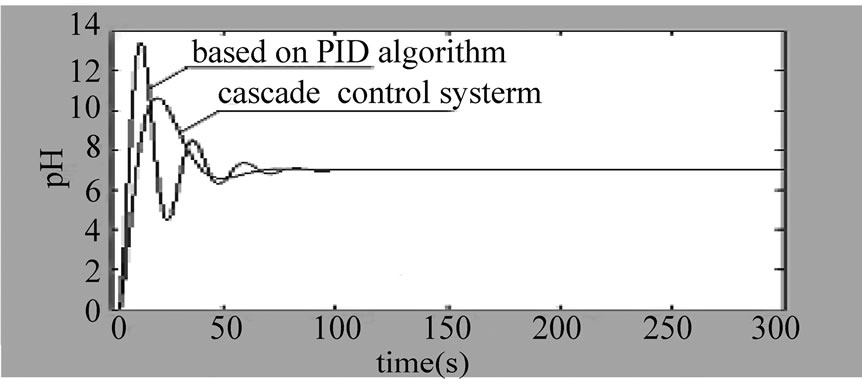
Figure 5. The curve of cascade control system

Figure 6. The curve of cascade control system with interference
3) The system step response curve under the action of the cascade control loop based on PID is as shown in the
Figure 5. We can know that: the overshoot of the cascade control system based on PID is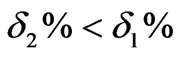 , and the adjusting time ts2 is significantly shortened ts2 < ts1.
4) When the pH control system is under the action of the cascade control loop based on PID and is affected by inlet water pH, fluctuation of the flow rate of the neutralizing fluid, and other disturbing factors, the system response cure is as shown in the Fig.6: We can know that the anti-disturbing capacity of the system is dramatically improved, and especially has strong inhibiting function on the secondary disturbance in the flow control loop. Though it still takes a long time for the system to completely enter a steady state after being disturbed, the fluctuation is small and is basically within the acceptable range in an industrial site.
6. Conclusions
From the above simulation figure, we can know that: the cascade control system based on PID can contribute to excellent control effect and facilitate engineering application. Compared with a simple PID control, not only the capacity adaptive to the change of the controlled parameters is strong, but also good control effect can still be achieved when the structure of the objective model is intensively disturbed. The step response curve of the cascade control system based on PID has the advantages of quick raising, short adjusting time, high adjusting precision, excellent steady state performance and small overshoot, and can competently fulfill the automatic control of pH. The runtime curve of the pH control system used in a pulp and paper wastewater treatment process is showed in Figure 7. We can know that it worked well.
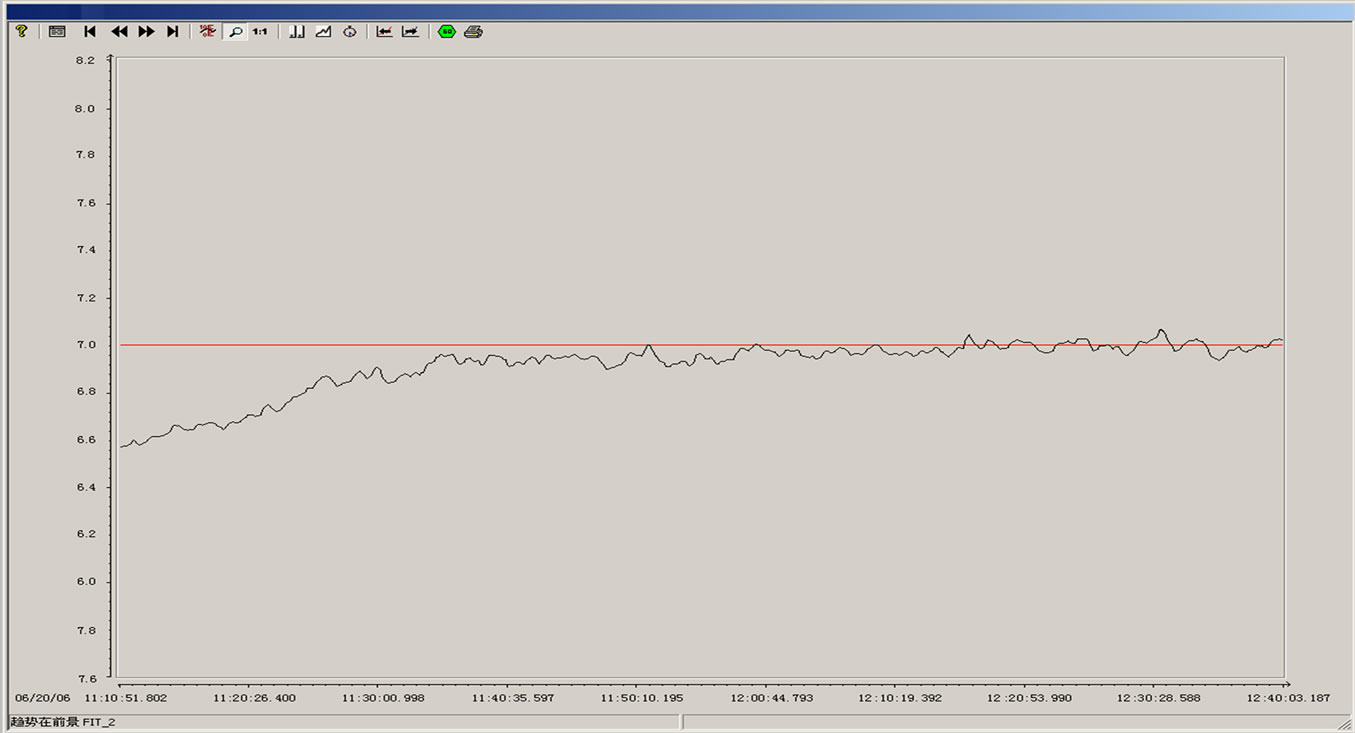
Figure 7. The runtime curve of the pH control system.
REFERENCES
- U. Tezel, E. Guven, T. H. Erguder, and G. N. Demirer, “Sequential (anaerobic/aerobi) biological treatment of dalaman SEKA pulp and paper industry effluent,” Waste Management, Vol. 21, pp. 717-724, 2001.
- X. F. Yang, “Wastewater treatment in pulp paper making sector,” Chemical Industry Press, Beijing, 2001.
- Biothane System International, Enclosure F: Aerobic Microbiology [M], 2006.
- Biothane System International, Enclosure F: Anaerobic Microbiology [M], 2006.
- “An expert system for monitoring and diagnosis of anaerobic wastewater treatment plants,” Water Research, Vol. 36, pp. 2656-2666, 2002.
- S. B. Wu, “Water pollution control and treatment technology in the paper industry,” Chemical Industry Press, Beijing, Vol. 5, 2001.
- J. F. Bieteaua, “Modelling of anaerobic digestion in a fluidised bed with a view to control,” Biochemical Engineering Journal, Vol. 24, pp. 255-267, 2005.
- G. Ulvsson and B.Newell, “The model building, diagnosis and control of the wastewater treatment system,” Chemical Industry Press, Beijing, 2004.
- J. C. Wang and H. Y. Zhu, “Chemical process control [M],” Chemical Industry Press, Beijing, 1991.
- S. Regunath and V. Kadirkamanathan, “Design of a pH control system using fuzzy non-uniform grid scheduling and evolutionary programming,” Applied Soft Computing, pp. 91-104, 2001.
- W. W. Tan, F. Lu, A. P. Loh, and K. C. Tan, “Modeling and control of a pilot pH plant using genetic algorithm,” Engineering Applications of Artificial Intelligence, Vol. 18, pp. 485-494, 2005.
- R. A. Wright and C. Kravaris, “On-line identification and nonlinear control of an industrial pH process,” Journal of Process Control, Vol. 11, pp. 361-374, 2005.
- H. H. Lee and J. W. Yang, “A new method to control electrolytes pH by circulation system in electrokinetic soil remediation,” Journal of Hazardous Materials B77, pp. 227-240, 2000.