Journal of Biomedical Science and Engineering
Vol.6 No.3A(2013), Article ID:29533,8 pages DOI:10.4236/jbise.2013.63A045
Combining DCE-MRI and 1H-MRS spectroscopy by distribution free approach results in a high performance marker: Initial study in breast patients
![]()
1Laboratorio di Tecnologie Oncologiche, Cefalù, Italy
2CNR-Istituto di Bioimmagini e Fisiologia Molecolare, UOS, Cefalù, Italy
3San Raffaele G. Giglio, Cefalù, Italy
4CNR-Istituto di Bioimmagini e Fisiologia Molecolare, Segrate, Milano, Italy
5Università Milano Bicocca, Milano, Italy
Email: stefania.nicolosi@polooncologicocefalu.it
Received 17 January 2013; revised 22 February 2013; accepted 1 March 2013
Keywords: Image Enhancement; Magnetic Resonance Spectroscopy; Receiver Operating Characteristic; Breast Cancer
ABSTRACT
Magnetic Resonance Imaging has gained popularity in breast cancer diagnosis since the introduction of contrast media, and recent developments in MRI have demonstrated a new potential use in diagnosis. Indeed, the application of in vivo spectroscopy to mammary tissue has revealed that the spectral appearance of choline could be a marker of malignancy, but early diagnosis and unambiguous breast cancer characterization could benefit by a standardized protocol for the simultaneous use of Dynamic Contrast Enhancement MRI and Magnetic Resonance Spectroscopy and combined interpretation of associated markers. A total of 29 female patients took part in the study. The combined protocol was performed on a General Electric Signa HDtx 1.5 Tesla, and the DCE data analysis was performed through an evaluation of the ROI signal intensity over time. The MRS data analysis evaluated choline concentration and the signal to noise ratio of the choline peak. Sensitivity, specificity and accuracy were assessed by the Receiver Operating Characteristic methodology for Dynamic Contrast Enhancement, Magnetic Resonance Spectroscopy and their linear combination. We performed a linear combination of Dynamic Contrast Enhancement MRI and 1H-Magnetic Resonance Spectroscopy by distribution free approach to obtain a high level diagnostic index. Combining the results of the two diagnostic tests has resulted in a new, very effective, diagnostic index able to discriminate between patients with and without malignant disease.
1. INTRODUCTION
Accurate breast cancer diagnosis is essential to implement successful treatments and to improve the patient’s quality of life. Magnetic resonance imaging began to spread as a tool for breast cancer diagnosis after the introduction of contrast media. In terms of Bi-Rads lexicon, Magnetic Resonance Imaging (MRI) sensitivity varies over a very wide range (from 20% to 100%) [1,2], while the specificity is around 88% [3].
Recent developments in the MRI technique have demonstrated new potential diagnostic use in breast. Results of the last ten years of applying in vivo Magnetic Resonance Spectroscopy (MRS) to mammary tissues have shown that the spectral appearance of Choline compounds could be considered a marker of malignancy. Sensitivity varies from 70% to 90% and specificity is around 86% [4-8].
For early diagnosis and unambiguous breast cancer characterization, it is desirable to have a standardized protocol which provides for the simultaneous use of more than one technique. In general, when multiple diagnostic tests are performed on the same patient it is theoretically possible to combine the individual information in order to optimize the diagnostic performance. Several statistical-medical authors have approached this problem by considering the linear combination of the markers which maximises, under specific assumptions, the area under the composite Receiver Operating Characteristic (ROC) curve [9-11]. In this paper, to obtain an optimized combination of Dynamic Contrast Enhancement-MRI (DCE-MRI) and MRS, we have applied the “Distribution Free” approach, first introduced by Pepe [10] and further refined by Esteban [9]. We consider as biomarkers to combine just the wash-out curve type and the Choline presence (see next paragraph). The new diagnostic index so obtained was able to discriminate between diseased and non diseased patients better than the components generating it. At the best of our knowledge, it is the first attempt to produce a new marker by an analytical combination of 1H-MRS and Dynamic Contrast Enhancement imaging in breast cancer MRI diagnosis. In a recent past, the combination of 1H-MRS and Dynamic Contrast Enhancement imaging has been tested by some Authors [12-16] the main goal of these works being a comparison between the ROC curves associated to individual exams and improving accuracy in diagnosis by a qualitative simultaneous evaluation of individual information.
2. MATERIAL AND METHODS
2.1. Subjects and Study Design
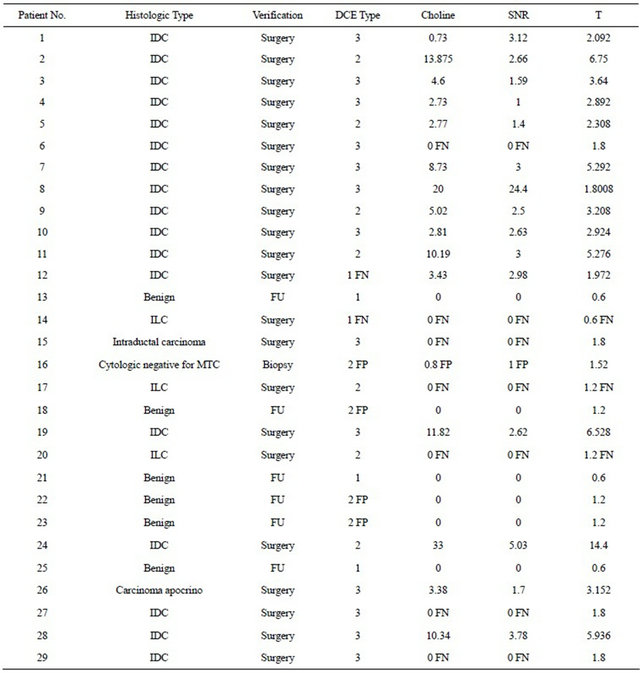
In this retrospective study, a total number of 29 female patients were included. Clinically suspicious finding and/ or abnormalities detected with mammography and/or ultrasonography were consecutively referred for MR imaging from Division of Senology (Operative Unit of Radiology) at our institution. Histologic Type was assessed by surgery in 22 patients: 17 Invasive Ductal Carcinoma (IDC), 3 Invasive Lobular Carcinoma (ILC), 1 Intraductal Carcinoma and 1 Apocrine Carcinoma were found; 1 biopsy verification gave a cytological results negative for Malignant Tumor Cells (MTC); for the remaining 5 patients a benign lesion has been assessed by clinical evaluation, imaging examination (MRI and/or mammography and/or ultrasound) and follow up. Results are summarized in Table 1.
2.2. Data Acquisition
The MRI/MRS protocol has been performed on a General Electric Signa HDtx 1.5 Tesla clinical magnetic resonance. Patients have been introduced inside the gantry in prone position and the breasts have been positioned between two plastic plates to ensure immobility. After the localizer scan, axial T2-weighted images have been acquired, using a Fast Recovery Fast Spin Echo sequence with TR/TE 5450/120 ms, field of view 40 cm, and slice thickness 4 mm. Following this sequence, axial T2- weighted Fat Sat pre-contrast images have been acquired, using a Fast Recovery Fast Spin Echo sequence, with TR/TE 5620/85 ms, field of view 40 cm, and 4 mm slice thickness. An axial 3D dynamic pulse sequence has been used for contrast imaging. The imaging parameters were: TR/TE 10 ms/3.6 ms, flip angle 10˚, and FOV 36 cm. A pre-contrast volume followed by six equally temporal spaced (60 seconds) contrast volumes, have been acquired. In this study, to ensure a correct localization of the MRS region, images were isotropically 3D resampled. By using a PRESS sequence (TE 144 ms, TR 1800 ms and number of acquisition 128) localized single-voxel 1H MR spectra have been acquired [17,18]. To increase the homogeneity of the signal over the whole breast volume an automatic shimming of the water resonance peak has been performed.
2.3. Analysis of DCE Data
Data analysis of DCE has been performed through the evaluation of the ROI signal intensity over the time. In accordance to Figure 1, the curve of wash-in and washout has been classified as type I, II and III [19].
A type I curve shows a continuous signal increasing over the whole time and it is suggestive of benignity. A type II curve, after an initial signal increase, flattens out and is related to an intermediate probability for malignancy. A type III curve, after a sharp increase, shows a rapid fallout and it is indicative of malignancy.
2.4. Analysis of Spectroscopic Data
After Fourier transformation, manual phasing was used to correct each signal by using the zero-order phase of its water peak. Maximum peak value of the water signal was assigned to 4.7 ppm. We selected the frequency ranges (i.e., water = 4.2 - 5.2 ppm, lipides = 0 - 1.8 ppm) of the spectrum for pre-processing and quantisation. In order to measure the Choline peak, we performed a preprocessing including: zero-filling of 2084 points on the originally acquired 1024, Gaussian apodization filter of 5 Hz bandwidth, and phase correction of the transformed spectrum. To quantify the amplitude of the Choline peak,
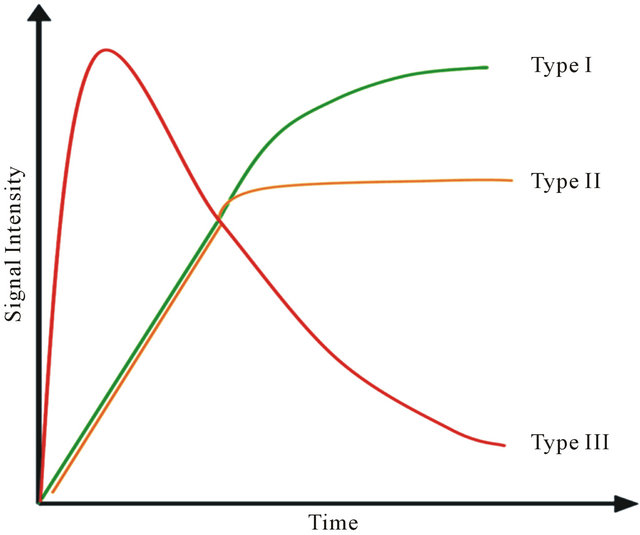
Figure 1. Time-signal DCE intensity curve for breast lesions.
Table 1. Summary of patients, lesions and markers (SNR = Signal to Noise Ratio; MTC = Malignant Tumor Cells; IDC = Invasive Ductal Carcinoma; ILC = Invasive Lobular Carcinoma; FU = Follow UP; FN = False Negative; FP = False Positive).
a narrow frequency range (i.e., 2.92 - 3.52 ppm) was selected [12,20].
To evaluate the Choline content of a selected region, two different approaches have been used: a semi-quantitative method consisting in the image SNR evaluation and an absolute, “first-principles”, quantification. SNR has been defined as the ratio between the baseline-corrected Choline signal amplitude and the noise, evaluated as the standard deviation of the baseline in the 7.8 - 8.8 ppm interval.
For the absolute quantification of the Choline level, the internal reference method has been used [20].
The absolute quantisation of MRS data consists of the following steps: determination of the total signal intensity (integral of the signal), correction for relaxation effects and then conversion of the corrected signal intensity into a concentration value. In the adopted internal water referencing method, the water peak of the unsuppressed spectra coming from the same voxel is used as an internal reference. The advantage of the internal referencing is that it is simpler and more accurate than the external referencing method. It automatically accounts for several experimental uncertainties, like coil transmit and receive efficiency, voxel size, and water compartmentalization with adipose tissue [21].
The most widely used formula to calculate the absolute tCho concentration with the internal referencing method is [20]:
 (1)
(1)
where 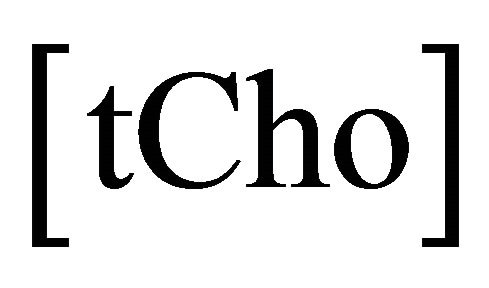 is the concentration of the total Cholinecontaining compounds;
  is the integral of choline signal;
  is the integral of the unsuppressed water signal;
  and
and  are the numbers of 1H nuclei for Choline and water molecule, respectively, and
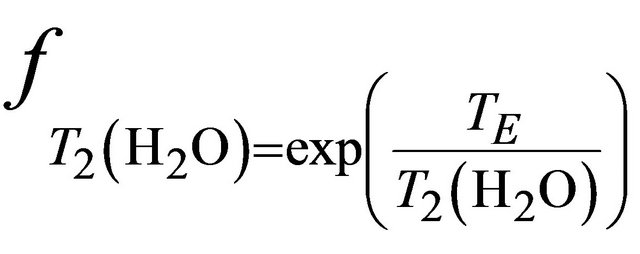
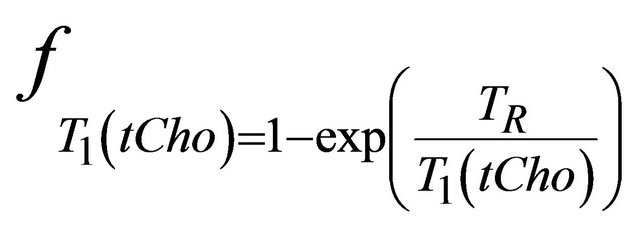
  is the molecular weight of water. The
 ,
,  ,
,  and
and  take account for relaxation and saturation of transverse and longitudinal magnetization due to
  and
and  and are given by the following equation:
 ,
,
 ,
,  and
and
 , where
 ,
,  ,
, 
and  are the decay times of water and tCho in breast.
The integral of signals amplitude have been calculated through AMARES algorithm (Advanced Method for Accurate, Robust and Efficient Spectral fitting) [22] supported by JMRUI software [23]).
The quantification method was tested in a preliminary phantom study. Home-built phantoms were prepared for 1H-MRS evaluation of the included metabolites by using the fully relaxed water peak as an internal reference. Four Choline chloride (ABX-Advance Biochemical compounds, Radeberg, Germany) phantoms with known concentrations of Choline chloride in pure water were used; the concentrations of Choline chloride were, in decreasing order: 5.57 mmol/kg, 2.79 mmol/kg, 1.39 mmol/kg and 0.70 mmol/kg. Both signal linearity versus concentration and the absolute concentration performance, at the different levels, were tested. Discrepancy between theoretical and experimental values was lower than 5%.
2.5. Statistical Analysis
ROC curve analysis is the most widely methodology used to measure accuracy, sensitivity and specificity of diagnostic tests based on continuous or ordinal data [24, 25].
This kind of analysis was first applied to DCE curve type and Choline concentration data to evaluate sensitivity, specificity and accuracy of the two single markers.
Then we generated a new diagnostic index by linearly combining DCE and Choline data. In a general sense, this problem has been assessed by the pioneering work of Su and Liu [11]. The Authors found the best linear combination of two indexes under the hypothesis that the two markers follow a normal distribution both for diseased and non-diseased patients. As the results of medical tests include continuous, ordinal or dichotomous variables, normal assumption can be too restrictive. More recently Pepe and Esteban [9,10] have extended the method without making assumption on the distribution of the variables (distribution free approach). Following the spirit of these works, we adopted a linear combination of the two tests of the form: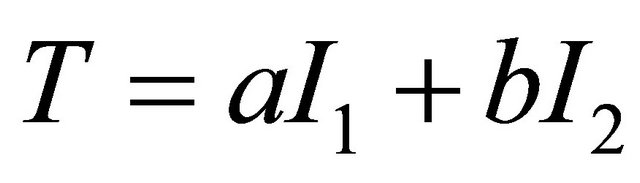 , where
  and
and  are the Choline content and DCE type curve tests respectively, while and a and b are the positive normalized weights of their linear combination, satisfying the condition
 . In the cited papers, the best linear combination is the one able to maximize the Area Under the Curve (AUC) of the composite test. This latter is calculated by the trapezoidal rule or, equivalently, the Wicoxon-Mann-Whitney (WMW) U statistic. If we assume that we have
  observations truly classified as diseased patients, D = 1, and
  observations corresponding to non-diseased patients, D = 0, we can write the results of the tests for diseased study as
 ,
,  and
and  for
for  and for non-diseased study as
 ,
,  and
and  for
for . Then the WMW U statistic and, consequently, the empirical AUC for the linear combination is given by
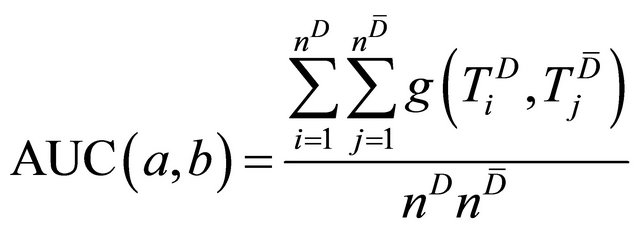 (2)
(2)
where
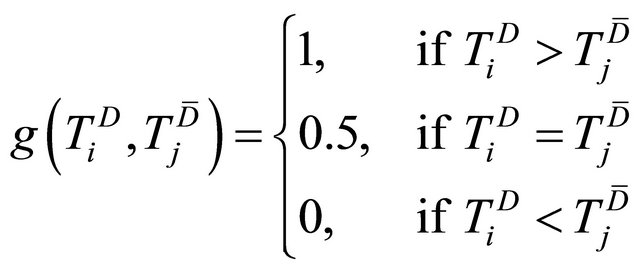
Since  is not a derivable function of
 , a search rather than a derivative-based method has been suggested for its maximization [9,10].
ROC analysis of the best empirical linear combination of the two markers has been compared to the individual ones.
Tests have been classified as excellent if 0.90 < AUC ≤ 1, as good if 0.80 < AUC ≤ 0.90, as fair if 0.70 < AUC ≤ 0.80, as poor if 0.60 < AUC ≤ 0.70 and fail if AUC ≤ 0.6.
3. RESULTS
3.1. In Vivo MRS
Baik et al. [20] determined water and Choline decay times T1 and T2 at 1.5 T in breast:  = 750 ms,
  = 97 ms,
  = 1500 ms and
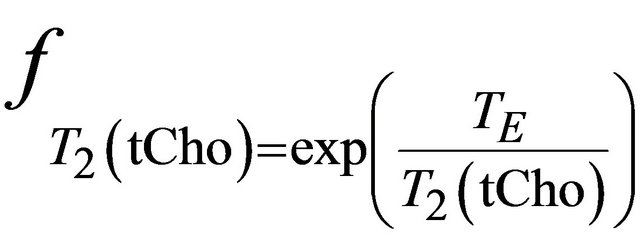
  = 270 ms. Using this values in Equation (1) absolute Choline concentration in our study vary in the range [0 - 33 Mm/Kg] (Table 1) that is in accordance with values reported in literature [4,20,26,27].
Sensitivity and specificity associated with MRS Choline level of the breast have been estimated by ROC curve evaluation. The corresponding ROC curve is depicted in Figure 2.
Using a Choline cut-off value of 0.73 mM/Kg, the specificity of the test is 85.7% (95% confidence interval: 59.8%, 100%) and sensitivity is 68.2% (95% confidence interval: 48.7%, 87.6%). The accuracy of the test as given by the Area Under the ROC curve (AUC)-WMW U statistic—is 0.812. The test can then be classified as good. In the last quoted figure, we reported both the Choline absolute quantization and Choline SNR curves. The two graphs are almost identical. For a cut-off value of SNR Choline of 1.4, specificity, sensitivity, true positive and false positive cases are the same as quantitative Choline (Table 1). AUC is 0.815. The test can be classified as good. A study of correlation (see Figure 3), by Pearson Test, among the two indexes shows a high degree of correlation (rho value = 0.7; p value = 4.3 × 10⁻⁴). The absolute Ch concentration method is characterized by a low variability of the cut-off value reported in previous works [13,20,26,28] and this statement has been confirmed by a multi-centre study [29]. The SNR method [26,30] is easier to apply. In our work the two methods give almost identical results and the diagnostic power of the two indices, in our patient group, is not statistically
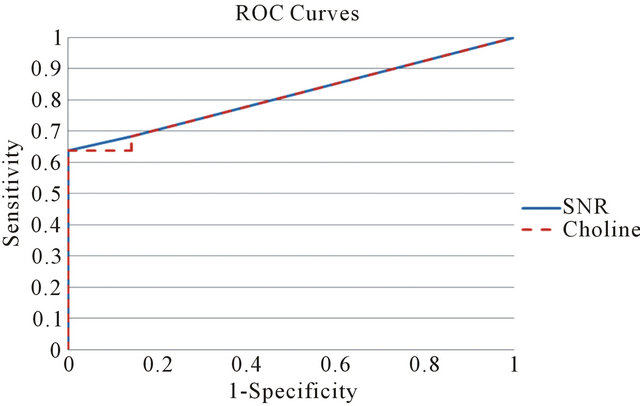
Figure 2. Receiver operating characteristic curve for the two choline markers (absolute concentration and SNR).
different (p > 0.05) More work seems required for a comparative evaluation of the two methods.
3.2. DCE
As shown in Figure 1 specific patterns of enhancement have been defined as persistent (type I), plateau (type II), and washout (type III) (values for patient are reported in Table 1). Sensitivity and Specificity associated with DCE curve classification have been estimated by ROC curve evaluation whose plot is depicted in Figure 4. Type II and type III curves are indices of disease with a sensitivity of 90.9% and a specificity of 42.8%. Accuracy of the test as given by AUC is 0.84. The test can be classified as good.
3.3. Statistical Combination
The best linear combination T maximizing AUC for the composite test is obtained with the couple (a = 0.4, b = 0.6). The obtained T values for patient are reported in Table 1. The corresponding ROC curve is plotted in Figure 5 (blue line) together with the ones relative to the individual test (red line for Choline concentration and green line for DCE). As expected, the composite test gives a better performance that the two individually.
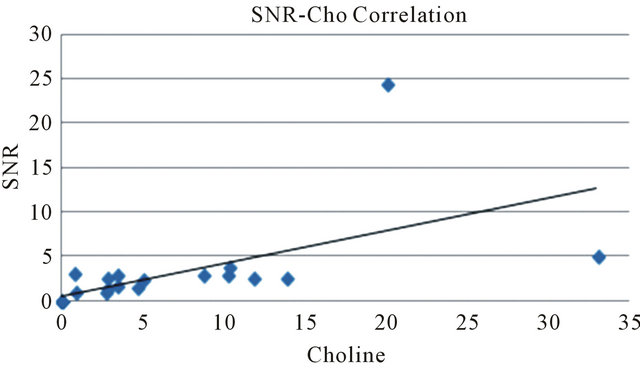
Figure 3. Correlation study between Choline concentration and SNR.
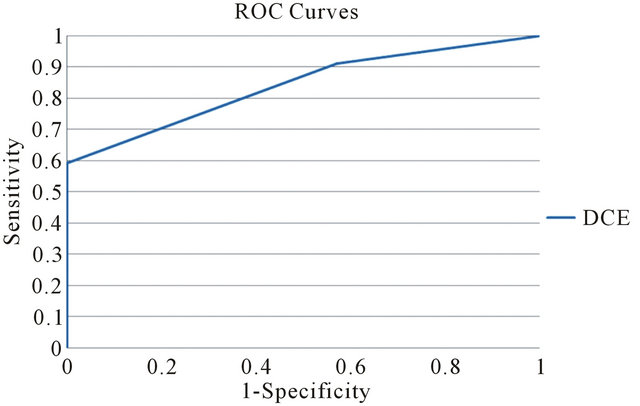
Figure 4. Receiver operating characteristic curve for DCE curve type.
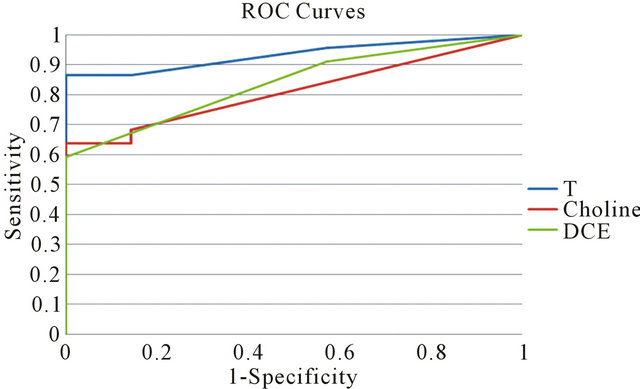
Figure 5. Comparison of Receiver operating characteristic curves among the linear combination T of the two tests and the individual ones (Choline and DCE).
Moreover the obtained values of a and b parameter is in accordance with the fact that DCE curve type accuracy is better than Choline one in discriminating between disease and not-disease cases. For a cut-off value of 1.8 of the composite test, sensitivity is 86.4% and specificity is 100%. The AUC is 0.96. The statistical combination of the two tests can be classified as excellent. In particular, at the cut-off value, the number of false positive is zero so that biopsies become unnecessary.
4. DISCUSSION
DCE-MRI has been widely used to improve the specificity of MRI in characterizing breast lesions [1-3]. The most widely used form of DCE-MRI analysis is the assessment of the type of time-signal intensity curve (i.e., kinetic curve) by categorizing the washout pattern of a gadolinium contrast agent. Despite the good results reached within this technique, in our study, the number of false positive cases going through unnecessary biopsy approaches the 14% of total population. The results here reported are in good accordance with literature [19] where a positive washout phenomenon (type III) is associated with a likelihood of breast cancer of 87% (100% in our study); whereas a progressive signal intensity increase (type I) is associated with a likelihood of breast cancer of only 6% (6.8% in our study), irrespective of other imaging findings that are used for the diagnosis; and, finally, a plateau signal intensity time course (type II) is seen both in malignant and benign lesions but with a distribution of three to two (as in our study). Therefore, a type II time course is generally used to support the suspicion of breast cancer.
By contrast, MRS study of the Choline peak as marker of malignancy manifests a higher precision in classifying false positive, but the true positive score is worse than in DCE classification. The cut-off value is a little bit lower than reported in literature. Sensitivity and specificity are in full accordance with previous works [13,20,26,28].
The composite test (DCE + MRS) here described, performed in an excellent way (AUC = 0.96) in discriminating between disease and not disease cases, showing a significantly better performance than the two individual components, here classified as good (AUC = 0.82 for Choline and AUC = 0.84 for DCE). Sensitivity and specificity of the best linear combination are 86.4% and 100%, respectively.
Moreover, for the composite test, the rate of false positive is zero so overcoming the problem of unnecessary biopsy characterizing the two components individually. The 19 true positive cases have been classified as Invasive Ductal Carcinoma (IDC) in 16 cases, Intraductal carcinoma in one case and apocrine carcinoma in one case. The 3 false negative have been classified as Invasive Lobular Carcinoma (ILC). From our data, it seems that the joint use of DCE and MRS does not encompass the problem of misdiagnose of ILC characterizing MRS and DCE indexes and ascribable to the weak or absent angiogenic activity associated with this kind of cancer [3,19].
The most of previous works analyzing spectroscopic metabolites as potential markers of malignancy limit to calculate sensitivity and specificity associated to choline and/or other metabolite (water/fat ratio, ...) without quantify the added values of spectroscopy on DCE-MRI [4, 7,8,20,21,24,26,28,31-34]. To the best of our knowledge only five works try to assess benefits deriving by the joint use of the two techniques [12-16]. Jacobs et al. (2004) analyze 9 patients regarding morphology, enhancement curve and Choline SNR. Their analysis is qualitative and concludes that a combination of DCE and MRS may improve specificity. In 2005 Meisamy et al. conducted an analysis on 55 patients. Four radiologists assessed the percentage probability of malignancy based on morphologic features, time-signal intensity curve and choline concentration. On the basis of this percentage ROC curves have been generated showing a mean sensitivity, specificity and accuracy (94%, 57% and 90%) greater than DCE-MRI (87%, 51% and 73%) and MRS (69%, 90% and 83%). Dorrius et al. (2012) analyze in 24 patients the Birads index and Choline concentration showing that MRI alone manifests a sensitivity of 100%, specificity of 45.5% and accuracy of 96% while accuracy of MRS is 100%. A qualitative analysis of the joint use of the two techniques brings them to conclude that MRS can improve the accuracy of DCE-MRI. Lipnick et al. (2010) analyze in 18 patients the enhancement curve and some metabolites ratio. As in our works they calculate sensitivity and specificity associated to dynamic curve type obtaining 100% and 70%, respectively. Finally, they show that two malignant lesion having plateau curve enhancement show a choline SNR greater than cutoff value while one malignant lesion having Choline SNR
Table 2. Sensitivity (Se), specificity (Sp) and accuracy (Ac) of DCE, MRS and their combination.
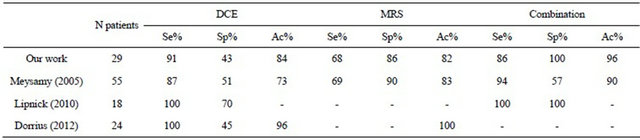
lower than cutoff manifests a washout pattern. They conclude that the joint use of the two techniques brings to the correct diagnosis of all subjects in their study (sensitivity and specificity both equal to 100%). Even if the previously reported results go in the same direction of ours (see Table 2) they have to be considered as indicative of a predictable behaviour able to find an initial demonstration in our work. In contrast to the described papers ours represents a first attempt to introduce a formal mathematical treatment of combined DCE-MRI and 1H-MRS spectroscopy resulting in the definition of a new marker whose accuracy is superior to the components generating it. Our pilot findings from a total of 29 subjects needs to be supported by other exams in order to assess statistically believable performance data of the new diagnostic index.
Moreover, it would be very interesting to evaluate if a more refined analysis of DCE curves enhancement (with the dynamical parameter ktrans evaluation [35]) and/or the joint use of MRS, DCE and morphological properties could encompass the problem of false negative findings. The removal of these limitations is in progress in our institutions.
5. CONCLUSION
The new composite index (DCE + MRS) manifest a higher performance than the two single tests in discriminating between disease and not-disease cases. This result is in full accordance with previous qualitative analysis [12-16]. Despite the small number of the subjects investigated, the obtained results are an encouraging factor to prosecute the research of MR composite indices.
6. ACKNOWLEDGEMENTS
The authors of the paper are greatly indebted to Dr. Pier Paolo Buò and Dr. Gerardo Bassano from General Electric, without their support this work would not have been possible. This work was supported by CIPE1 (n. DM45602).
REFERENCES
- Boetes, C., Barentsz, J.O., Mus, R.D., Van Der Sluis, R.F., van Erning, L.J., Hendriks, J.H., Holland, R. and Ruys, S.H. (1994) MR characterization of suspicious breast lesions with a gadolinium-enhanced TurboFLASH subtraction technique. Radiology, 193, 777-781.
- Saslow, D., Boetes, C., Burke, W., et al. (2007) American cancer society guidelines for breast screening with MRI as an adjunct to mammography. A Cancer Journal for Clinicians, 57, 75-89.
- Kuhl, C. (2007) The current status of breast MR imaging part I. Choice of technique, image interpretation, diagnostic accuracy, and transfer to clinical practice1. Radiology, 244, 356-378. doi:10.1148/radiol.2442051620
- Bartella, L., Morris, E.A., Dershaw, D.D., et al. (2006) Proton MR spectroscopy with choline peak as malignancy marker improves positive predictive value for breast cancer diagnosis: Preliminary study. Radiology, 239, 686- 692. doi:10.1148/radiol.2393051046
- Cecil, K.M., Schnall, M.D., Siegelman, E.S., et al. (2001) The evaluation of human breast lesions with magnetic resonance imaging and proton magnetic resonance spectroscopy. Breast Cancer Research and Treatment, 68, 45- 54. doi:10.1023/A:1017911211090
- Katz-Brull, R., Lavin, P.T. and Lenkinski, R.E. (2002) Clinical utility of proton magnetic resonance spectroscopy in characterizing breast lesions. Journal of the National Cancer Institute, 94, 1197-1203. doi:10.1093/jnci/94.16.1197
- Sardanelli, F., Fausto, A. and Podo, F. (2008) MR spectroscopy of the breast. La radiologia Medica, 113, 56-64. doi:10.1007/s11547-008-0228-y
- Sardanelli, F., Fausto, A., Di Leo, G., et al. (2009) In vivo proton MR spectroscopy of the breast using the total choline peak integral as a marker of malignancy. American Journal of Roentgenology, 192, 1608-1617. doi:10.2214/AJR.07.3521
- Esteban, L.M., Sanz, G. and Borque, A. (2011) A stepby-step algorithm for combining diagnostic tests. Journal of Applied Statistics, 38, 899-911. doi:10.1080/02664761003692373
- Pepe, M.S. and Thompson, M.L. (2000) Combining diagnostic test results to increase accuracy. Biostatistics, 1, 123-140. doi:10.1093/biostatistics/1.2.123
- Su, J.Q. and Liu, J.S. (1993) Linear combinations of multiple diagnostic markers. Journal of the American Statistical Association, 88, 1350-1355. doi:10.1080/01621459.1993.10476417
- Jacobs, M.A., Barker, P.B., Argani, P., et al. (2004) Combined dynamic contrast enhanced breast MR and proton spectroscopic imaging: A feasibility study. Journal of Magnetic Resonance Imaging, 21, 23-28. doi:10.1002/jmri.20239
- Dorrius, M.D., Pijnappel, R.M., van der Weide Jansen, M., et al. (2012) The added value of quantitative multivoxel MR spectroscopy in breast magnetic resonance imaging. European radiology, 22, 915-922. doi:10.1007/s00330-011-2322-0
- Meisamy, S., Bolan, P.J., Baker, E.H., et al. (2005) Adding in vivo quantitative 1h MR spectroscopy to improve diagnostic accuracy of breast MR imaging: Preliminary results of observer performance study at 4.0 T. Radiology, 236, 465-475. doi:10.1148/radiol.2362040836
- Lipnick, S., Liu, X., Sayre, J., et al. (2010) Combined DCE-MRI and single voxel 2D MRS for differentiation between benign and malignant breast lesions. NMR in Biomedicine, 23, 922-930. doi:10.1002/nbm.1511
- Huang, W., Fisher, P.R., Dulaimy, K., et al. (2004) Detection of breast malignancy: Diagnostic MR protocol for improved specificity. Radiology, 232, 585-591. doi:10.1148/radiol.2322030547
- Bottomley, P.A. (1987) Spatial localization in NMR spectroscopy in vivo. Annals of the New York Academy of Sciences, 508, 333-348. doi:10.1111/j.1749-6632.1987.tb32915.x
- Ordidge, R.J., Bendall, M.R., Gordon, R.E., et al. (1985) Volume selection for in vivo biological spectroscopy. In: Govil, G., Khetrapal, C.L. and Saran, A., Eds., Magnetic Resonance in Biology and Medicine, McGraw-Hill, New Delhi, 387-397.
- Kuhl, C.K., Mielcareck, P., Klaschik, S., et al. (1999) Dynamic breast MR imaging: Are signal intensity time course data useful for differential diagnosis of enhancing lesions? Radiology, 211, 101-110.
- Baik, H.M., Su, M.Y., Yu, H., et al. (2006) Quantification of choline-containing compounds in malignant breast tumors by 1 H MR spectroscopy using water as an internal reference at 1.5 T. Magnetic Resonance Materials in Physics, Biology and Medicine, 19, 96-104.
- Jagannathan, N. (2009) Quantitative estimate of in-vivo metabolites in breast and prostate tissues by MR spectroscopy. Medical Physics, 36, 2768. doi:10.1118/1.3182501
- Vanhamme, L., Van Den Boogaart, A. and Van Huffel, S. (1997) Improved method for accurate and efficient quantification of MRS data with use of prior knowledge. Journal of Magnetic Resonance, 129, 35-43. doi:10.1006/jmre.1997.1244
- Stefan, D., Di Cesare, F., Andrasescu, A., et al. (2009) Quantitation of magnetic resonance spectroscopy signals: The jMRUI software package. Measurement Science and Technology, 20, 104035. doi:10.1088/0957-0233/20/10/104035
- Begg, C.B. (2006) Advances in statistical methodology for diagnostic medicine in the 1980’s. Statistics in Medicine, 10, 1887-1895. doi:10.1002/sim.4780101205
- Swets, J.A. and Pickett, R.M. (1982) Evaluation of diagnostic systems: Methods from signal detection theory. Academic Press, New York.
- Bolan, P.J., Meisamy, S., Baker, E.H., et al. (2003) In vivo quantification of choline compounds in the breast with 1H MR spectroscopy. Magnetic Resonance in Medicine, 50, 1134-1143. doi:10.1002/mrm.10654
- Haddadin, I.S., McIntosh, A., Meisamy, S., et al. (2009) Metabolite quantification and high field MRS in breast cancer. NMR in Biomedicine, 22, 65-76. doi:10.1002/nbm.1217
- Baek, H.M., Chen, J.H., Yu, H.J., et al. (2008) Detection of choline signal in human breast lesions with chemical shift imaging. Journal of Magnetic Resonance Imaging, 27, 1114-1121. doi:10.1002/jmri.21309
- Keevil, S.F., Barbiroli, B., Brooks, J.C.W., et al (1998) Absolute metabolite quantification by in vivo NMR spectroscopy: II. A multicentre trial of protocols for in vivo localised proton studies of human brain. Magnetic Resonance Imaging, 16, 1093-1106.
- Jacobs, M.A., Barker, P.B., Bottomley, P.A., et al. (2004) Proton magnetic resonance spectroscopic imaging of human breast cancer: A preliminary study. Journal of Magnetic Resonance Imaging, 19, 68-75. doi:10.1002/jmri.10427
- Baik, H.M., Su, M.Y., Yu, H.J., et al. (2005) Proton chemical shift imaging for monitoring early treatment response of breast cancer to neoadjuvant chemotherapy. Proceedings of the 13th Annual ISMRM, 7-13 May 2005, Miami, 1879.
- Bakken, I.J., Gribbestad, I.S., Singstad, T.E., et al. (2001) External standard method for the in vivo quantification of choline containing compounds in breast tumors by proton MR spectroscopy at 1.5 Tesla. Magnetic Resonance in Medicine, 46, 189-192. doi:10.1002/mrm.1175
- Do, R., Moy, L., Salibi, N., et al. (2006) Can MRS improve our ability to distinguish between benign and malignant lesions? Proceedings of the 14th Annual ISMRM, 6-12 May 2006, Seattle, Washington DC.
- Stanwell, P., Gluch, L., Clark, D., et al. (2005) Specificity of choline metabolites for in vivo diagnosis of breast cancer using 1 H MRS at 1.5 T. European Radiology, 15, 1037-1043. doi:10.1007/s00330-004-2475-1
- Huang, W., Tudorica, L.A., Li, X., et al. (2011) Discrimination of benign and malignant breast lesions by using shutter-speed dynamic contrast-enhanced MR imaging. Radiology, 261, 394-403. doi:10.1148/radiol.11102413