Journal of Biomedical Science and Engineering
Vol.6 No.1(2013), Article ID:27437,11 pages DOI:10.4236/jbise.2013.61007
Image based measurements for evaluation of pelvic organ prolapse
![]()
1Department of Industrial & Management System Engineering, University of South Florida, Tampa, USA
2Department of Information Technology, University of South Florida, Tampa, USA
3Department of Obstetrics and Gynecology, USF Health Center for Advanced Medical Learning and Simulation (CAMLS), College of Medicine, University of South Florida, Tampa, USA
Email: pbao@usf.edu
Received 26 November 2012; revised 28 December 2012; accepted 5 January 2013
Keywords: Pelvic Organ Prolapse; Pelvic Floor Measurements; MRI; Statistical Pattern Recognition; Morphological Operations
ABSTRACT
Magnetic resonance imaging (MRI) measurements are essential for the diagnosis of pelvic organ prolapse given the inaccuracy of clinical examination. However, MRI pelvic floor measurements are currently performed manually and can be inconsistent and timeconsuming. In this paper, we present a scheme for semi-automatic measurement modeling on MRI based on image segmentation and intersecting point identification methods. The segmentation algorithm is a multistage mechanism based on block grouping, support vector machine classification, morphological operation and prior shape information. Block grouping is achieved by classifying blocks as bone or background based on image texture features. The classified blocks are then used to find the initial segmentation by the first phase morphological opening. Prior shape information is incorporated into the initial segmentation to obtain the final segmentation using registration with the similarity type transformation. After segmentation, points of reference that are used for pelvic floor measurements are identified using morphological skeleton operation. The experiments on the MRI images show that the presented scheme can detect the points of reference on the pelvic floor structure to determine the reference lines needed for the assessment of pelvic organ prolapse. This will lead towards more consistent and faster pelvic organ prolapse diagnosis on dynamic MRI studies, and possible screening procedures for predicting predisposition to pelvic organ prolapse by radiologic evaluation of pelvic floor measurements.
1. INTRODUCTION
Pelvic organ prolapse (POP) is a major health problem affecting up to 30% - 50% of women [1]. POP is a herniation of the female pelvic floor organs (bladder, uterus, small bowel and rectum) into the vagina. This condition can cause significant problems including a bothersome vaginal bulge, incontinence, incomplete bowel and bladder emptying and pain/discomfort. In the US, approximately 300,000 women undergo surgery for this condition each year [2]. Unfortunately, POP procedures are associated with high failure rates, with approximately 30% of women who undergo surgical repair requiring another surgery for recurrence of symptoms within four years [3]. There are different types of pelvic organ prolapse based on the underlying organ involved: cystocele (bladder), rectocele (rectum), uterine (uterus) and enterocele (intestine). POP is normally diagnosed through clinical examination since there are few associated symptoms that are specific to each particular type of prolapse.
The International Continence Society (ICS) recommends the use of the Pelvic Organ Prolapse Quantification system, a clinical examination that uses measurements based on site-specific points, which is currently considered the gold standard for assessing POP [4]. However, clinical examination has been found to be inadequate and in disagreement with surgical findings, particularly for posterior vaginal wall prolapse [5,6]. Studies indicate that the clinical examination for POP concurred with surgical findings in only 59% of patients [7,8].
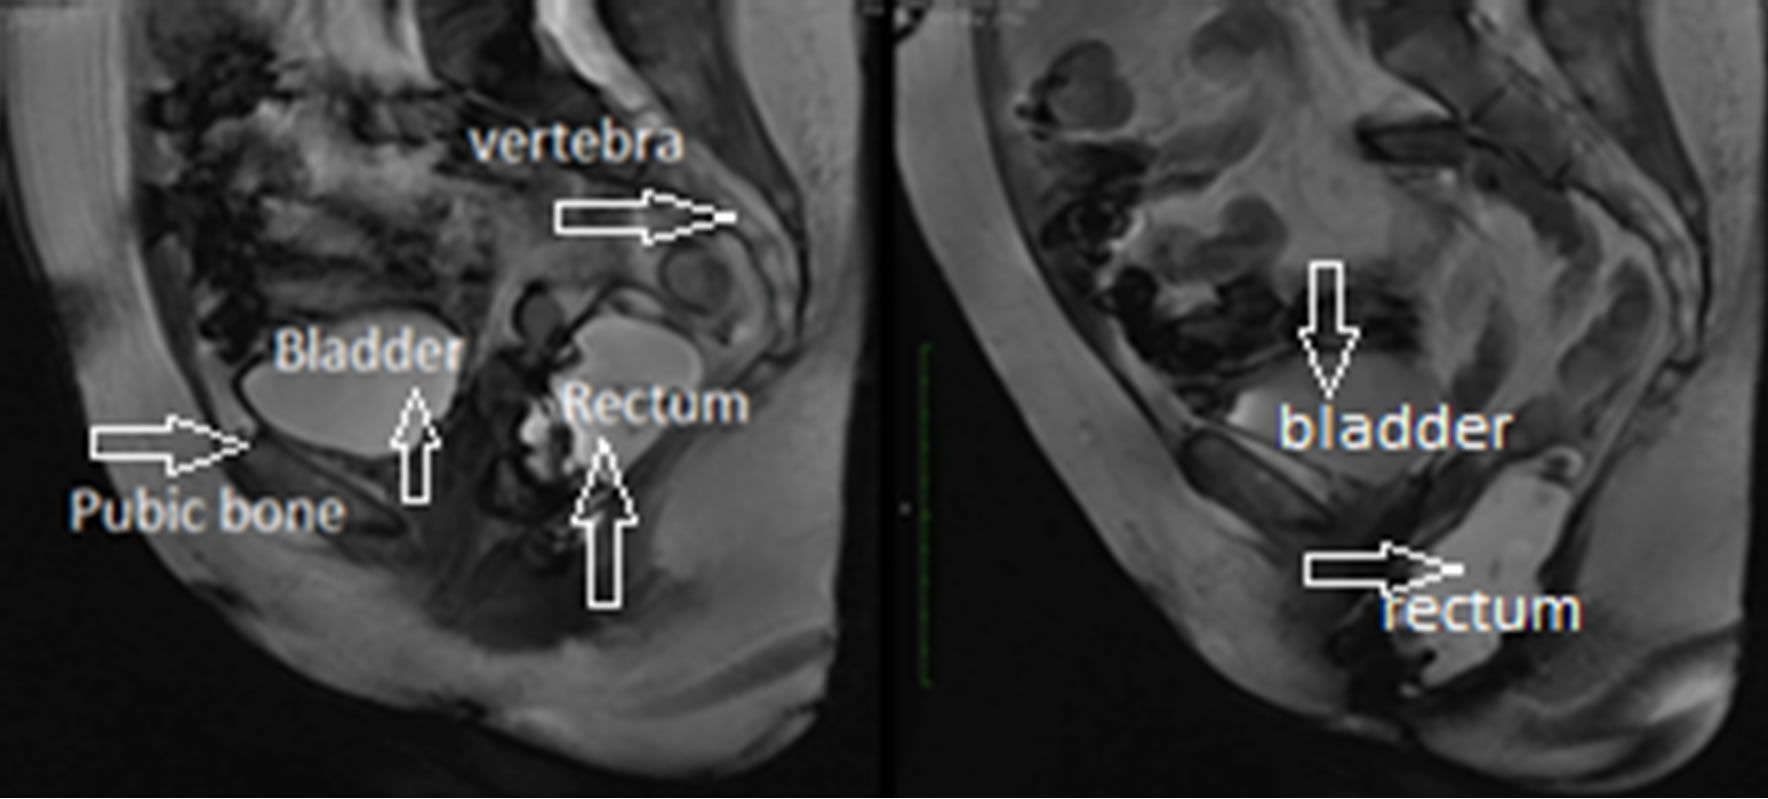
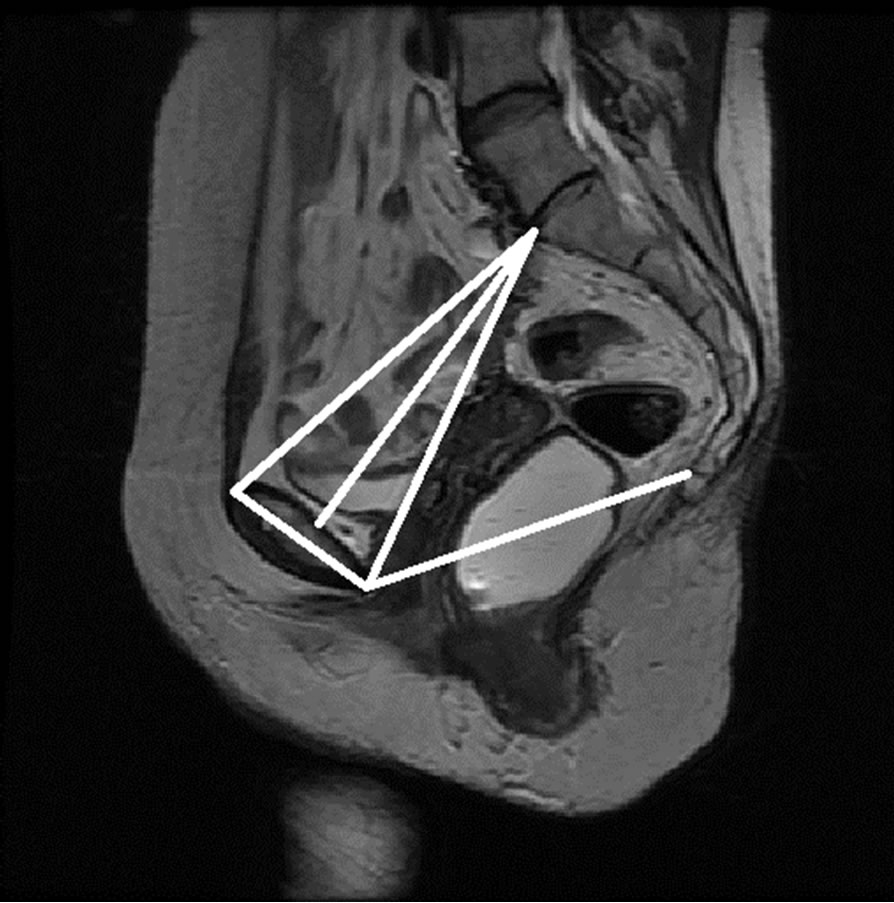
Dynamic MRI imaging of the pelvic floor has become popular in assessing POP cases that may not be evident on clinical examination [9]. This is especially important in the diagnosis of patients with multi-compartment prolapse or who have failed the previous prolapse surgeries. Sequential images of dynamic MRIs for a rectocele case are shown in Figure 1, where the displacement of the rectum can be observed as the patient goes from the rest position to the maximum strain position.
During the analysis of dynamic MRI images, anatomical landmarks are identified manually on the midsagittal
 (a) (b)
Figure 1. Rectocele case, (a) Rest position; (b) Maximum strain position.
plane to determine the features including points, lines and distances, for grading pelvic organ prolapse as shown in Figure 2 [10]. The most commonly used reference lines for measuring pelvic organ prolapse are pubococcygeal line (PCL), mid-pubic line (MPL) and M-Line. The PCL is determined by the inferior border of the pubic bone and the last visible coccygeal joint while the MPL is a midsagittal long axis of the symphysis pubis and extends through the level of the vaginal hymen [11,12]. M-Line is also defined as a line from the lowest point of the rectum to PCL line. M-Line is then measured on the images when the patient is at rest and under maximum pelvic strain. Based on M-Line distances, the severity of prolapse is graded as mild, moderate, or severe [11-13]. However, the manual identification of these points, lines and distances on MRI is a time-consuming and inconsistent procedure. Most importantly, the clinical examination and the current MRI measuring techniques do not perform satisfactorily in detecting and differentiating the posterior compartment prolapse such as rectocele and enterocele [14]. In fact, the posterior pelvic floor dysfunction has been identified as one of the most understudied of all pelvic floor disorders since its causes are still not completely understood [14].
Previous studies have tested a variety of reference lines with the intent to improve the diagnosis of posterior POP [11,13]. Other lines such as the Diagonal, Obstetric, and True Conjugate lines (see Figure 3) may be associated with the type of POP a patient develops. However, current lines and other lines of interest have not been completely tested and proven on large image samples. This is due to the aforementioned problem of manually identifying points, lines, and measurements, which is time-consuming and inconsistent.
In this study, we present a novel image-based approach to semi-automatically identify the reference points, lines and distances used for grading POP on MRI. The segmentation algorithm is a multi-stage mechanism based on block grouping, support vector machine classification, morphological operation and prior shape information. Block grouping is achieved by classifying blocks as bone or background based on image texture features.
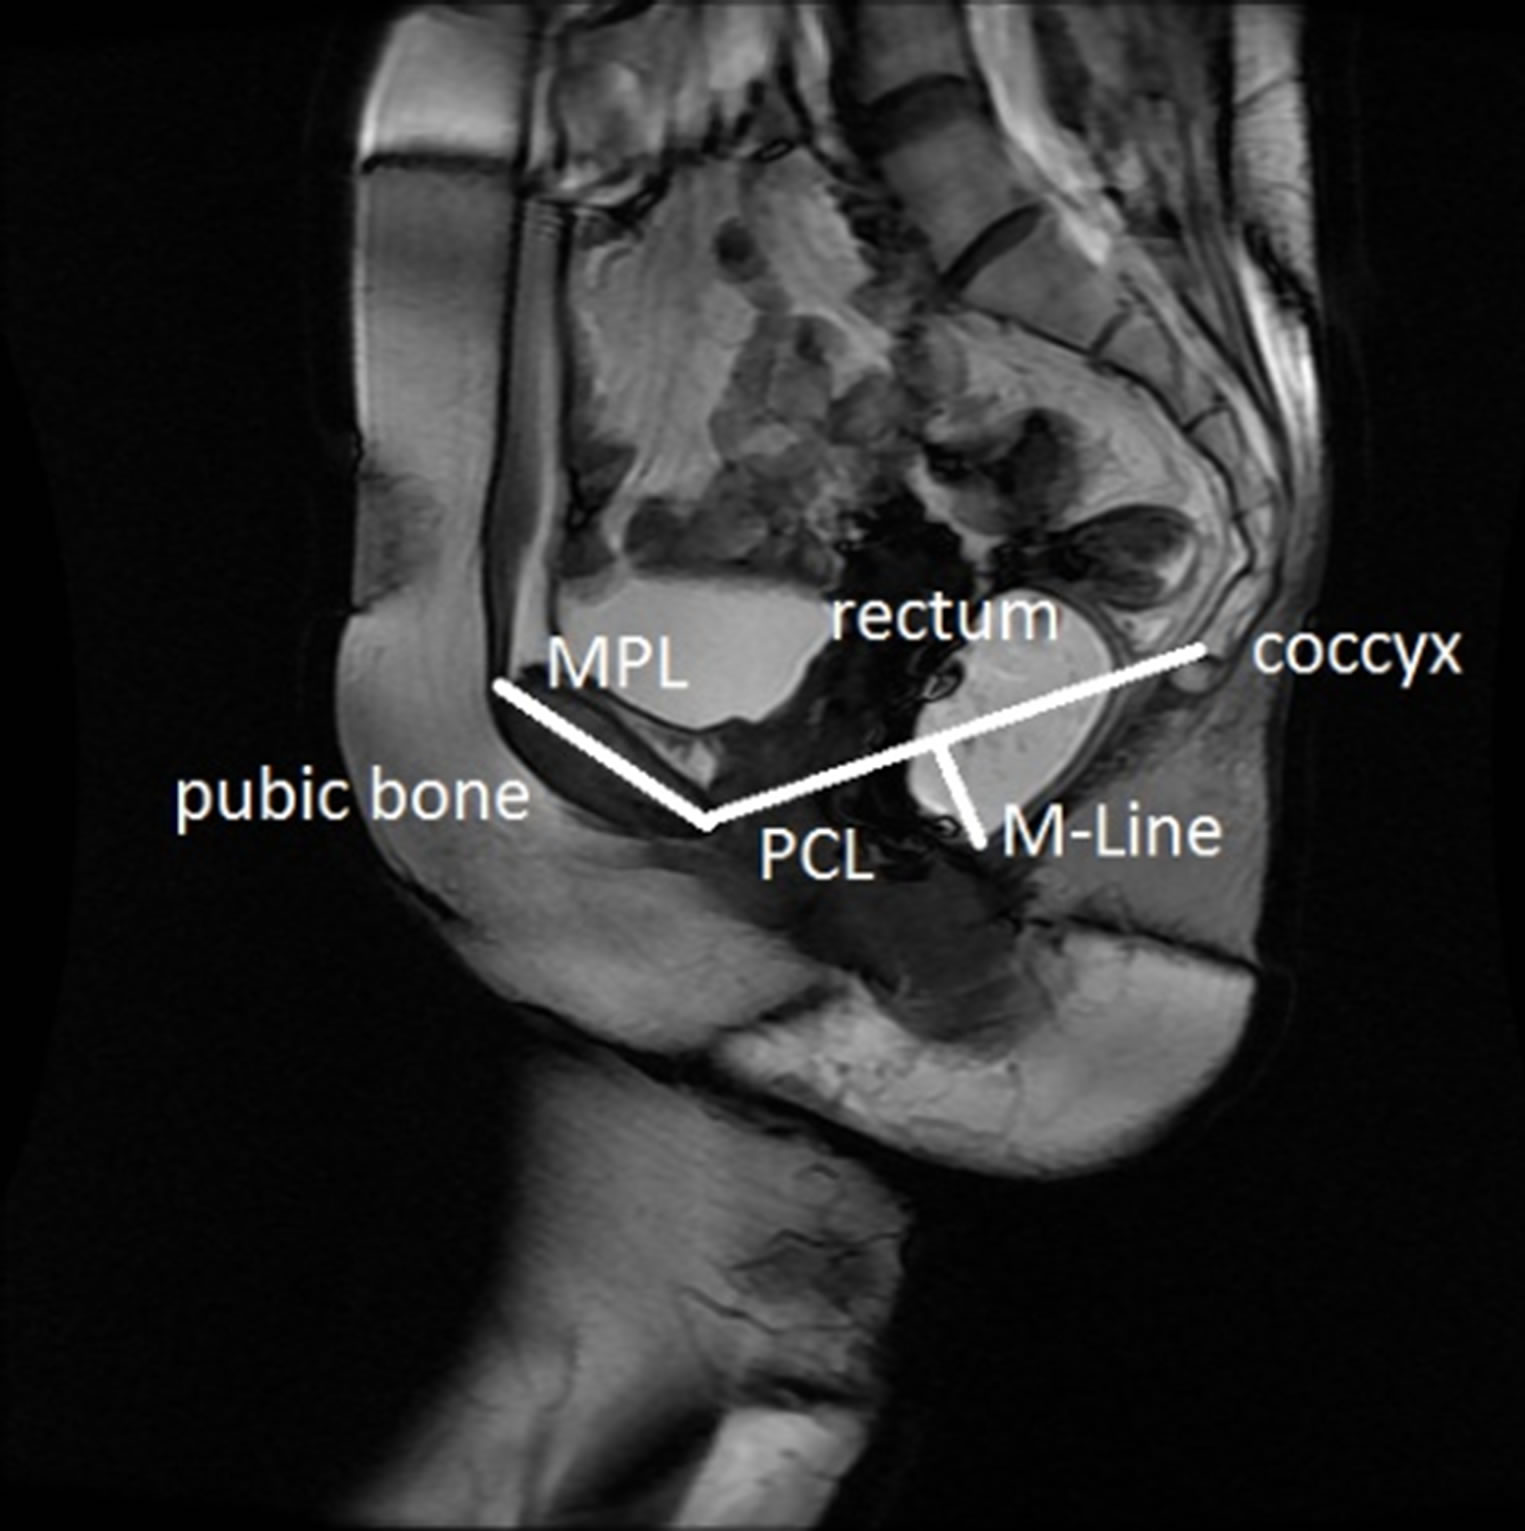
Figure 2. Currently used reference lines for grading rectocele on MRI.
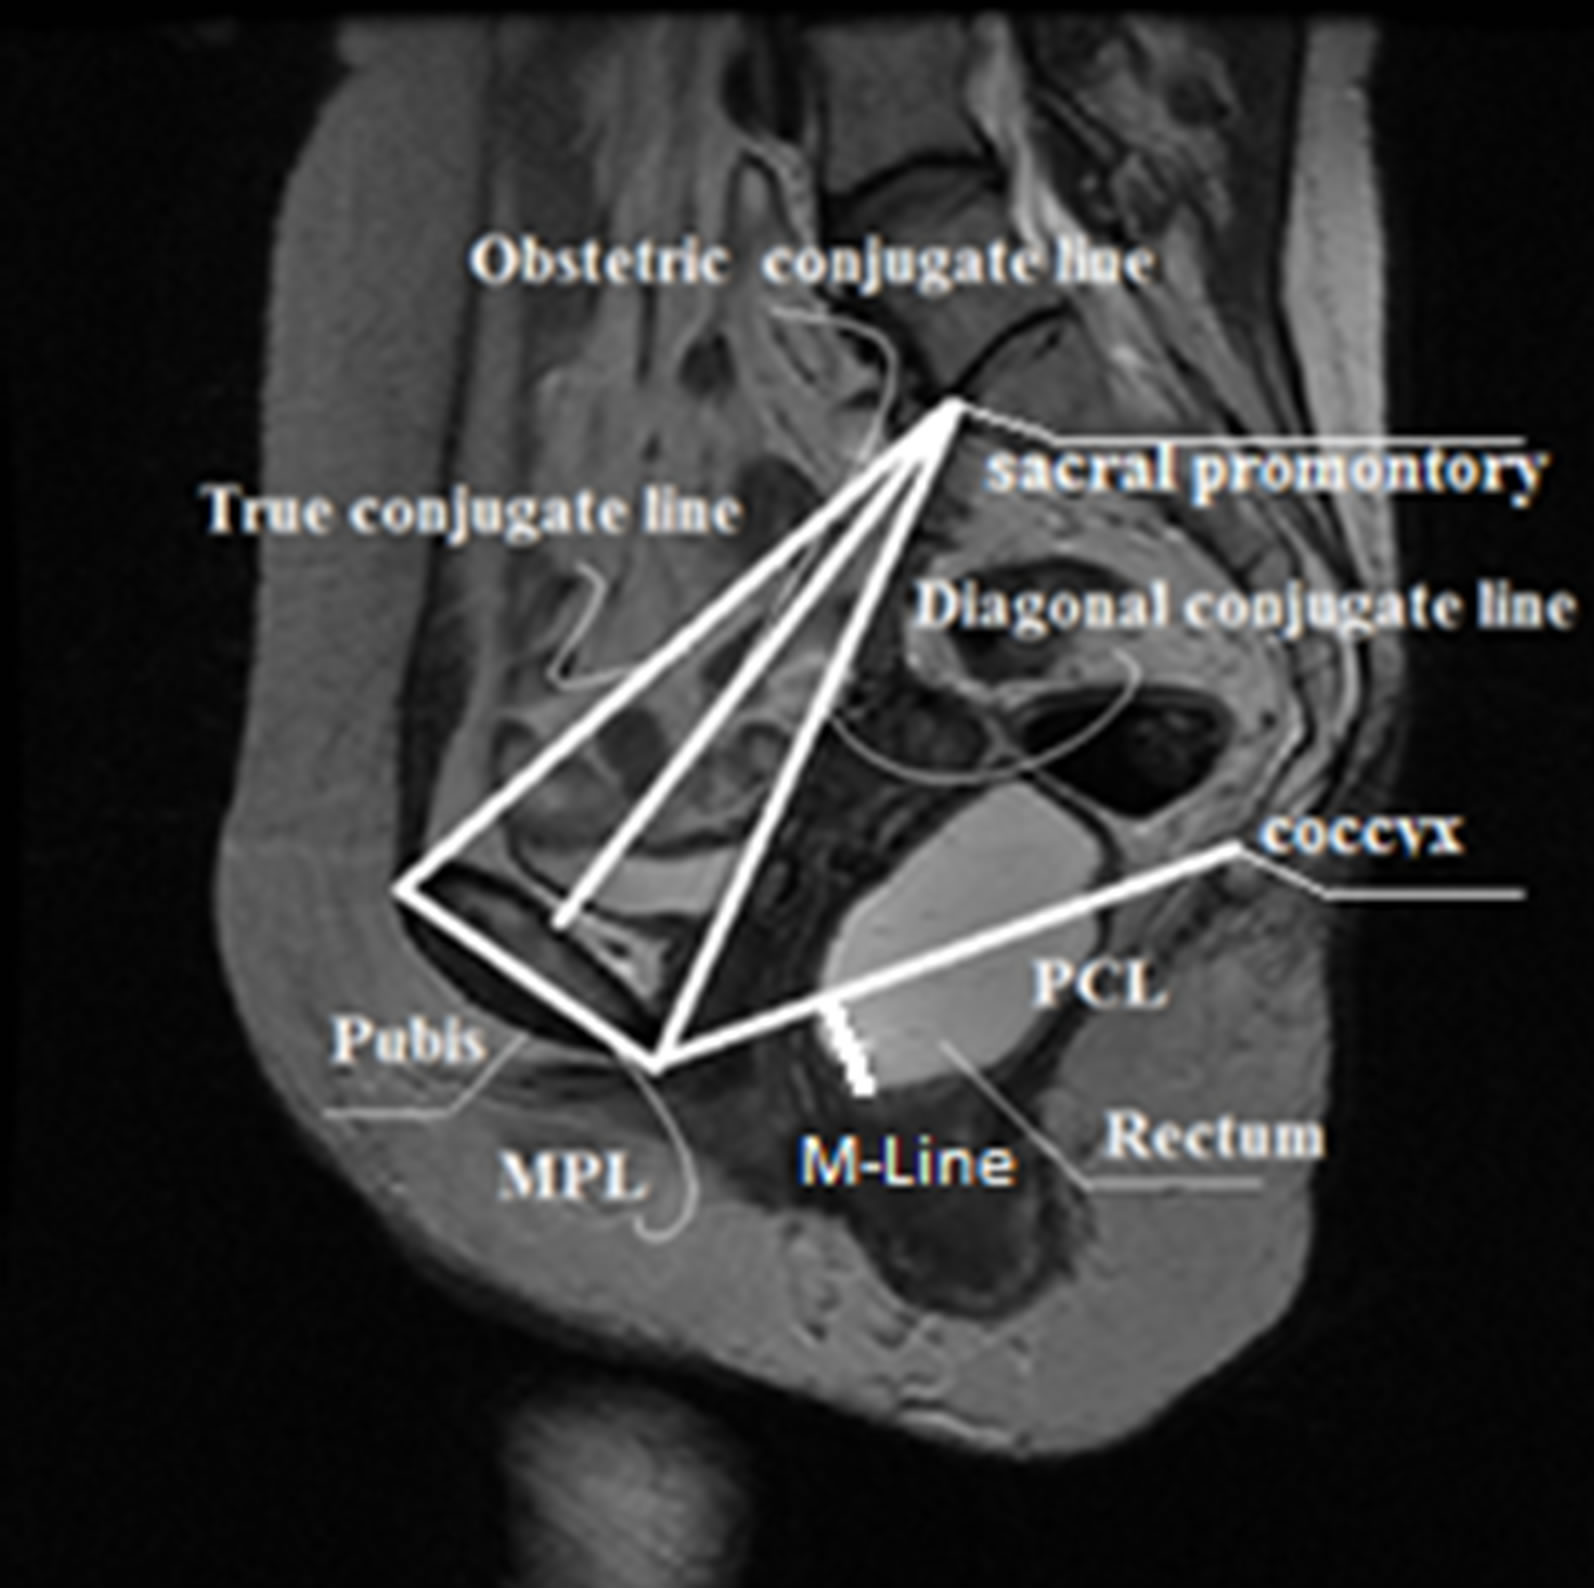
Figure 3. Current and proposed reference features.
The classified blocks are then used to find the initial segmentation by the first phase morphological opening. Prior shape information and initial segmentation are then used to obtain the final segmentationusing registration with the similarity type transformation. Automating the pelvic floor measurement process will enable faster and more consistent measurement to test and analyze a variety of current and new features on large image datasets. This will be fundamental towards the design of an MRI-based pelvic floor measurement model for automated diagnosis of POP.
The remaining of the paper is organized as follows: Section 2 describes previous work on medical image segmentation Section 3 introduces the proposed method based on statistical pattern recognition. The experiments are presented in Section 4 and the conclusions in Section 5.
2. PREVIOUS WORK
Medical image segmentation has become increasingly important in automating the identification of structures of interest on medical images for diagnosis, localization of pathology, treatment and surgical planning. The segmentation techniques are influenced by objects’ boundaries, homogeneities and shapes. The object boundaries and object homogeneities are image based and affected by some specific disturbances like noise. They are also highly dependent on the image modality techniques. For instance, bones have more visible boundaries in computed tomography (CT) but poor boundaries in magnetic resonance images (MRI). On the other hand, soft tissues such as organs are better observed on MRI than CT. Medical image segmentation techniques are divided into two main methods: model-free based algorithms and model-based algorithms.
Model-free based methods are based on local image properties such as intensity value, gradient magnitude, and textures. Thresholding, image feature-space clustering, region based and boundary based methods are the most frequently used model-free techniques. The thresholding method is the simplest image segmentation method and is commonly used for segmenting gray scale images [15,16]. The image feature-space clustering method is a multi-dimensional extension of the thresholding segmentation, and it segments an image by grouping similar pixels into one group [17]. The region based image segmentation approaches such as region growing, region splitting, region merging, or hybrid model group spatially connect pixels into homogeneous groups [18]. Region based segmentations [19] are based on the principle of homogeneity. Image segmentation can also be obtained by boundary detection techniques associated with regions. The edge detection is an important task for object segmentation in image processing, and many different approaches have been proposed [20-22].
Model-based methods have been widely used in medical image segmentation. In these methods, a model representing an object, or prior shape, is obtained through a training set and then tested on unseen images. One of the methods with locally modeled shape prior technique is the active contour or snakes [23]. An active contour is a flexible spline that detects the specific properties of an image, and can be dynamically fit to the edges of a structure by minimizing the energy function using both internal and external energy terms. Successful applications have been reported on the segmentation of the brain [24] and lung [25].
Traditionally, MRI has been used to study soft tissues, whereas computed tomography (CT) scanning has been associated with the imaging of hard tissues such as bones. However, the use of MRI for imaging both bone and soft tissue has become commonplace since MRI has no ionizing radiation. This has led to challenges in the segmentation of bones on MRI due to their poor boundaries. Recently, methods have been proposed for the segmentation of bones on MRI, such as region growing approaches, medial models, active shape models, general deformable models (i.e., live-wire, active contour or active surface models), clustering methods, and graphbased approaches. Lorigo et al. [26] used texture-based geodesic active contours to perform segmentation of the knee bone. Fripp et al. [27] used three-dimensional active shape models initialized by affine registration to an atlas for the segmentation of the knee bone. Bourgeat et al. [28] used features extracted from the phase of MR signal to improve texture discrimination in bone segmentation. Graph-based approaches such as graph-cuts have been successful in bone segmentation. It is based on selecting edges from a graph, where each pixel corresponds to a node in the graph. Weights on each edge measure the dissimilarity between pixels. Shape models [29], normalized cuts [30] and graph cut [31,32] have been applied to the segmentation of the femur and hip bones, spinal, and femoral head, respectively.
Dynamic MRI provides better information about soft tissues and their movement than any other available imaging technique. However, bones are not easily differentiable from the soft tissue since fat tissues tend to have intensity characteristics that are very similar to the intensity of the bone structures. This constitutes great challenges for current segmentation algorithms that tend to fail during bone segmentation by erroneously expanding into soft tissue areas. Consequently, fat or soft tissue is often misclassified as bone structures on MRI.
3. METHODOLOGY
Pelvic floor measurements on MRI begin with the identification of reference points. As shown in Figure 4, these reference points are located on three areas: pubic bone, sacral promontory, and coccyx, and each group of points has specific characteristics. Therefore, different approaches will be applied to find these points. Points located on the pubic bone (points 1, 2, and 3) can be found through segmentation of the pubic bone. On the other hand, points located on the sacral promontory and coccyx (points 4 and 5) can be defined as intersecting points, and can be found by applying a corner detection algorithm. After all the points of interest are identified, the points can be linked to each other through lines to perform pelvic floor measurements.
The proposed method to identify the reference points and lines semi-automatically is divided into three main stages: pre-segmentation, segmentation, and point identification (see Figure 5). The first stage starts with manual
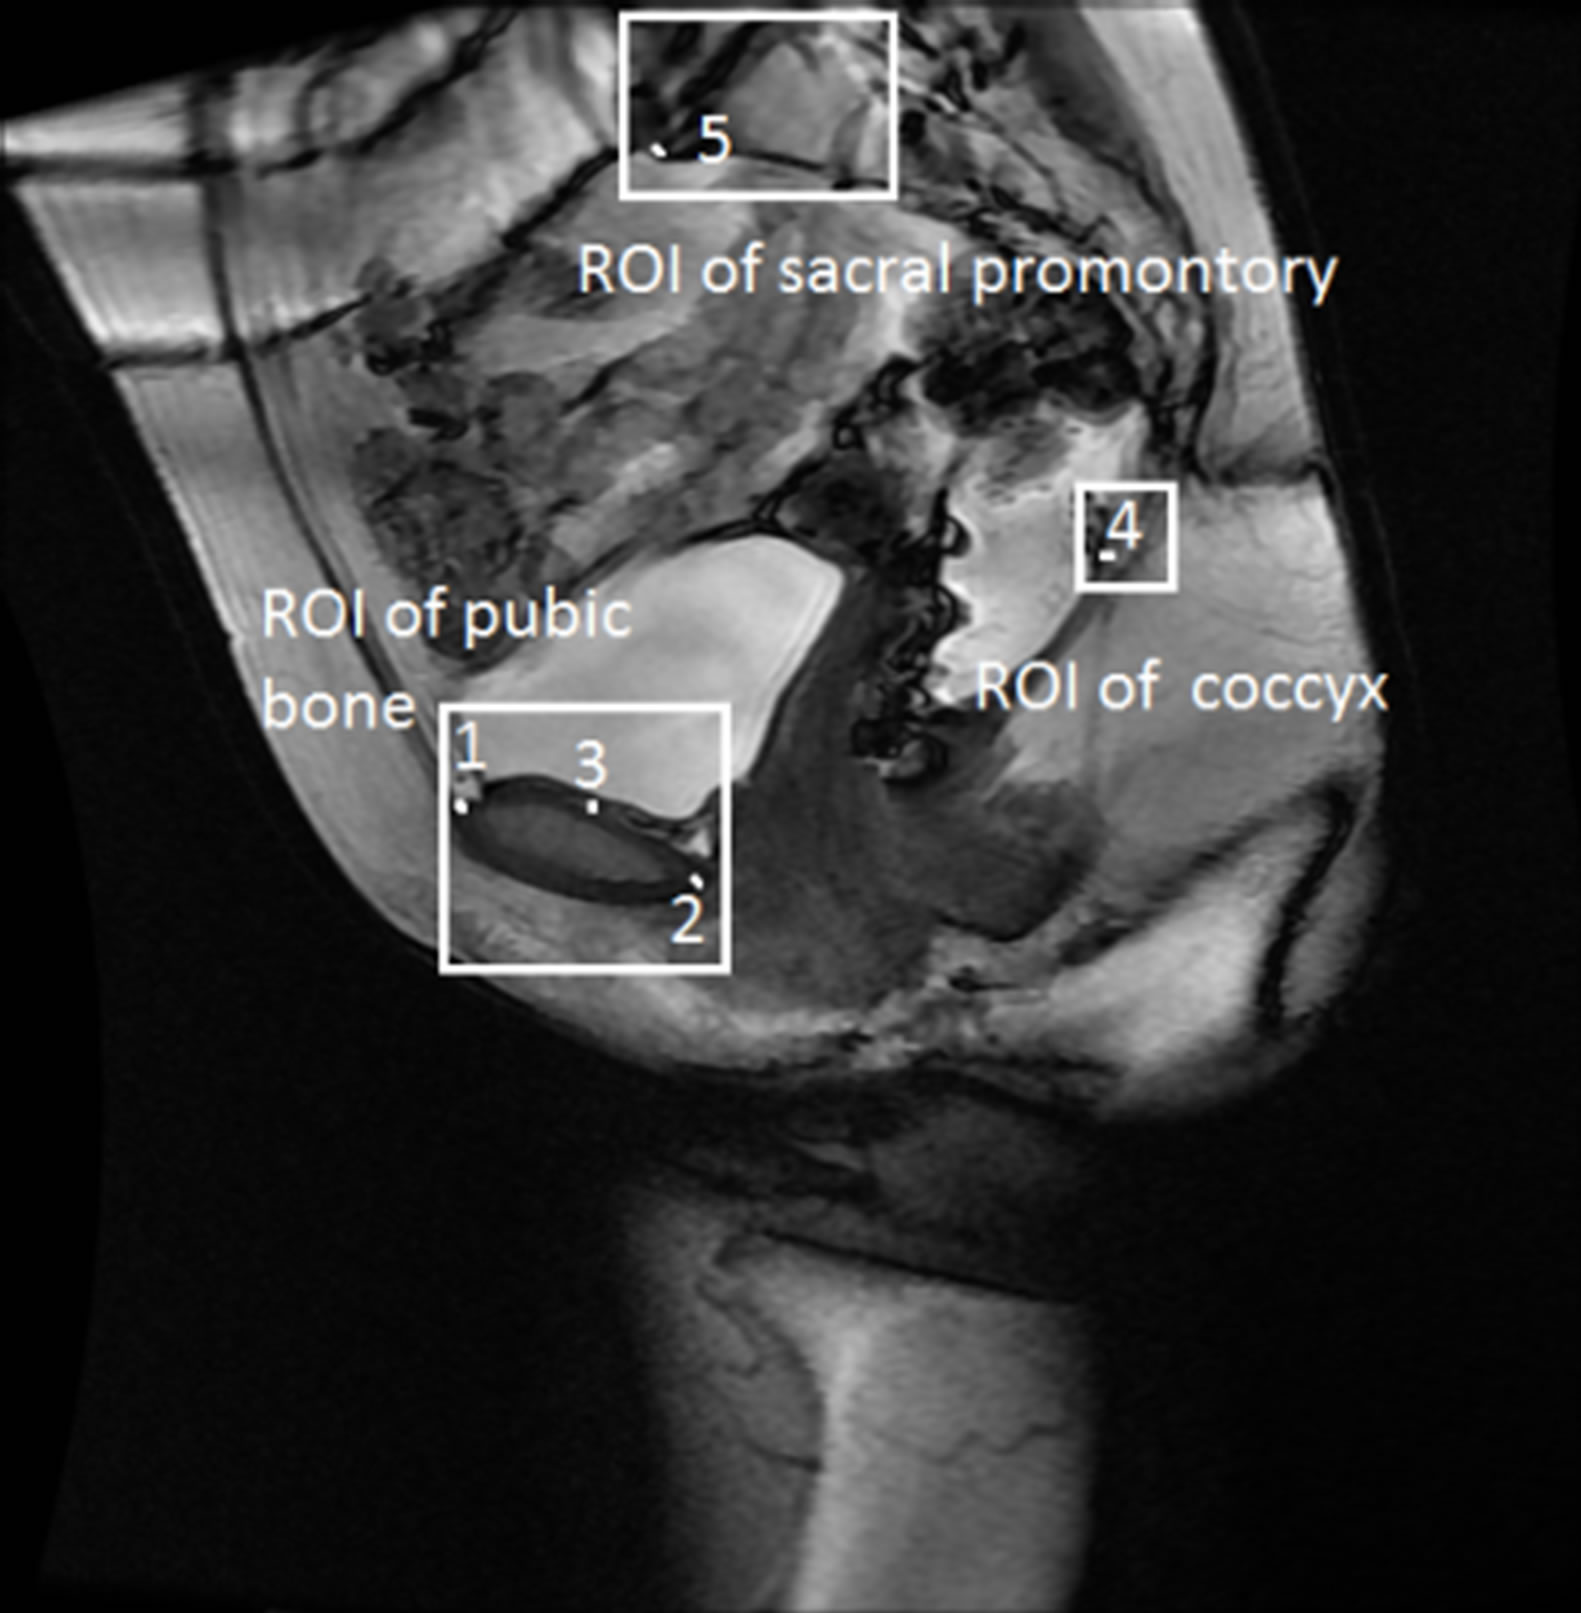
Figure 4. Points of interest and regions.
segmentation of the anatomical structures of interest for data training, and statistical mean shape generation. In the second stage, feature extraction is done using intensity and texture features. Sequential forward selection is performed for subset feature selection. Then, blocks are classified as image blocks and background blocks using support vector machines (SVM) followed by first phase morphological operations to have the initial segmented image. Segmentation is further improved by incorporating prior shape information to the initial segmented image. The final step is the identification of the points to build the pelvimetry model. Following are the detailed descriptions of the proposed method.
3.1. Pre-Segmentation Process
3.1.1. Mean Shape Extraction
Since bone structures are not easily identified on MRI because of noise and low contrast, feature classification is not sufficient for properly identifying the border of the pubic bone. Prior shape information about the object can help to compensate for missing information.
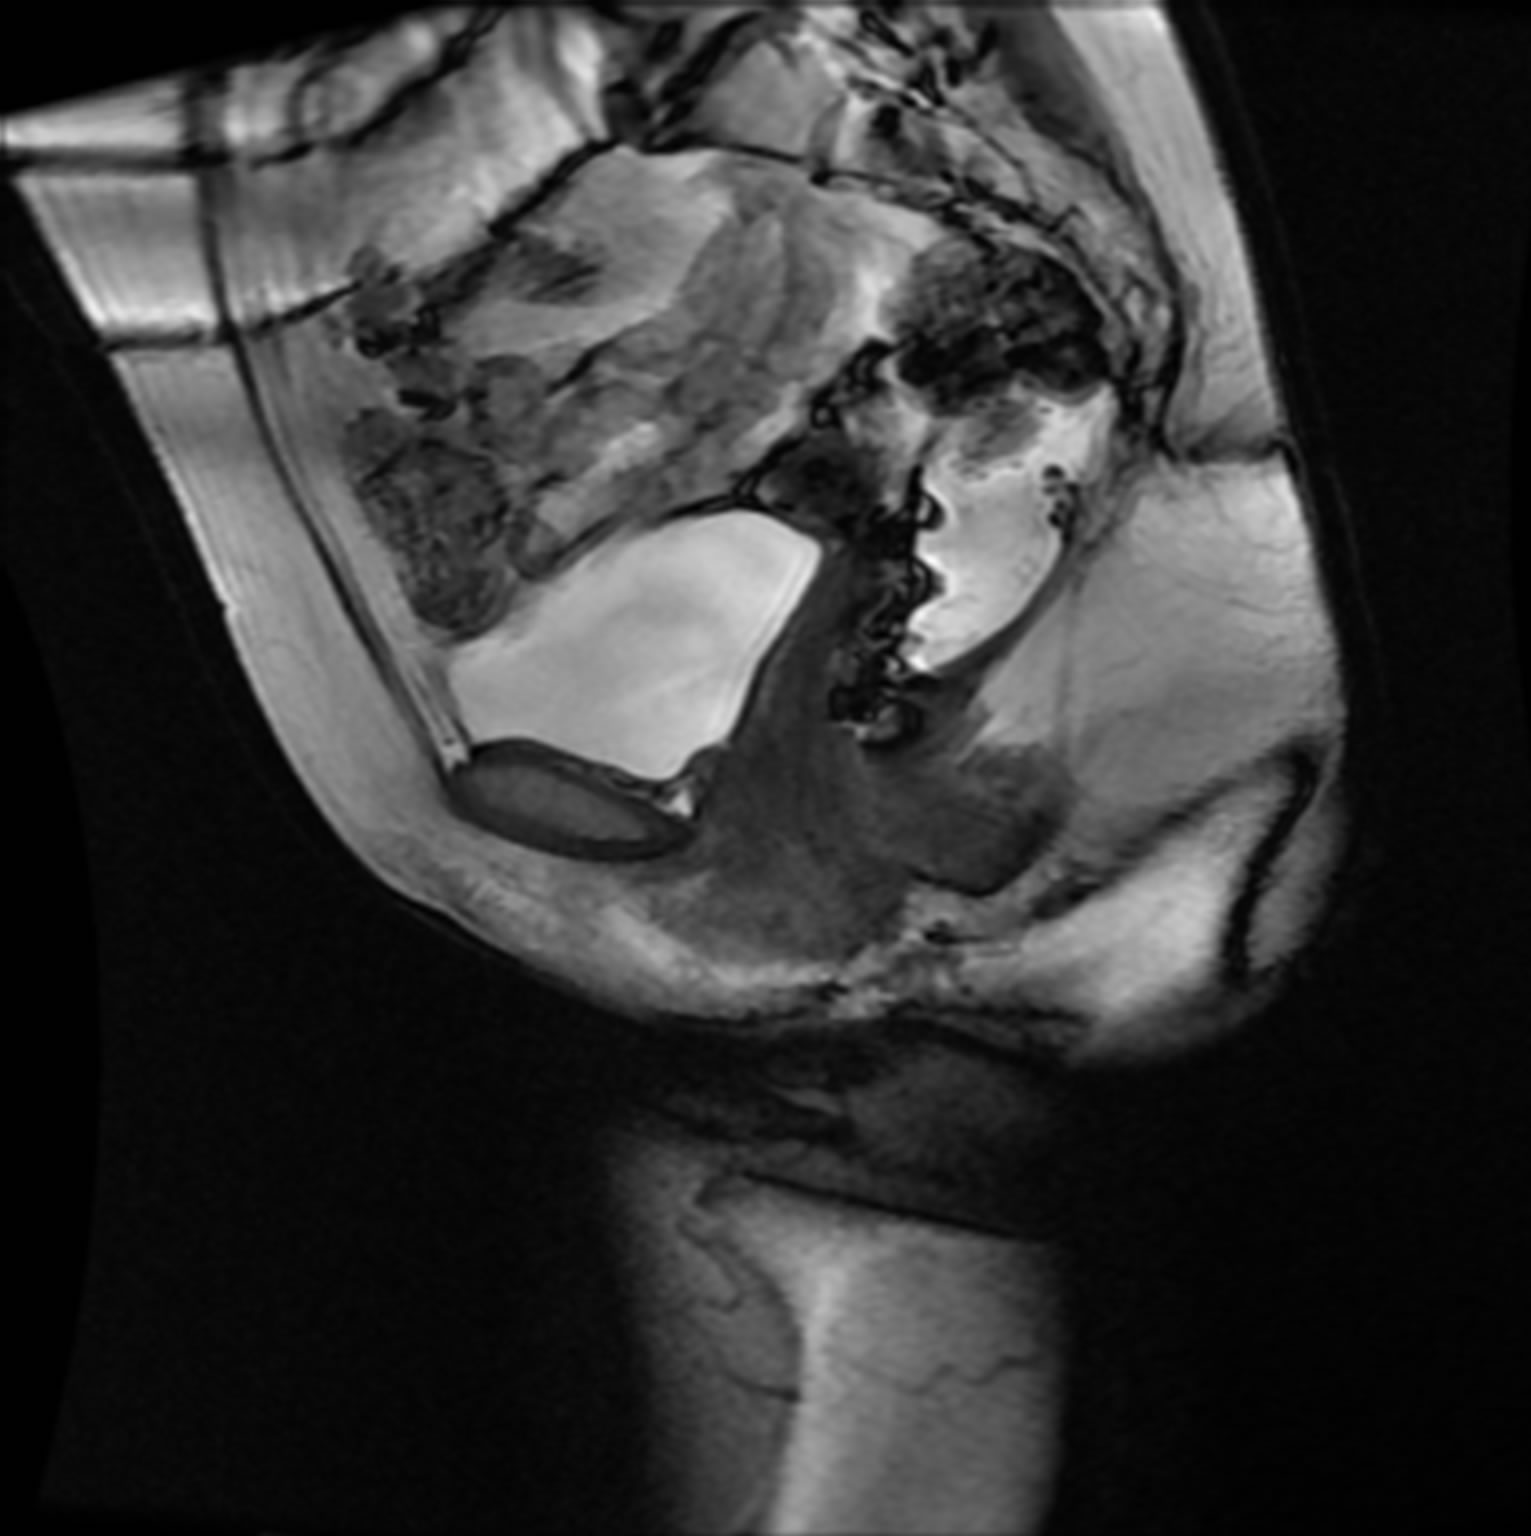
Prior shape information can be obtained by building a mean shape. To achieve this, the pubic bone is segmented manually from a set of training images, and the results are stored as a binary mask as shown in Figure 6(b). These images are used for building the mean shape and grouping the pixels. As shown in Figure 7, the regions of interest (ROIs) are cropped through an M × N size window to build the statistical mean shape of the images from the training set.
The extracted structures are aligned with respect to a set of axes to filter out the differences in shapes due to translation, scaling, and rotation. An image is selected arbitrarily as the reference shape, and all the other shapes are aligned with respect to the reference shape. A mean shape can be generated as a binary image as shown in Figure 8(a) as follows:

where  (i = 1···N) are the shapes in the training set and N denotes the number of the shapes.
3.1.2. Feature Extraction and Feature Subset Selection
The region of interest for the pubic bone is further divided into small blocks of m × n size as seen in Figure 9. These small blocks will be grouped instead of each pixel during the classification for computational efficiency and to use texture features for classification.
For classification, the main issue in the feature extraction task is to identify suitable features that characterize different patterns accurately. Since MRI has low-level contrast intensity, using only the gray level based features that are commonly used does not provide enough information for the classification. Another set of features that has been successful for medical images is texture features. Texture perception has a very important aspect in the human visual system of recognition and interpretation. Texture features have shown to provide more reliable results on MRI because they provide relative position information of any two pixels with respect to each other. Medical images possess different textures depending upon the area of the body considered for imaging.
Average gray level, standard deviation (average contrast), smoothness, third moment (skewness), uniformity and entropy are extracted as intensity features. Moreover, Gray Level Co-occurrence matrix is used to extract the texture features suggested in Haralick [33]. GLCM matrix provides information regarding the relative position of two pixels with respect to each other.
To avoid irrelevant or redundant features, we have implemented sequential forward selection method, which starts with an empty feature subset. On each iteration, exactly one feature is added to the feature subset. To determine which feature to add, the algorithm tentatively adds to the candidate feature subset one feature that is not already selected, and tests the accuracy of a classifier built on the tentative feature subset. The feature that results in the highest accuracy is added to the feature subset. The process stops after an iteration where no feature additions result in improved accuracy.
3.2. Segmentation Process
Classification and First Phase Morphological Operations
The classification of the blocks involves two steps. The
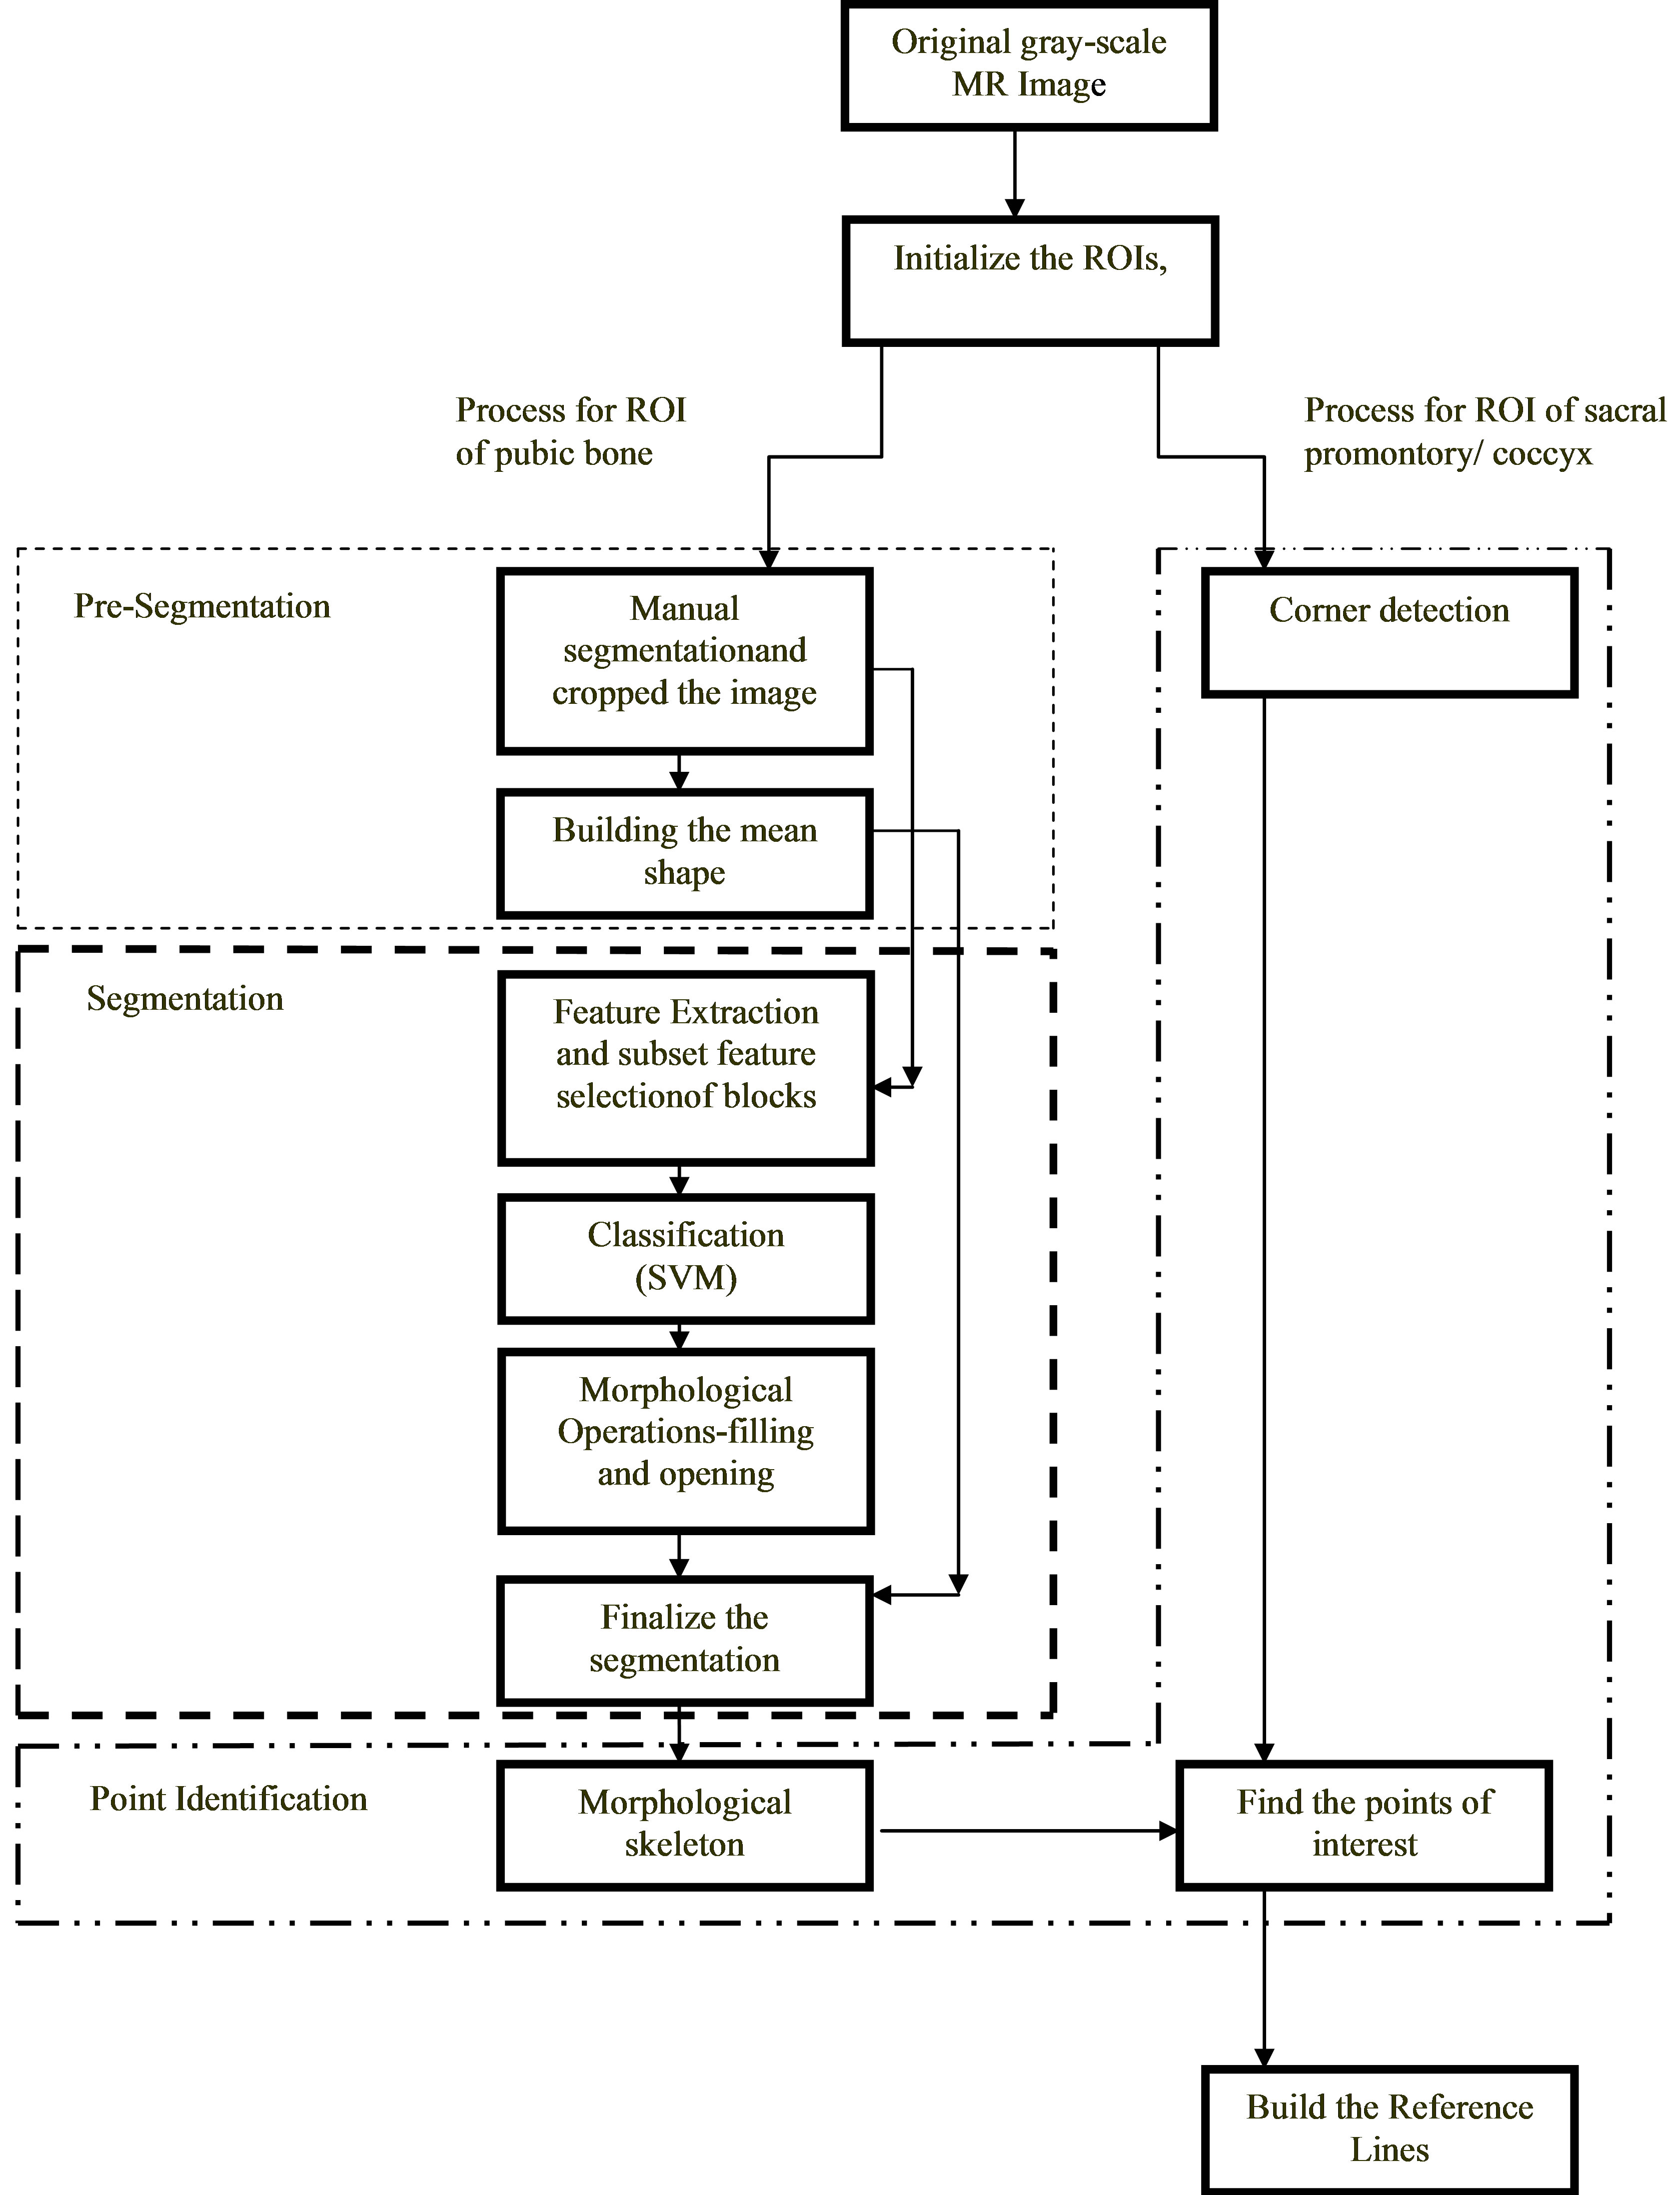
Figure 5. Overview of the stages of the proposed method.
first step is to construct a classifier structure based on the training data set. The second step is to apply the model to test example images. The blocks were trained according to the specified features which are contrast, mean, information measure of correlation 1, energy and cluster prominence and groups using SVM. Finally, the model is tested on test images. The anticipated outcome at the end of this process is a set of two groups of blocks that are automatically classified as foreground and background. The bone segmentation may occasionally include regions with similar intensity characteristics such as soft tissue. We will call these segmentation problems as “leaks”. Such occasional leak problems can take place when ROI and background regions become joined together due to the lack of strong edges between them. This situation requires operations to separate the two regions. Filling
 (a)
(a) (b)
(b)
Figure 6. (a) Original image; (b) Manually segmented image.
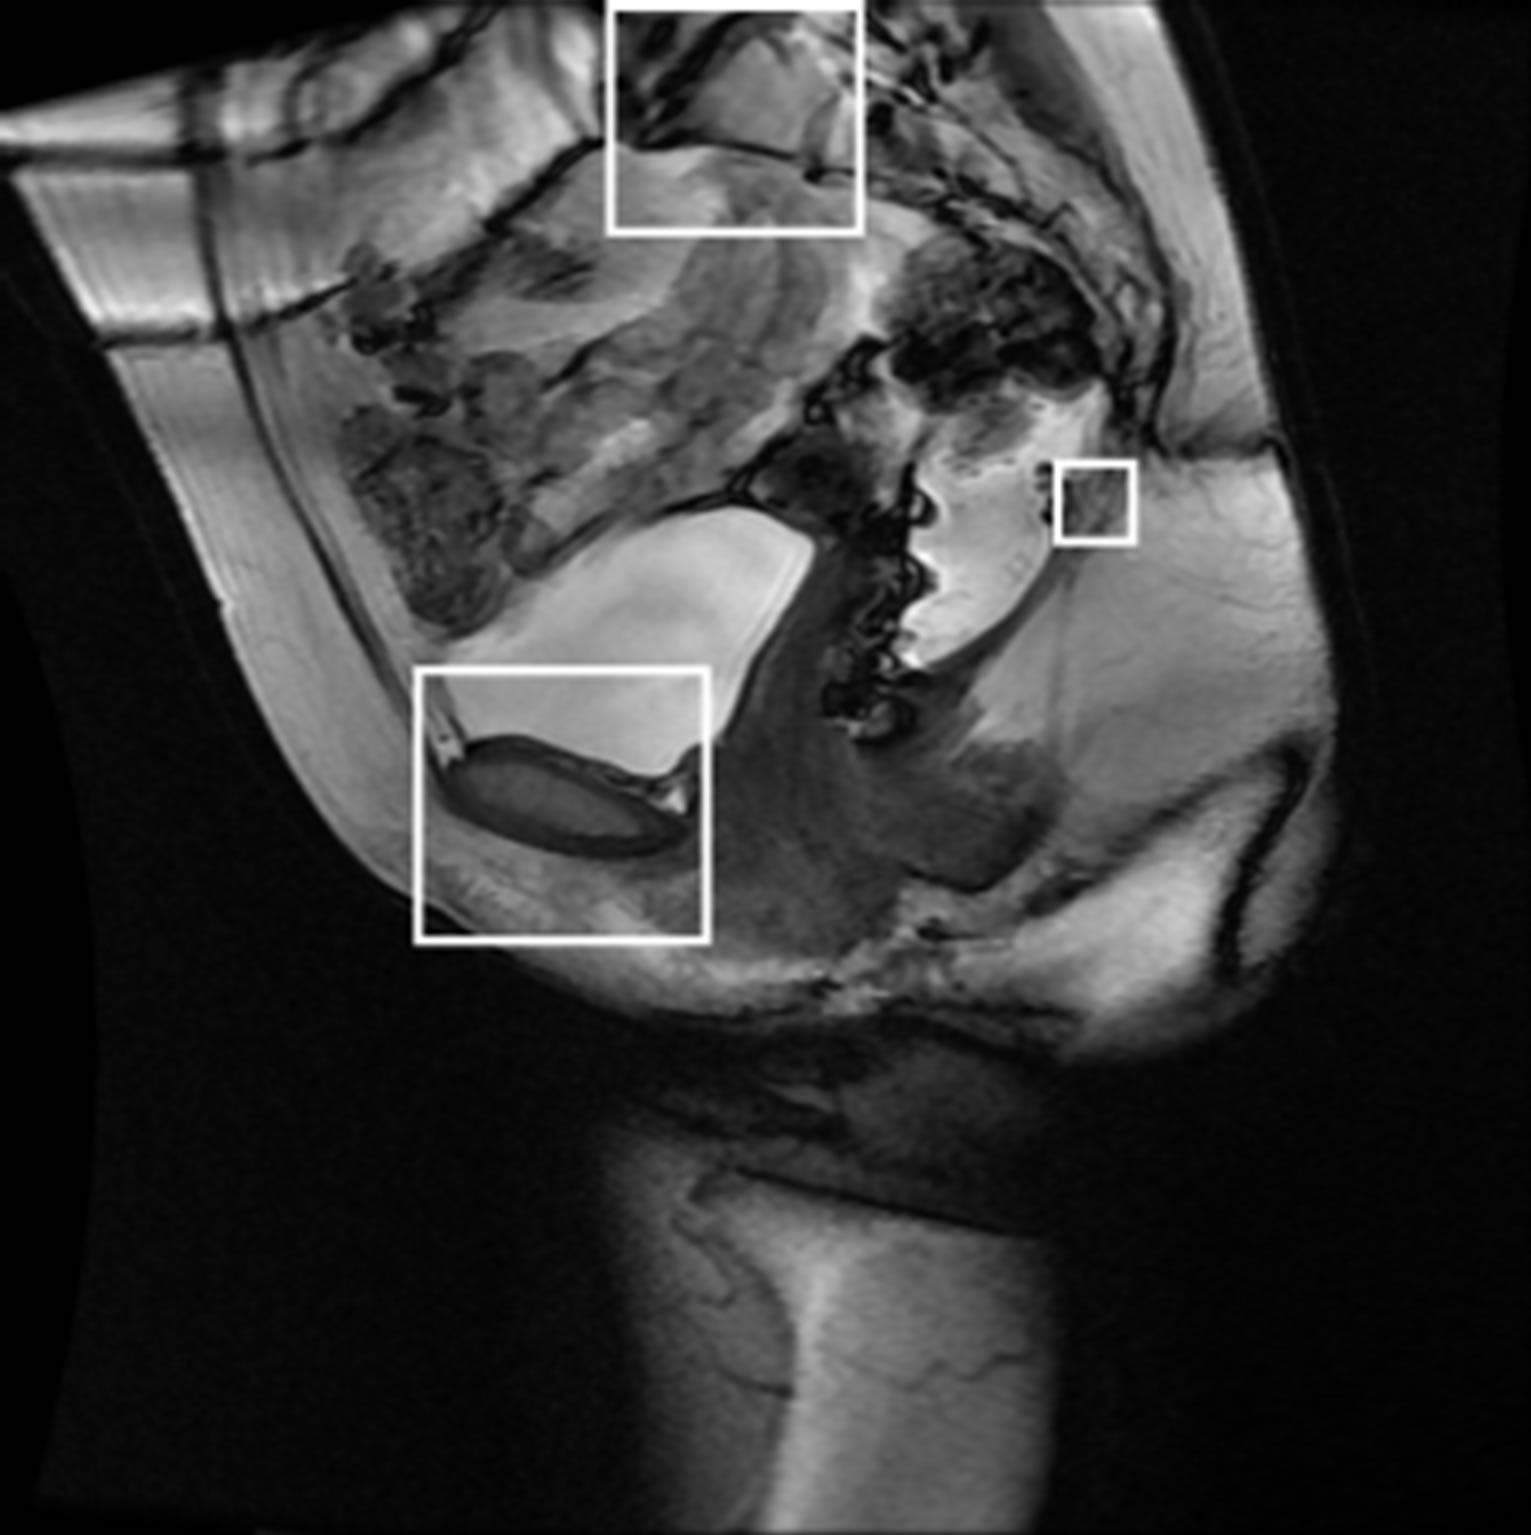
Figure 7. Regions of interests.
 (a)
(a)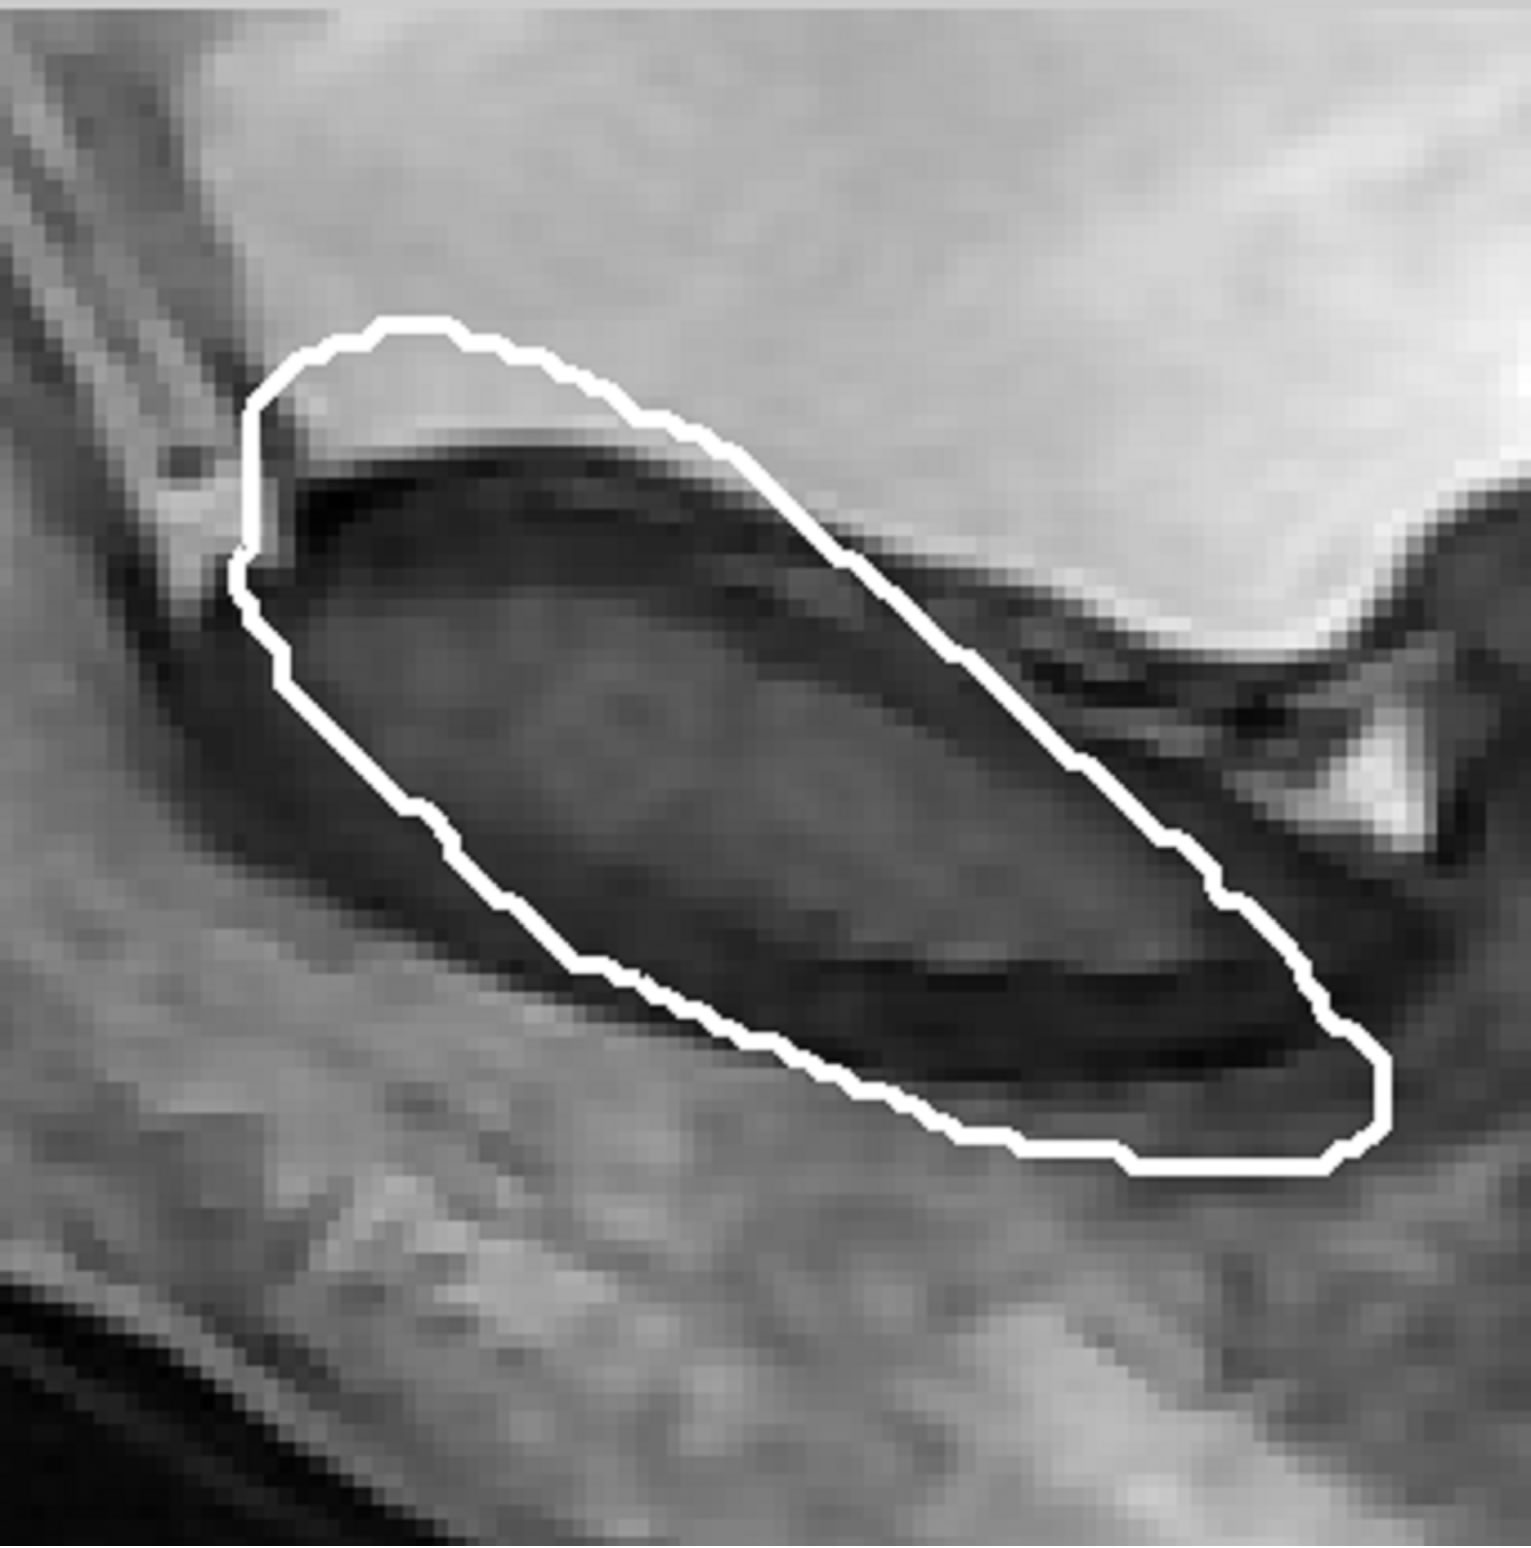 (b)
(b)
Figure 8. (a) Mean shape; (b) Overlap of mean shape to the segmented pubic bone.
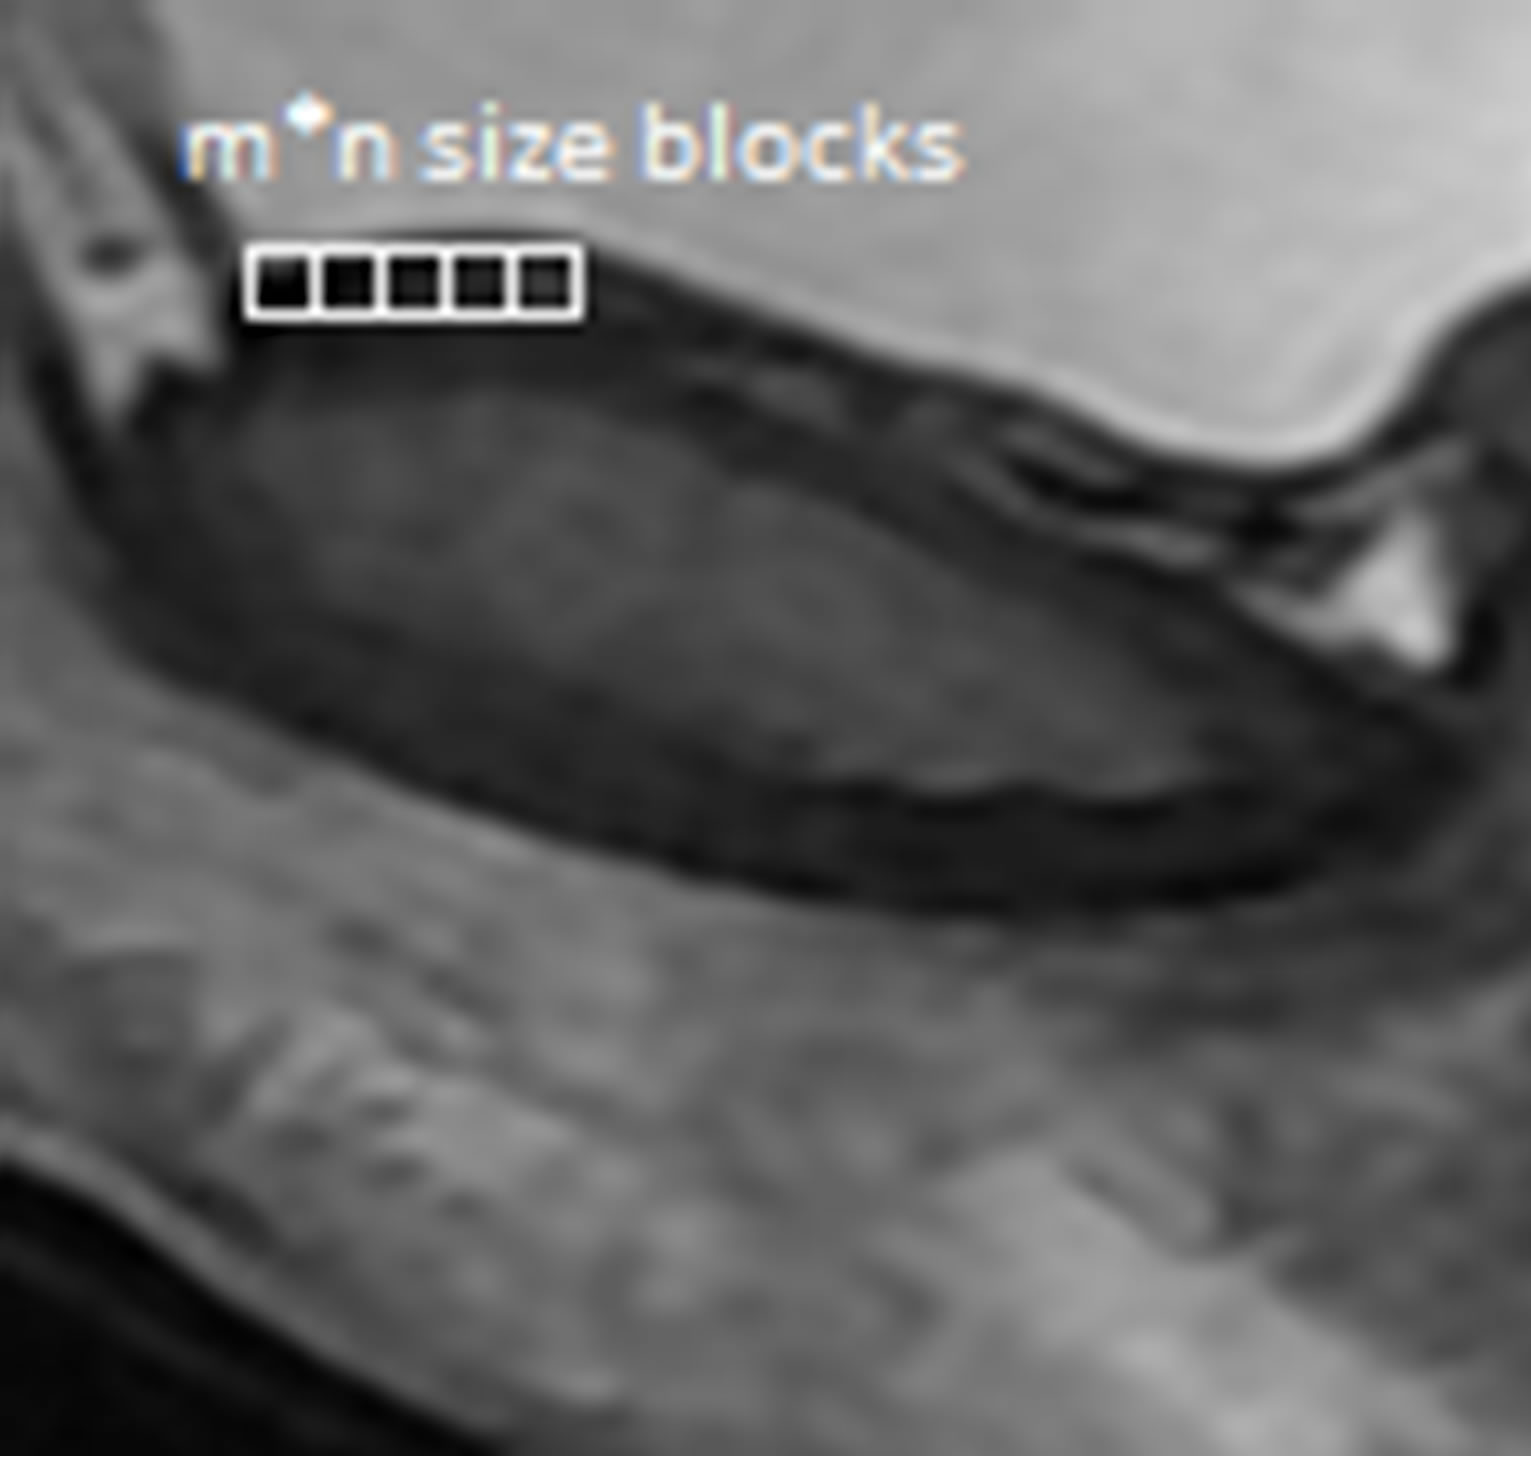
Figure 9. M × n size cropped original image and m × n size blocks.
operation was used to fill the small holes and gaps on the contours first and then a leak check is applied by performing an image opening using “disk” structuring elements. In case no leak is present, this operation results in shrinking or reducing the bone structure and leaving out small fragments that form the actual boundaries of the bone. A threshold of 100 pixels is used to identify the small fragments. If a leak is present, then the opening operation results in two reduced objects. The segmentation process is shown in Figure 10.
After obtaining the initial image, segmentation can be improved by incorporating prior shape information to the initial image as seen in Figures 11(c)-(d). Prior shape is registered with the initial image by using registration with the similarity type transformation.
3.3. Points of Interest Identification
The points located in the pubic bone can be found after the segmentation is performed. These points are located
 (a) (b) (c)
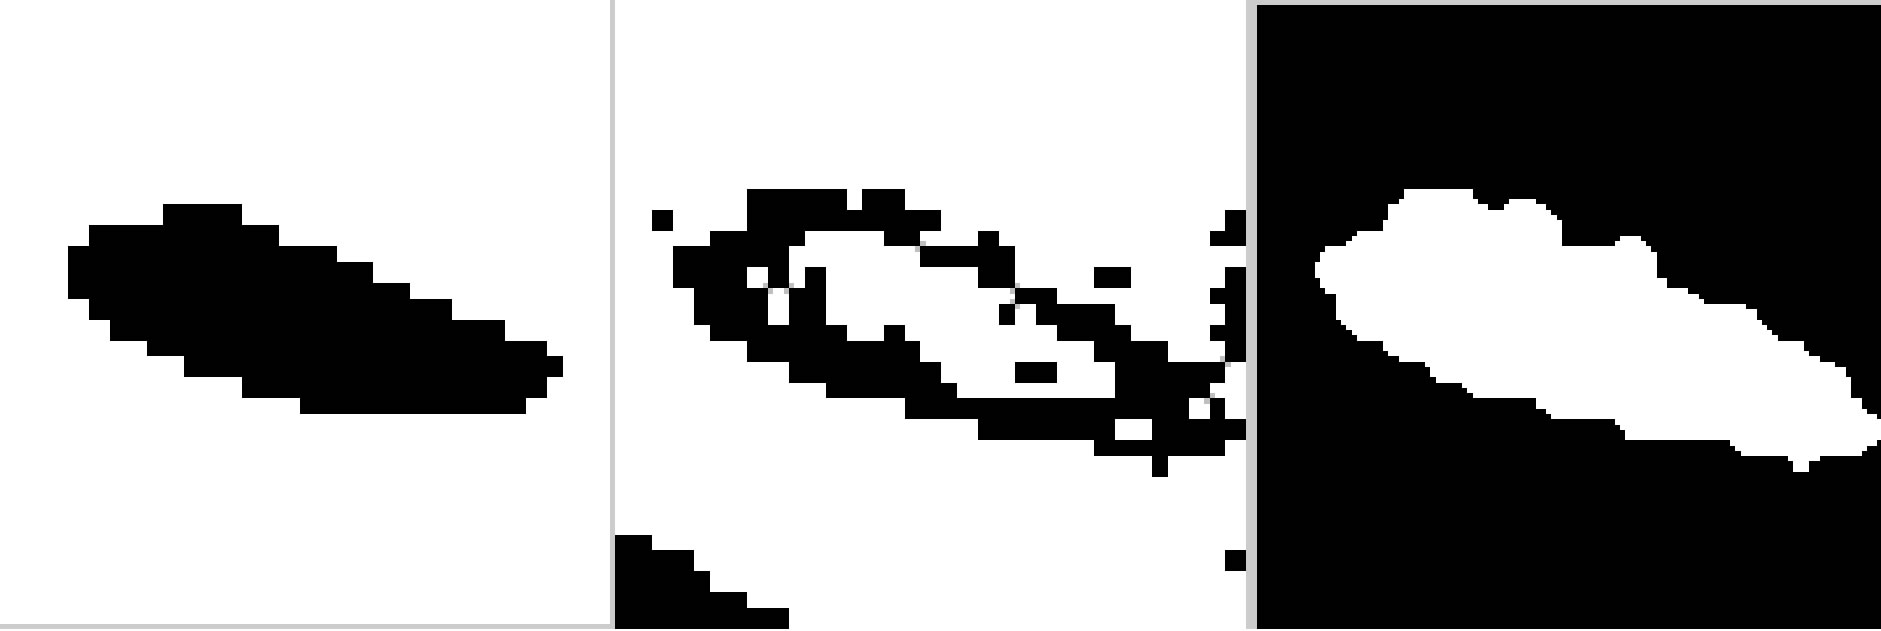
Figure 10. Segmentation of pubic bone with the proposed method. (a) Ground truth image; (b) Block classification image; (c) First phase image with morphological operation-filling and opening.
 (a)
(a) (b)
(b) (c)
(c)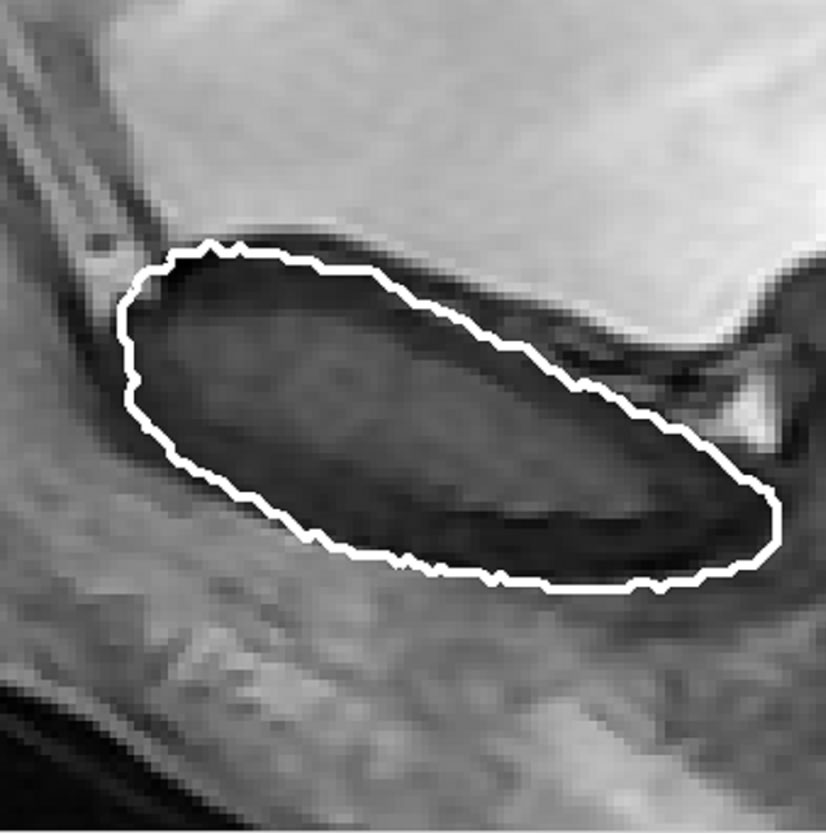 (d)
(d)
Figure 11. (a) The first phase image; (b) the mean shape; (c) and (d) final segmentation of pubic bone.
on the tips of the pubic bone and can be found by morphological skeleton operation. Skeleton operation removes pixels on the boundaries of the pubic bone but does not allow the object to break apart. The remaining pixels make up the image skeleton as seen in Figure 12.
On the other hand, points in the region of sacral promontory and coccyx are defined as a corner points for which there are two dominant and different edge directions on the local neighborhood of the point. For this reason, these points will be detected using corner detection algorithms. In our experiments, we adapted the Harris corner detection algorithm to detect the bony joints as shown in Figure 13. The Harris corner detector [34] is a very useful intersecting point detector. It is based on the
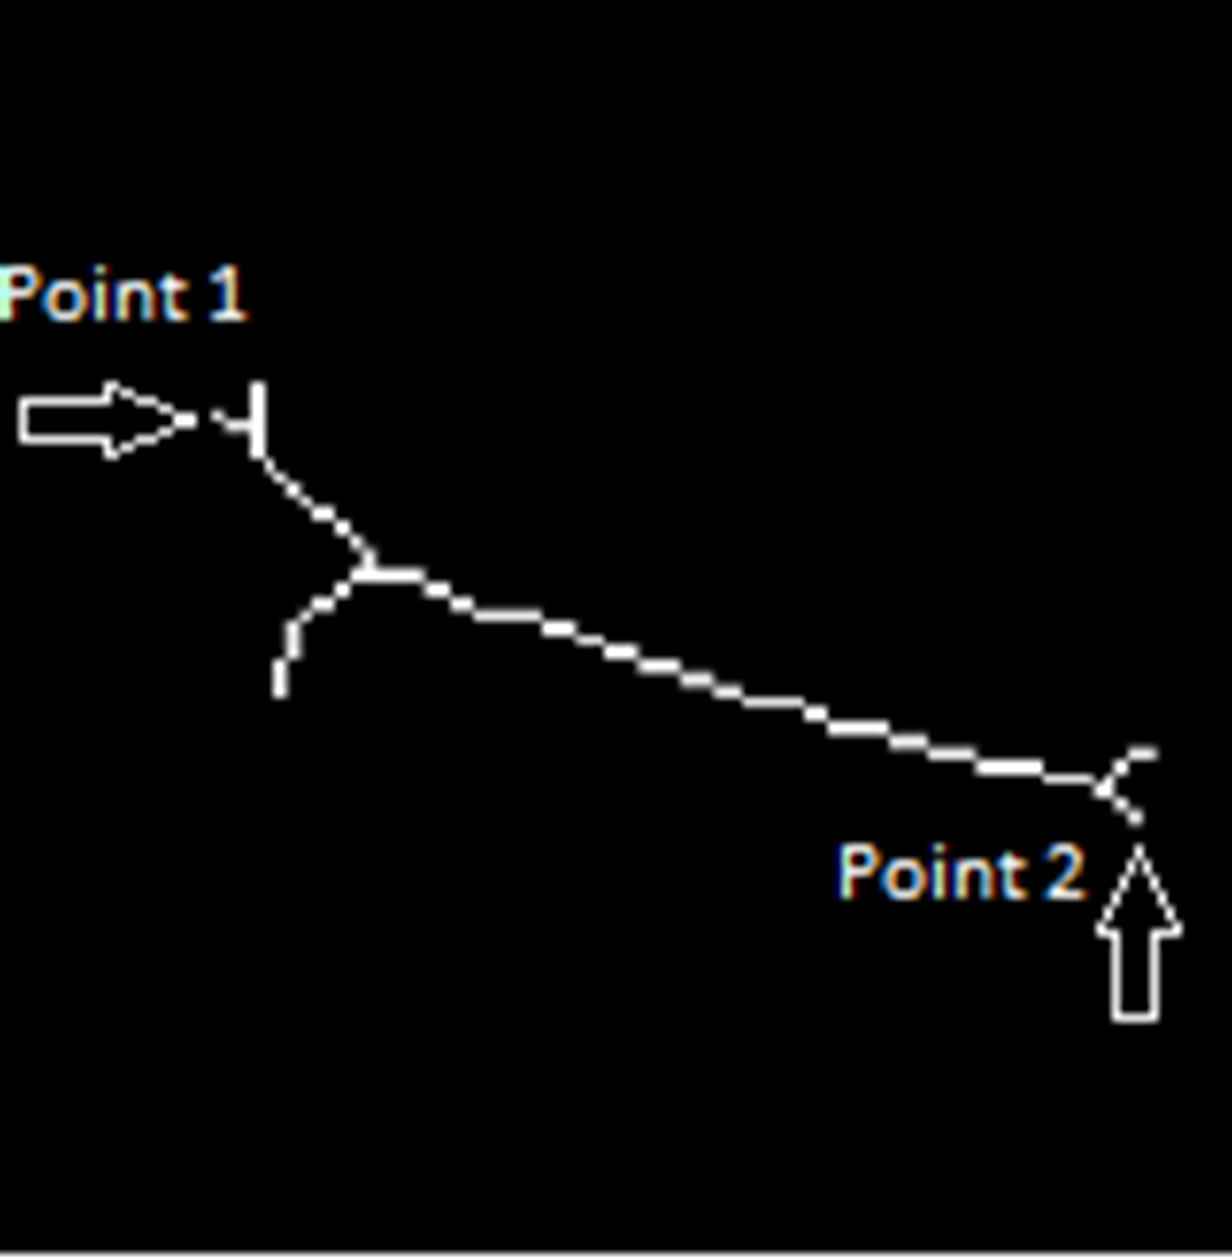
Figure 12. Morphological skeleton of final segmentation.
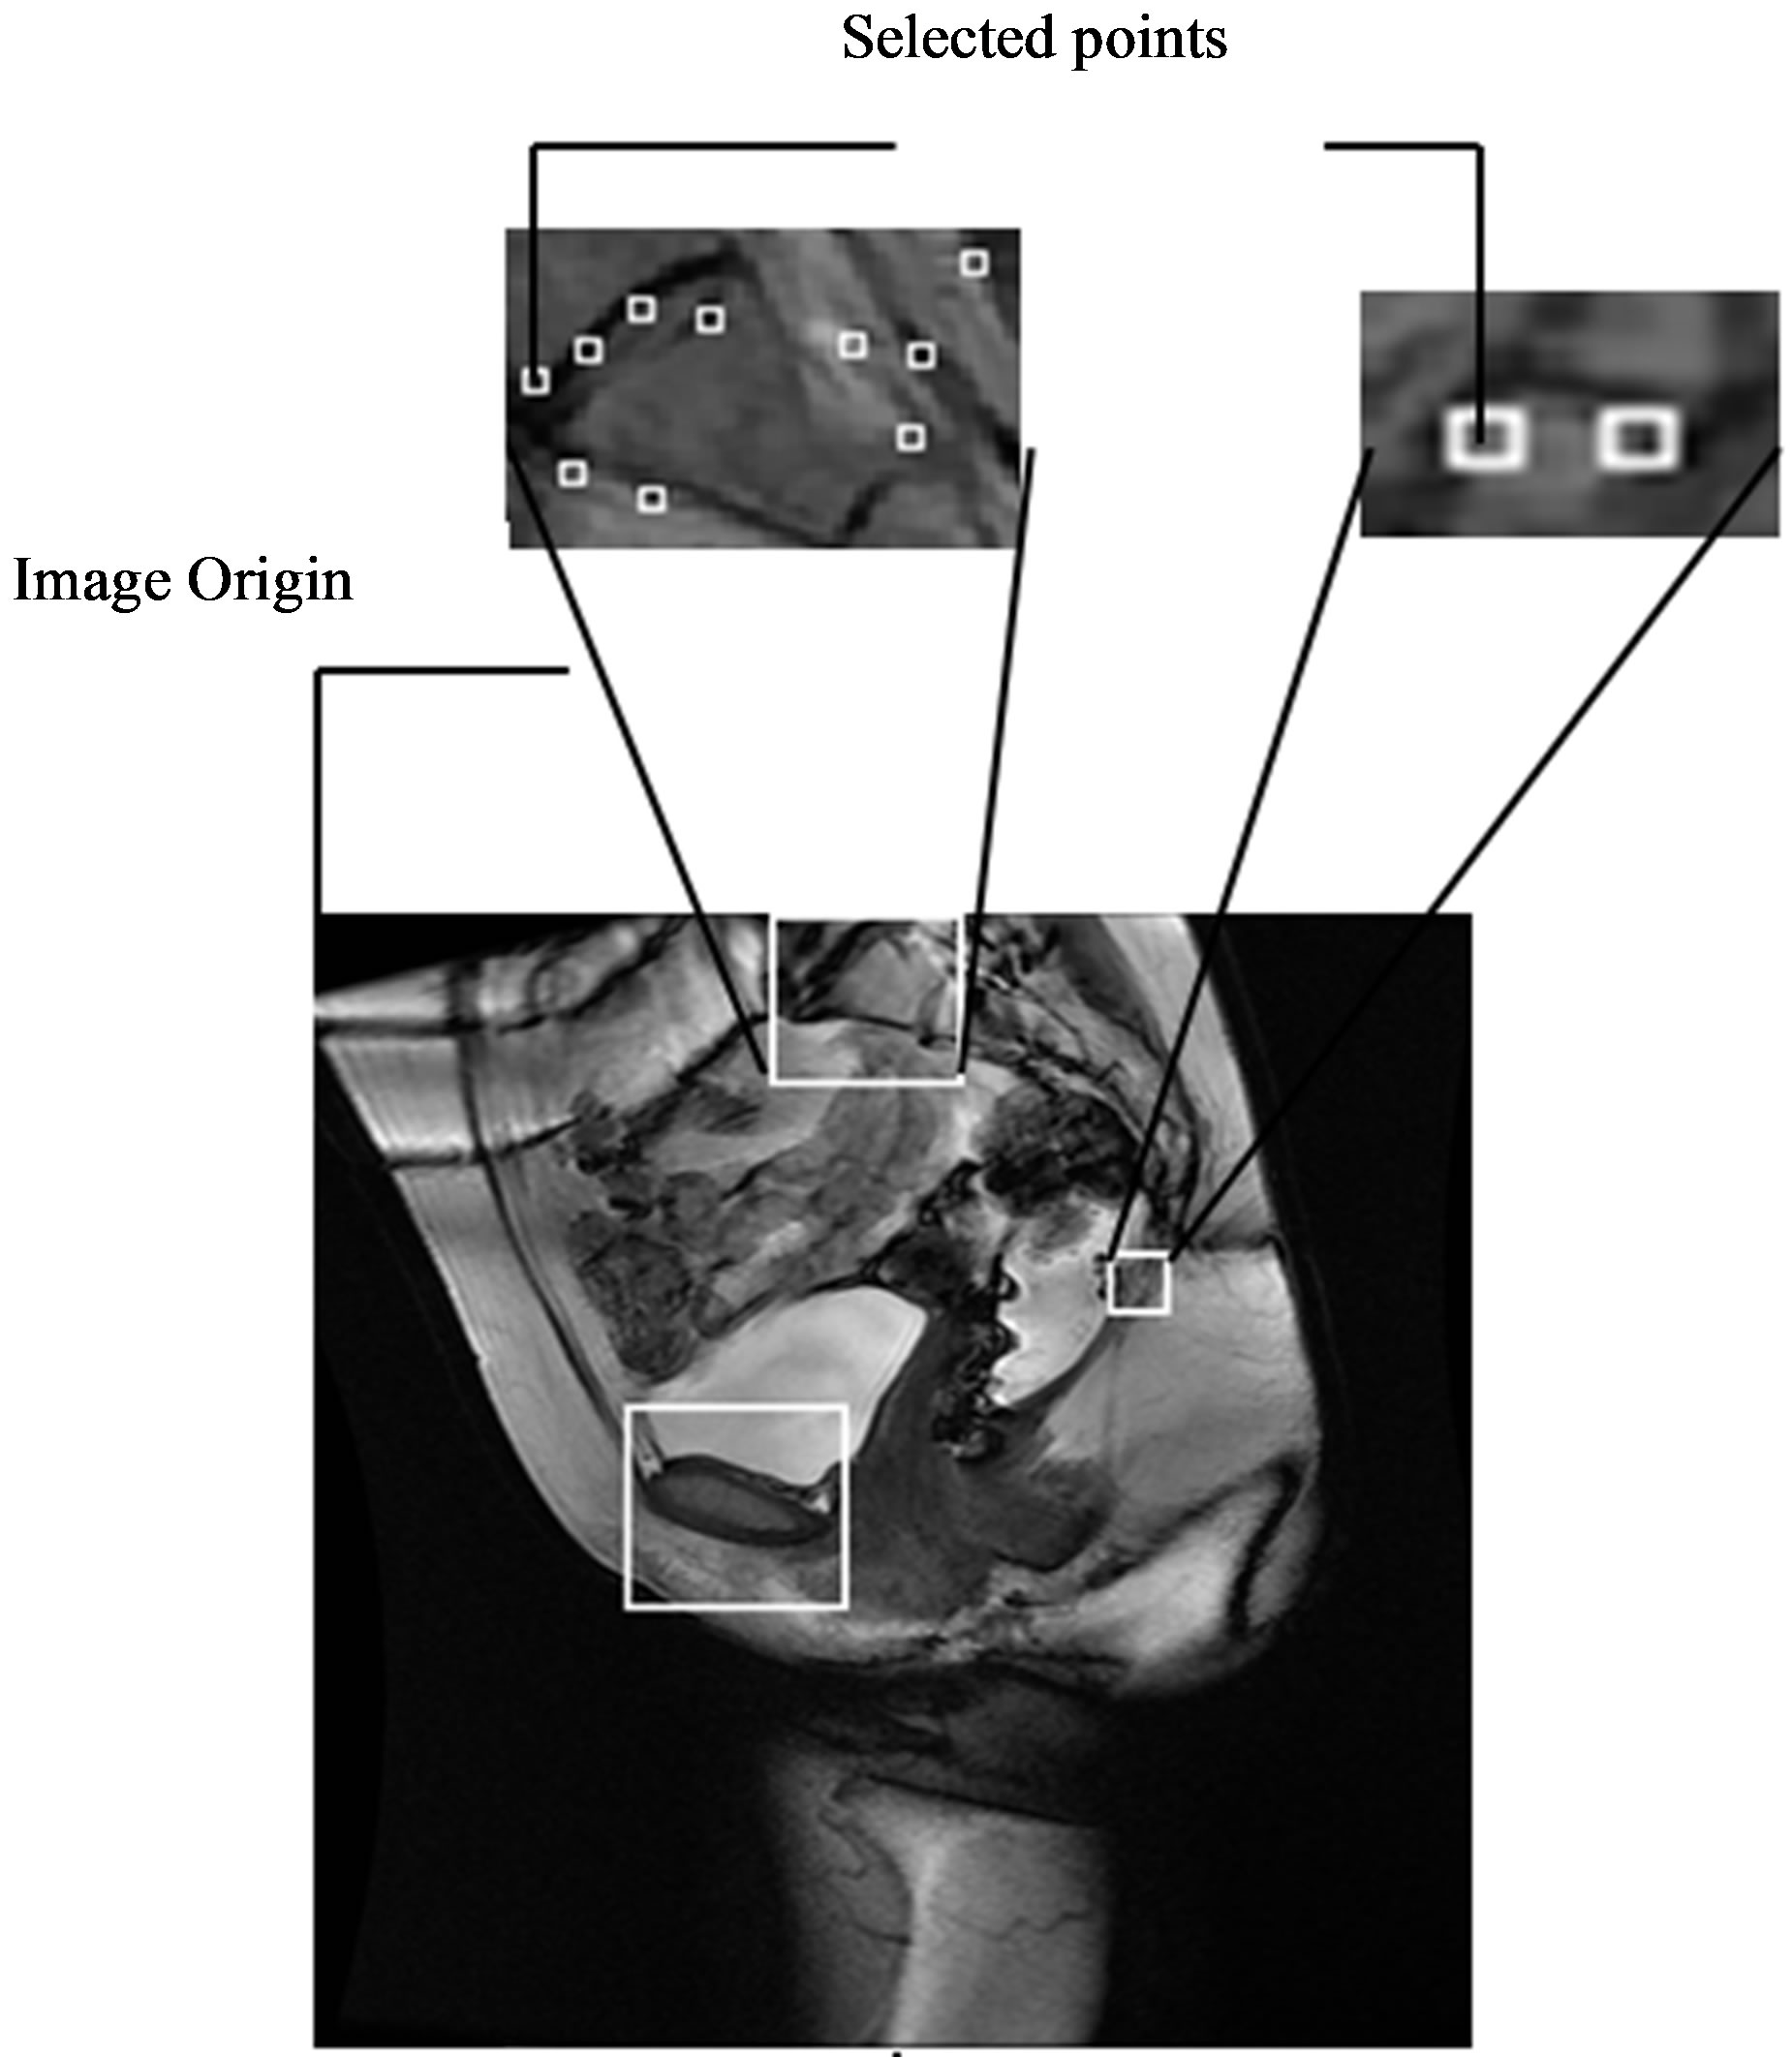
Figure 13. Reference bony joints for sacral promontory and coccyx.
local auto-correlation function of a signal that measures the local changes of the signal with patches shifted by a small amount in different directions.
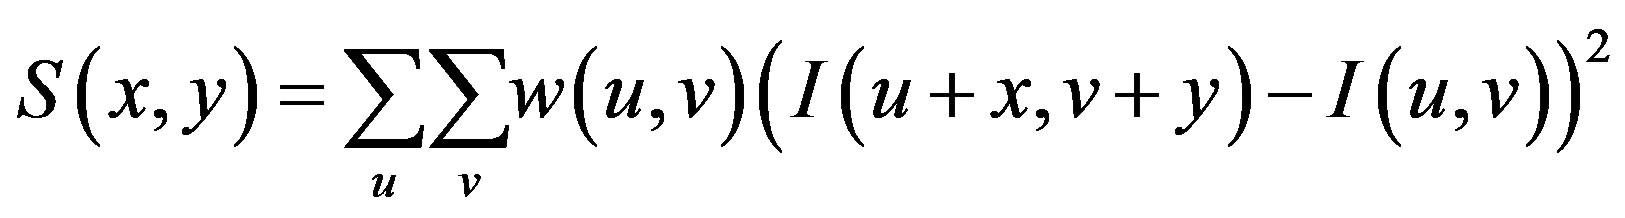
If I denotes a 2-D grayscale image, then, taking an image patch over the area  and shifting it by
 . The weighted sum of squared differences between these two patches is given by:
 can be approximated by a Taylor expansion and
  and
and  are the partial derivatives of I, such that
This produces the approximation

which can be written:
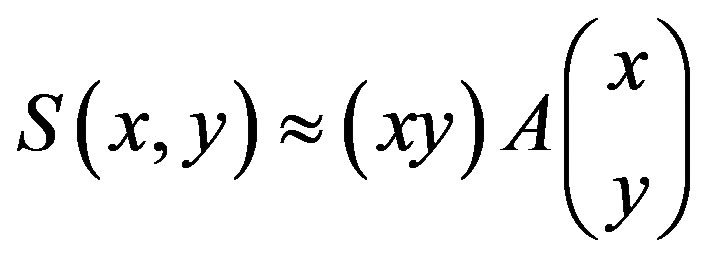
where A is the structure tensor,
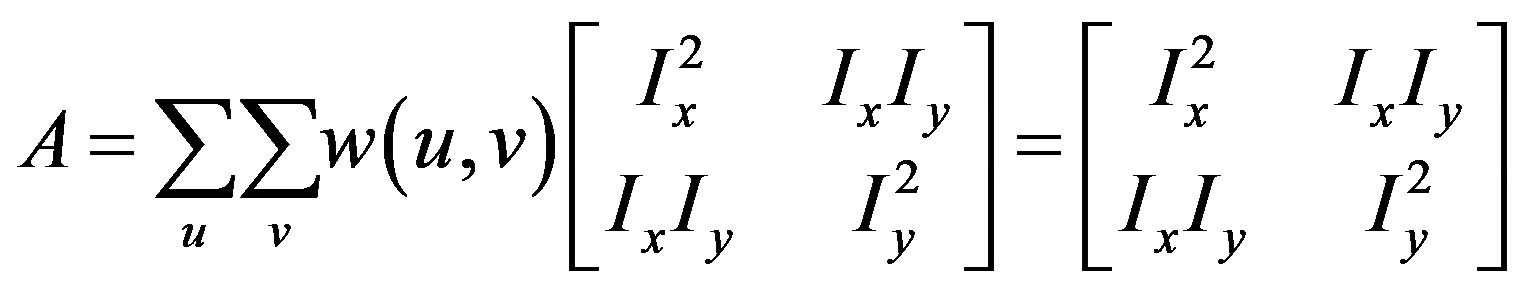
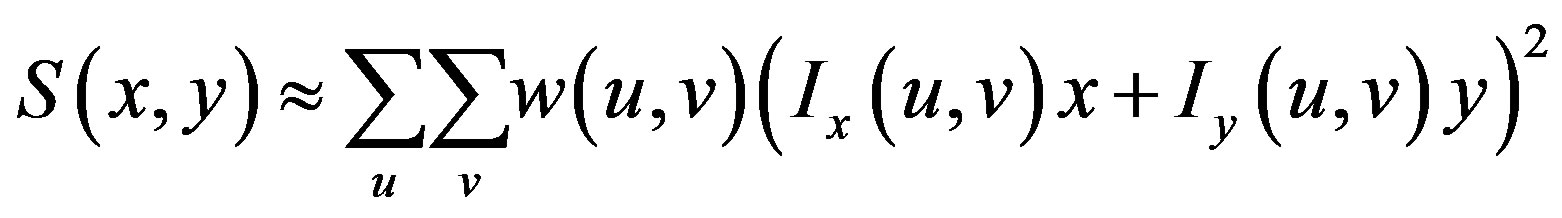
The matrix indicates the Harris matrix, and angle brackets denote averaging (i.e., summation over ). A corner is characterized by a large variation of S in all directions of the vector
 . By analyzing the eigenvalues, denoted λ, when both eigenvalues are small there is little change for any (u, v).
Once one of the eigenvalues is large and the other is small it indicates there is an edge, since one direction has high change, while the orthogonal direction has small change. A corner is indicated when both eigenvalues are large.
Since the algorithm detects several corner points, the points that have the smallest X value are selected as points of interest in each region. This is due to the particular location and orientation of the bone along the spine’s curvature.
Once the reference points that are located on the ROIs are identified, they are moved onto the original MR image as seen in Figure 14. These points are then linked to each other using lines that represent the reference lines normally used to characterize the presence and severity of pelvic organ prolapse: PCL and MPL. The identified points are also used to determine other reference lines such as Diagonal, Obstetric and True Conjugate lines, which could possibly be used for the diagnosis of different types of POP.
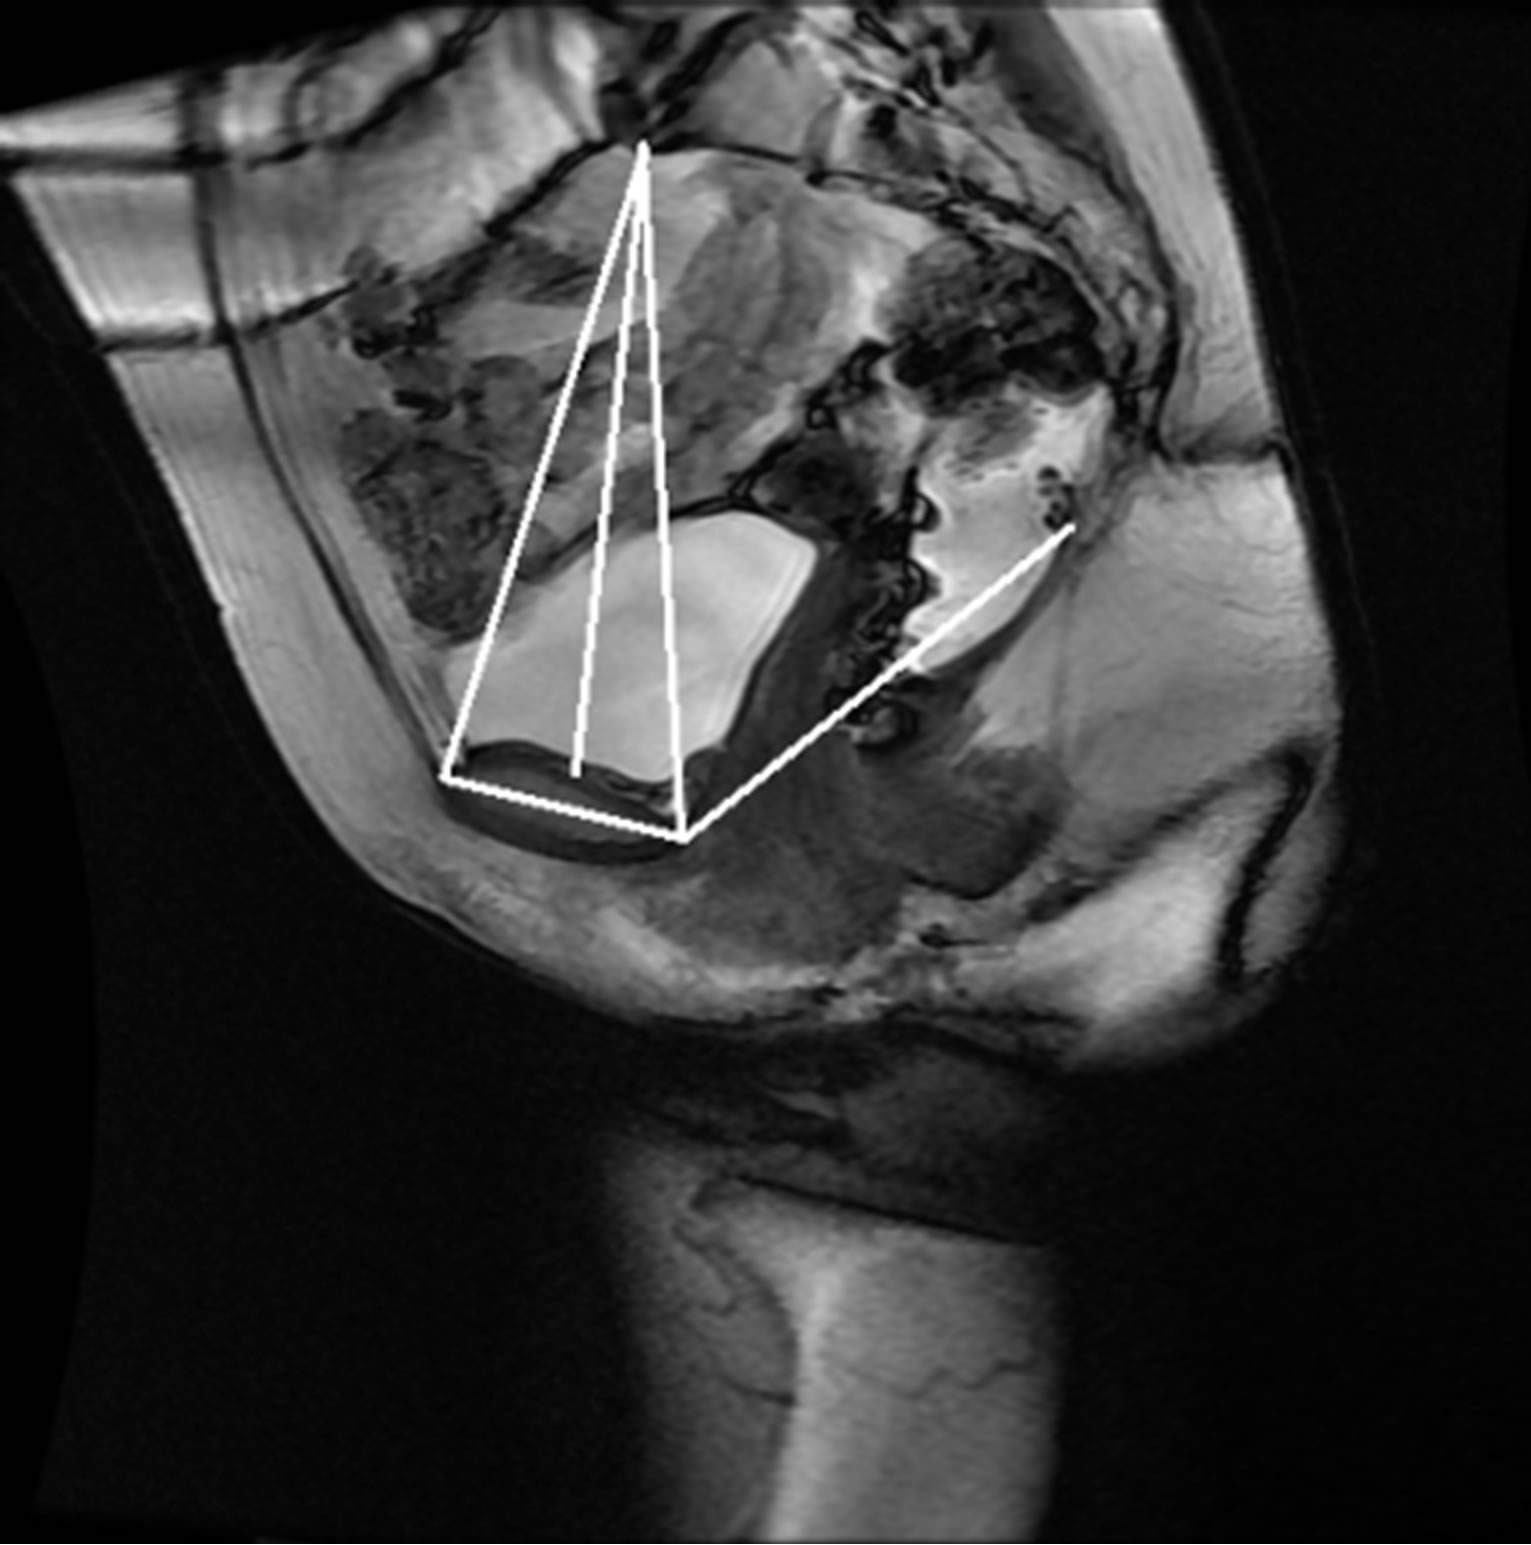
Figure 14. Semi-automatically generated reference and pelvic floor lines.
4. RESULTS
The anonymized midsagittal MR images of four subjects were analyzed in this study as seen in Figure 15. The study consisted of three parts: 1) extraction of regions by selecting a seed point manually; 2) classification of blocks by using SVM; and 3) identification of the intersecting points located in the regions of pubic bone, sacral promontory and coccyx.
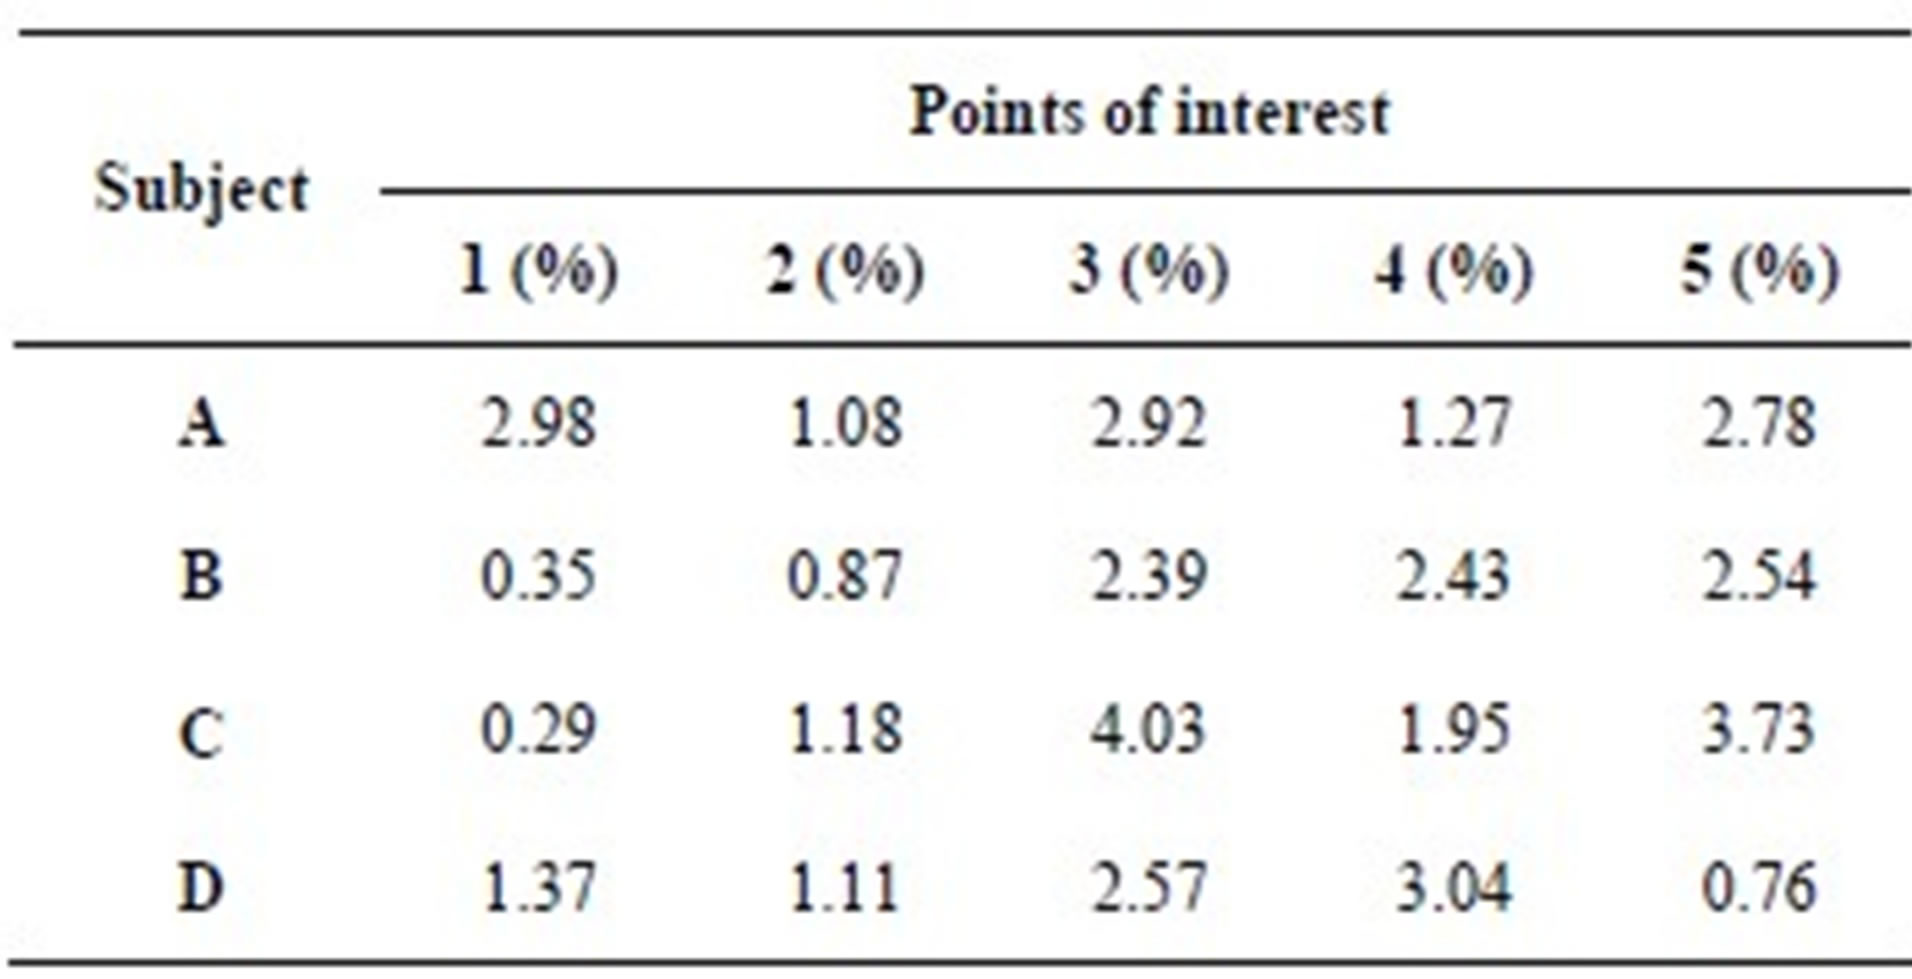
Table 1 presents the percentage of pixel-based distance between the points that were identified manually and semi-automatically over images of 512 × 512 pixels. The semi-automatically identified reference points were consistent with the points identified manually by an expert. Moreover, the points and lines generated semiautomatically were consistent throughout the trials on the same image. Therefore, the presented model can semiautomatically identify the points of interest to determine the reference lines for staging POP for all the subjects.
5. CONCLUSION
In this paper, we presented a scheme to semi-automatically identify the reference points and lines for the characterization of pelvic organ prolapse (POP) using MRI. The points were identified semi-automatically by using image segmentation based methods and intersecting points detection methods. The segmentation of bones is not an easy task because of weak boundaries. To overcome this problem, a multi-stage segmentation mechanism using texture based classification and prior shape information is presented. The presented method aims to overcome the current limitations of manually identifying points, lines, and measurements on MRI and enable the analysis of larger image samples. Experiments demonstrate that the presented semi-automated model provides
 (a)
(a) (b)
(b)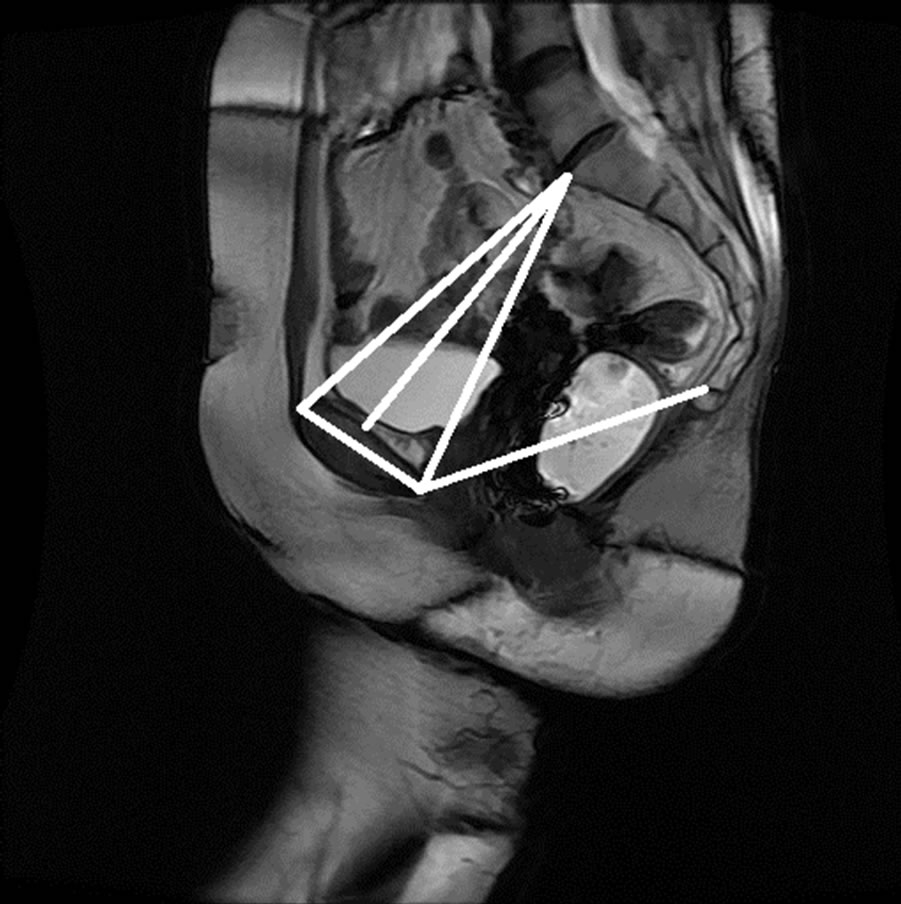 (c)
(c) (d)
(d)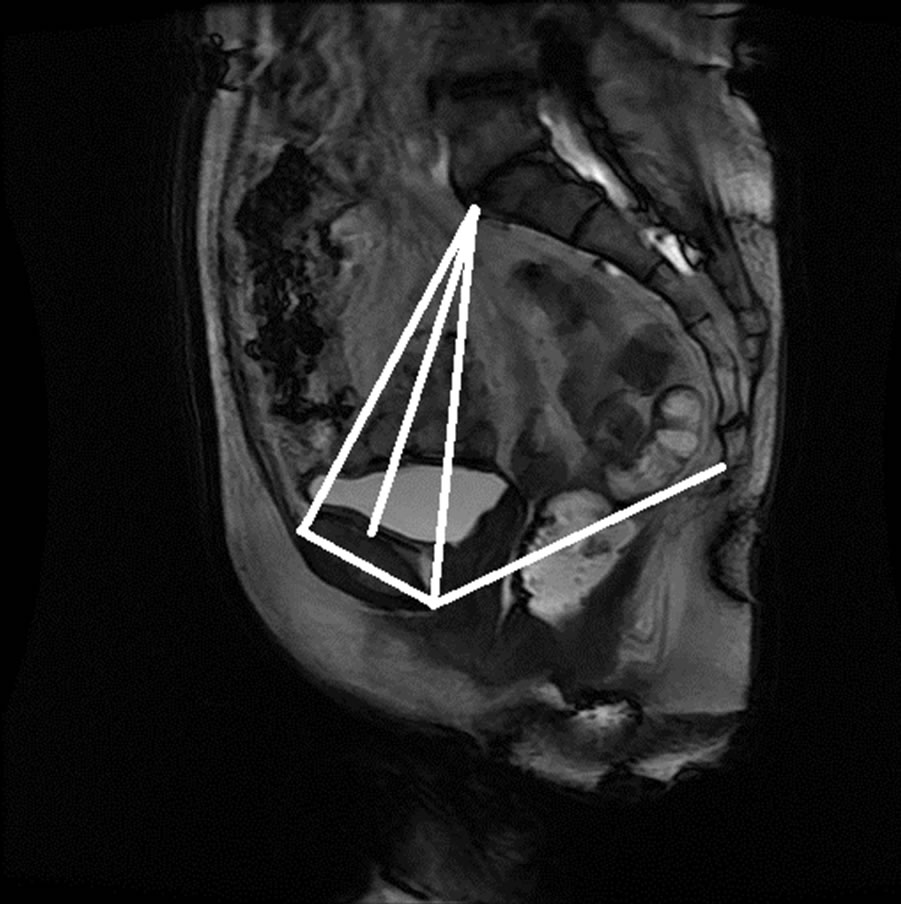 (e)
(e) (f)
(f) (g)
(g)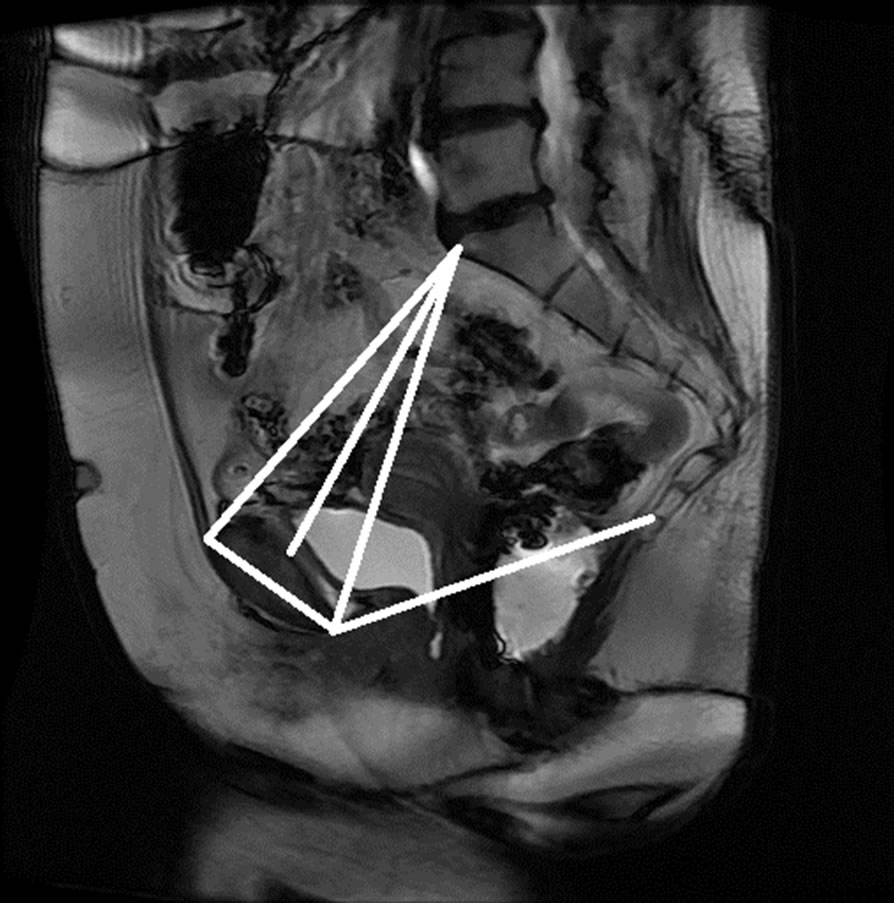 (h)
(h)
Figure 15. Manual measurement and semi-automatic measurement for (a)-(b) subject A; (c)-(d) subject B; (e)-(f) subject C; and (g)-(h) subject D.
consistent and fast measurement points on MRI compared with points identified manually by an expert. The automation of the pelvic floor measurements on radiologic studies will allow the use of imaging in predicting the development of POP in genetically predisposed patients, and will lead to preventive strategies. In the future, we will design a technique for the automated
Table 1. Percentage of pixel-based distance between manually and automatically identified landmarks.
identification of other points of interest to enable the analysis of measurements between different subjects and among groups.
6. ACKNOWLEDGEMENTS
This research work was partially supported by the University of South Florida Interdisciplinary Research Development Grant. Their support is greatly appreciated.
REFERENCES
- Dallenbach, P., Kaelin-Gambirasio, I., Jacob, S., Dubuisson, J.B. and Boulvain, M. (2008) Incidence rate and risk factors for vaginal vault prolapse repair after hysterectomy. International Urogynecology Journal, 19, 1623- 1629. doi:10.1007/s00192-008-0718-4
- AUGS Response: FDA Safety Communication (2011) http://goo.gl/9w2cz
- Olsen, A.L., Smith, V.J., Bergstrom, J.O., Colling, J.C. and Clark, A.L. (1997) Epidemiology of surgically managed pelvic organ prolapse and urinary incontinence. Obstetrics & Gynecology, 89, 501-506. doi:10.1016/S0029-7844(97)00058-6
- Bump, R.C., Mattiasson, A., Bo, K., Brubaker, L.P., DeLancey, J.O.L., Klarskov, P., Shull, B.L. and Smith, A.R.B. (1996) The standardization of terminology of female pelvic organ prolapse and pelvic floor dysfunction. American Journal of Obstetrics & Gynecology, 175, 10- 17. doi:10.1016/S0002-9378(96)70243-0
- Fayyad, A.H.S., Gurung. V., Prashar, S. and Smith, A. (2007) How accurate is symptomatic and clinical evaluation of prolapse prior to surgical repair? International Urogynecology Journal, 18, 1179-1183. doi:10.1007/s00192-007-0306-z
- Altman, D. Lopez, A., Kierkegaard, J., Zetterstrom, J., Falconer, C., Pollack, J. and Mellgren, A. (2005) Assessment of posterior vaginal wall prolapse: Comparison of physical findings to cystodefecoperitoneography. International Urogynecology Journal and Pelvic Floor Dysfunction, 16, 96-103.
- Agildere, A.M., Tarhan, N.C., Ergeneli, M.H., Yologlu, Z., Kurt, A., Akgun, S. and Kayahan, E.M. (2003) MR rectography evaluation of rectoceles with oral gadopentetate dimeglumine and polyethylene glycol solution. Abdominal Imaging, 28, 28-35. doi:10.1007/s00261-002-0023-5
- Kaufman, H.S., Buller, J.L., Thompson, J.R., Pannu, H.K., DeMeester, S.L., Genadry, R.R., Bluemke, D.A., Jones, B., Rychcik, J.L. and Cundiff, G.W. (2001) Dynamic pelvic magnetic resonance imaging and cystocolpoproctography alter surgical management of pelvic floor disorders. Diseases of the Colon & Rectum, 44, 1575- 1583. doi:10.1007/BF02234374
- Colaiacomo, M.C., Masselli, G., Polettini, E., Lanciotti, S., Casciani, E., Bertini, L. and Gualdi, G. (2009) Dynamic MR imaging of the pelvic floor: A pictorial review. Radiographics, 29, e35. doi:10.1148/rg.e35
- Ginath, S., Garely, A., Luchs, J.S., Shahryarinejad. A., Olivera, C., Zhou, S., Ascher-Walsh, C., Condrea, A., Brodman, M. and Vardy, M. (2011) MRI pelvic landmark angles in the assessment of apical pelvic organ prolapse. Archives of Gynecology and Obstetrics, 284, 365-370. doi:10.1007/s00404-010-1648-1
- Goh, H.S.V., Kaplan, G., Healy, J.C. and Bartram, C.I. (2000) Dynamic MR imaging of the pelvic floor in asymptomatic subjects. American Journal of Roentgenology, 174, 661-666.
- Healy, J.C. and Reznek, R.H. (1997) Dynamic MR imaging compared with evacuation proctography when evaluating anorectal configuration and pelvic floor movement. American Journal of Roentgenology, 169, 775-779.
- Lienemann, A.C.A., Baron, A., Kohn, P. and Reiser, M. (1997) Dynamic MR colpocystorectography assessing pelvic floor descent. European Radiology, 7, 1309-1317. doi:10.1007/s003300050294
- Broekhuis, S.R., Futterer, J.J., Barentsz, J.O. and Vierhout, M.E. (2009) A systematic review of clinical studies on dynamic magnetic resonance imaging of pelvic organ prolapse: The use of reference lines and anatomical landmarks. International Urogynecology Journal and Pelvic Floor Dysfunction, 20, 721-729. doi:10.1007/s00192-009-0848-3
- Mao, J. and Jain, A. (1992) Texture classification and segmentation using multiresolution simultaneous autoregressive models. Pattern Recognition, 25, 173-188. doi:10.1016/0031-3203(92)90099-5
- Hofmann, T., Puzicha, J. and Buhmann, J. (1998) Unsupervised texture segmentation in a deterministic annealing framework. IEEE Transactions on Pattern Analysis and Machine Intelligence, 20, 803-818. doi:10.1109/34.709593
- Hall, L.O., Bensaid, A.M., Clarke, L.P., Velthuizen, R.P., Silbiger, M.S. and Bezdek, J.C. (1992) A comparison of neural network and fuzzy clustering techniques in segmenting magnetic resonance images of the brain. IEEE Transactions on Neural Networks, 3, 672-681. doi:10.1109/72.159057
- Tremeau, A. and Borel, N. (1997) A region growing and merging algorithm to colour segmentation. Pattern Recognition, 30, 1191-1203. doi:10.1016/S0031-3203(96)00147-1
- Hojjatoleslami, S. and Kittler, J. (1998) Region growing: A new approach. IEEE Transactions on Image Processing, 7, 1079-1084. doi:10.1109/83.701170
- Bao, P., Zhang, L. and Wu, X. (2005) Canny edge detection enhancement by scale multiplication. IEEE Transactions on Pattern Analysis and Machine Intelligence, 27, 1485-1490. doi:10.1109/TPAMI.2005.173
- Bao, P. and Zhang, L. (2003) Noise reduction for magnetic resonance images via adaptive multiscale products thresholding. IEEE Transactions on Medical Imaging, 22, 1089-1099. doi:10.1109/TMI.2003.816958
- Canny, J. (1986) A computational approach to edge detection. IEEE Transactions on Pattern Analysis and Machine Intelligence, 8, 679-698. doi:10.1109/TPAMI.1986.4767851
- Terzopoulos, D. and Fleischer, K. (1988) Deformable models. The Visual Computer, 4, 306-331. doi:10.1007/BF01908877
- Davatzikos, C., Fan, Y., Wu, X., Shen, D. and Resnick, S.M. (1995) An active contour model for mapping the cortex. IEEE Transactions on Medical Imaging, 14, 65. doi:10.1109/42.370403
- Ray, N. (2003) Merging parametric active contours within homogeneous image regions for MRI-based lung segmentation. IEEE Transactions on Fuzzy Systems Medical Imaging, 22, 189-199. doi:10.1109/TMI.2002.808354
- Lorigo, L. (1998) Segmentation of bone in clinical knee MRI using based geodesic active contours. MICCAI.
- Fripp, J. Crozier, S., Warfield, S.K. and Ourselin, S. (2007) Automatic segmentation of the bone and extraction of the bone-cartilage interface from magnetic resonance images of the knee. Physics in Medicine and Biology, 52, 1617-1631. doi:10.1088/0031-9155/52/6/005
- Bourgeat, P., Fripp, J., Stanwell, P., Ramadan, S. and Ourselin, S. (2007) MR image segmentation of the knee bone using phase information. Medical Image Analysis, 11, 325-335. doi:10.1016/j.media.2007.03.003
- Schmid, J. and Magnenat-Thalmann, N. (2008) MRI bone segmentation using deformable models and shape priors. Medical Image Computing, 5241, 119-126.
- Carballido-Gamio, J., Belongie, S. and Majumdar, S. (2004) Normalized cuts in 3-D for spinal MRI segmentation. IEEE Transactions on Medical Imaging, 23, 36-44. doi:10.1109/TMI.2003.819929
- Liu, L., Raber, D., Nopachai, D., Commean, P., Sinacore, P., Prior, F., Pless, R. and Ju, T. (2008) Interactive separation of segmented bones in ct volumes using graph cut. MICCAI, ser. LNCS.
- Boykov, Y. and Kolmogorov, V. (2004) An experiemental comparison of min-cut/maxflow algorithms for energy minimization in vision. IEEE Transactions on Pattern Analysis and Machine Intelligence, 26, 1124-1137. doi:10.1109/TPAMI.2004.60
- Haralick, R.M. and Shapiro, L.G. (1985) Survey of image segmentation techniques. Computer Vision Graphics Image Process, 29, 100-132. doi:10.1016/S0734-189X(85)90153-7
- Schmid, C., Mohr, R. and Bauckhage, C. (2000) Evaluation of interest point detectors. International Journal of Computer Vision, 37, 151-172. doi:10.1023/A:1008199403446