iBusiness
Vol.2 No.2(2010), Article ID:1956,11 pages DOI:10.4236/ib.2010.22018
Customer Care Management Model for Service Industry
![]()
1Department of Mechanical Engineering, Government College of Technology, Coimbatore, India; 2Principal, Angel College of
Engineering and Technology, Tirupur, India.
Email: raja8011@yahoo.co.in
Received January 12th, 2010; revised February 23rd, 2010; accepted April 11th, 2010.
Keywords: Customer complaint, CCM model, TQM, Six Sigma, QFD, Critical-to-Quality, DMAIC, Service industry
ABSTRACT
Purpose – This paper describes a model for Customer care management in an automotive service industry. Design/ methodology/approach – Customer care management (CCM) model is developed using TQM techniques, Quality Function Deployment (QFD) and Six Sigma. The matrix structure in QFD is used to transform customer complaints into Critical-to-Quality (CTQ) parameters. By using Six Sigma DMAIC approach, the customer complaint parameters are analyzed for improvement. Findings – The application of CCM model in an automobile service industry has determined that the workload planning is the chronic problem for customer complaint. Further analysis through this model leads to restructuring of existing workload planning practice through a set of algorithms. Research limitations/implications – CCM model lacks to accommodate the effect of relationship between rectification factors. Also competitor technical contemplation is not possible in this model. Originality/value – Customer is the focal point and early response to their complaint is the key to success of every business. This paper has developed a structured complaint management practice which warrants the timely response to customer complaints and speedy resolution for survival in today’s customer driven market.
1. Introduction
Customer is the focal point of every business [1]. The very existence of business depends on customer satisfaction. Customer expects high quality services, even willing to pay premium for better service [2]. From a customer perspective, good service quality leads to long-term customer relationships measured by re-patronage and cross sales, also customer recommend the service to others [3]. Services are fundamentally different from manufacturing; this difference contributes to the increased complexity of service quality [4]. Firms therefore make all efforts for providing high quality services to please customers. But in spite of best efforts an occasional complaint is inevitable [5]. However a good recovery can turn angry, dissatisfied customers into loyal ones, again [6]. The key to success lies in recognizing the importance of responding fairly and effectively to customer complaints [7]. Complaints are often a treasuring trove of information leading to constructive ideas for improving and upgrading services in the future [8]. Researches indicates that only a small number of dissatisfied customers actually complain and give the company an opportunity to correct itself. Others simply shift loyalties [9]. Hence it is become important to resolve complaints in a fair manner at the earliest instead of taking a defensive approach [10]. Structured customer complaint management is one of the tenets for problem prevention in long term [11]. This paper attempts to develop one such customer care management [CCM] model. In this model, speedy complaint resolution is aimed through Quality Function Deployment [QFD], a customer voice processing technique and Six Sigma, a zero complaint process approach. This CCM model is introduced in an automotive service centre to retain existing customers than to go scouting new ones.
2. Quality Function Deployment
Quality Function Deployment [QFD] is a technique to process customer complaints and translate them into possible factors for rectification [12]. The House of Quality matrix [HOQ] is the main component in QFD. It comprises customer information matrix [Horizontal portion] and technical information matrix [Vertical portion] as shown in Figure 1. In HOQ, customer complaints (WHATs) are plotted in horizontal and the rectification factors (HOWs)
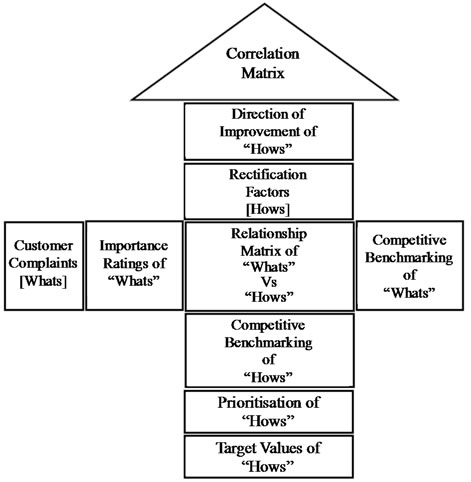
Figure 1. House of quality matrix
are correlated in the vertical. This matrix format felicitates examination, cross checking, analysis of information, helps organization to set competitive targets and to determine the priority action issues [13].
3. Six Sigma
In as early as 1987, Motorola initiated the Six Sigma program with a focus on the design of products and processes so that defects would almost never occur [14]. Six Sigma is a rating that signifies “best in class”, with only 3.4 complaints per million [15]. Six Sigma examines quality, as defined by the customer, in order to focus on the requirements and expectations that are truly critical and measurable [16,17]. The most important methodology in Six Sigma program is DMAIC (Define-MeasureAnalyze-Improve-Control) as illustrated in Figure 2.
In the Define phase, the problem to be solved is defined, evaluated and selected based on a cost/benefit analysis and a set of criteria determined by the upper management. Subsequently, in the Measure phase, the problem is translated into a measurable form by means of Critical-To-Quality (CTQ) characteristics. The data pertinent to the problem is assembled and a baseline study is conducted. In the Analyze phase, a thorough diagnosis of the current situation is carried out to identify the major factors that may potentially influence the CTQs. In this phase, statistical tools, ranging from simple to advanced, play a key role. In the Improve phase, the project team designs and implements the solutions or adjustments to the process to improve the performance of the CTQs. Finally, in the Control phase, process management and the control systems are developed and adjusted to assure that the improvements are sustainable [18].
4. Customer Care Management Model
Six Sigma basically operates on Critical to Quality Characteristics [CTQs] which represents the customer’s complaints. Since the customer expectations are qualitative in nature, in CCM model, QFD is used to convert them into quantitative CTQ for the ease of complaint rectification and service improvement through Six Sigma. This model includes five distinct phases as shown in Figure 3 for managing complaints in sequence. In this model, QFD serves two purposes; one to transform the customer complaints into attainable factor and two to define and develop a problem statement. Hence in the DMAIC methodology of Six Sigma, the define phase is overlapped with QFD. The output of QFD matrix analysis is directly fed to measure phase.
The activities involved in each phase are:
§ In QFD phase, the customer and their complaints are identified through a structured survey method. Then it is processed against the possible rectification factors to determine the CTQ.
§ In measure phase, the CTQ is expressed in terms of sigma quality value for comparing the performance before and after improvement.
§ In analysis phase, the present performance gap is analyzed and suitable solution direction is indicated.
§ In improve phase, the present system is improved with identified solution as expected by customers.
§ In control phase, to sustain improvement, suitable control measure are identified and put in place.

Figure 2. DMAIC methodology

Figure 3. CCM model
The possible achievements of this CCM model are;
§ It serves as good complaint recording technique.
§ Well organized system of sorting and recording complaint data assures customer concerns effectively.
§ It provides policy and procedural review to top management for complaint revival.
§ It empowers the front line staff in the organization to handle customer complaints in the most appropriate manner.
§ It avoids the misunderstanding of complaints.
§ Payback is greater than the cost of customer dissatisfaction.
5. Case Study
A case study is done in an automobile service industry engaged in passenger car care process with principle authorization. The company is highly sensitive to customer satisfaction issues and reacts quickly to the complaints they consider to be CTQ. This practice allows them to keep ahead of the competition though there is rapid growth in vehicle population in recent days. The customer complaints also rose up in the vertical axis which put the company into hurdle. Even though the customized approaches are in-force for addressing the customer problems within the company, they struggle to address grievances. The CCM model is proposed for customer complaint management and service recovery. The further sections explain the case study analysis with CCM model in phase wise.
5.1 QFD Phase
This phase comprises two sub processes namely Customer information appraisal and Company information appraisal as depicted in Figure 3.
Customer information appraisal: This process involves the following steps as illustrated in Figure 4.
Cross Functional Team [CFT] Setting: CFT comprising all department personals is constituted to identify the customers and their complaints.
Customer Survey: With prior management approval, the customers are surveyed with questioner formats in such a way that every customer is being asked about what is the present complaint/reason for dissatisfaction, what they expect, how best the competitors are performing than the company and overall performance of the company.
Customer Information Processing: From customer feedbacks, the customer complaints are processed with their importance level. Importance Level [IL] is a scale value in which 1 indicates least importance where as 9 indicates most important complaint. IL is a useful measure to prioritize the qualitative customer complaints based on the reported frequency and their impact on customer satisfaction. Since the customer survey includes performance evaluation of the competitors, it is rated against each of the customer complaints. The rating varies from 1 for poor performance to 5 for better performance. The ratings are obtained directly from the customers during the initial survey.
Table of Customer Complaints: All the complaints are tabulated with their IL value and Competitor ratings as shown in table 1 and followings findings are consolidated.
Competitor rating indicates:
§ With respect to late vehicle delivery, the competitor X and the company are rated equal where as the competitor Y is rated poorer than them.
§ Regarding the cost of service, the competitor Y and the company are rated equally and competitor X is given rating 2 which indicates service cost of competitor A is higher than the rest.
§ In hospitality complaint, the competitor X is rated good where as competitor Y and the company are rated poorer equally than X.
§ For poor off-road service, all the three companies are rated equally with rating 4. For poor accident assistance, the surveying company is rated as good than competitor Y, poor than competitor X.
§ The surveying company is rated as good than others for Annual Maintenance Contract [AMC] problems.
§ Also as for as concerned with service quality, the company is rated as good than competitors with rating 4.
The unique feature in this model is that the Importance Level and competitor rating not only helps to prioritize the qualitative customer complaints, but also used to converge further analysis in such a way that;
§ With respect to the level of importance, the complaints, late vehicle delivery, high cost of service and poor service quality are found more precedence and needs further attention to enhance customer satisfaction.
§ Even the complaints with IL below 5 has certain impact on customer satisfaction, it is given least attention in CCM model than complaints with IL more than 5.
§ With respect to competitor rating, the company is rated equally with both competitors for late vehicle delivery and high service cost problems. In the view of leading the market competition, the company has to strive
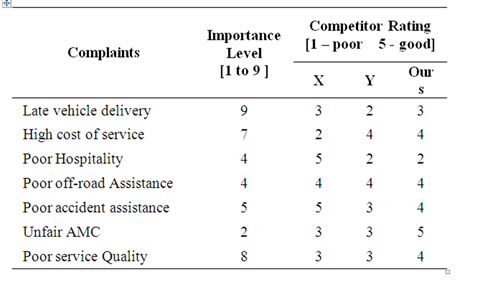
Table 1. Table of customer complaints

Figure 4. Customer information appraisal
immediately before the competitors. But in case of service quality complaint, even though the company does well than competitors, the customer expects still more. Hence any little improvement in service quality may have large impact in customer satisfaction.
Hence the further analysis is focused with complaints as altered in table 2.
Company Information Appraisal: This process is aimed to identify the rectification factors pertaining to short-listed customer complaints listed in table 2. This process involves the following steps as shown in Figure 5.
Cause and Effect Study: This study determines the measurable factors which influences customer satisfaction. The rectification factors are identified by using cause and effect diagram as shown in Table 3.
Rectification factors listing: After identifying the possible rectification factors, it is arranged across the top portion of the HOQ matrix as depicted in Figure 6.
Value Relationship: In order to know the value judgment of impact of the identified factors, the inter relationship between factor and complaint is assessed. The rectification factors are assigned weight age; 5 for strong relationship, 3 for moderate relationship and 1 for weak relationship. Each factor is assessed its relationship nature with every complaints and awarded weight age accordingly.

Table 2. Altered table of customer complaints
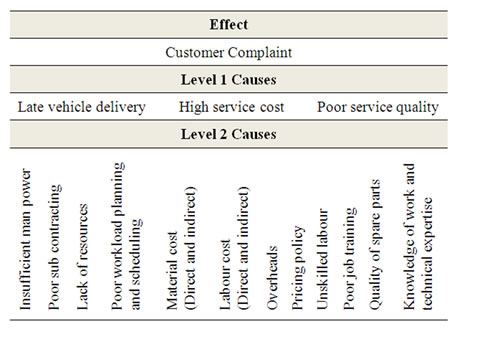
Table 3. Cause and effect study

Figure 5. Company information appraisal

Figure 6. Rectification factors in HOQ matrix
Thus the relationship value is filled in the matrix as shown in Figure 7.
Factor Priority Identification: In order to spot out the most influencing factor for customer satisfaction, priority is established to rectification factors. The priority weight age is calculated using factor relationship value and complaint IL value. For rectification factor “Insufficient man power” the relationship values are (5, 1, 3) and complaint IL values are (9, 7, 8) respectively. The priority weight age is (5 × 9) + (1 × 7) + (3 × 8) = 76. Similarly the priority weight is calculated and recorded at the bottom of the matrix as shown in figure 8. The factor ‘Poor work load planning and scheduling’ is identified as CTQ since it scores highest priority weight 106. The CTQ identified has strong influence in customer vehicle delivery commitment and service quality, has moderate influence in service cost.
As summarized in table 2, the competitor rating clearly indicates that the surveying company and competitor X are doing equally well than competitor B in maintaining delivery schedules, whereas, with respect to service quality, the company is already rated well than competitors. Since the CTQ has strong influence in delivery schedules and service cost, any small extent of improvement in CTQ may have greater influence on customer requirements and in turns makes the company to lead competition well in advance than others.
5.2 Six Sigma
The output of QFD phase is taken as input to Six Sigma measure phase in CCM model.
Measure Phase: After identifying the CTQ factor through QFD process, further analysis is carried through Six Sigma process. Measure phase is the initial phase in which quantifying the factor is sought. This objective is done through the following steps as shown in figure 9.
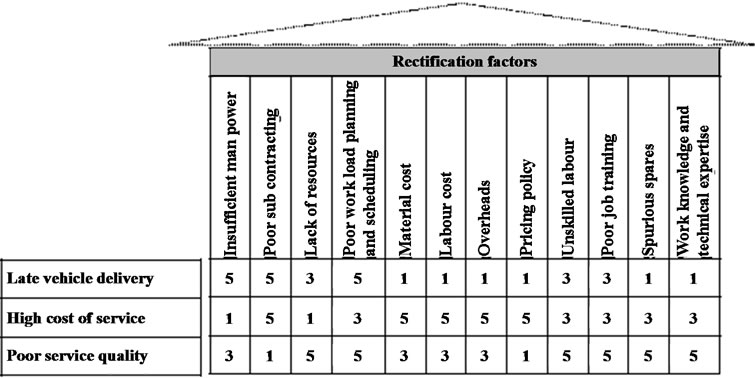
Figure 7. Rectification factors with relationship value
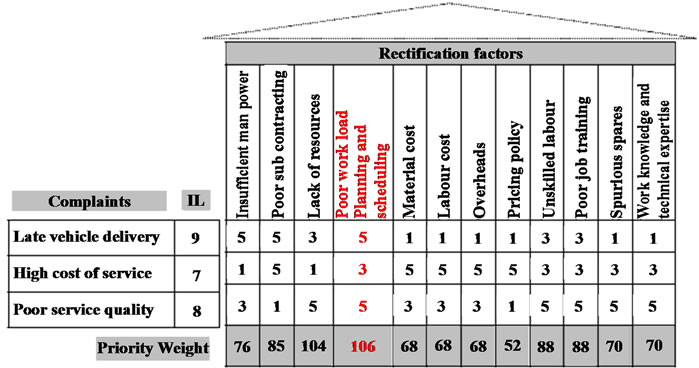
Figure 8. Priority weight for rectification factors
Metric Identification & Data Collection: The present work load planning and scheduling activity is measured in terms of work force and No. of days respectively. The workforce hierarchy in the company comprises section supervisors provided with skilled and semi skilled labours. The available labour force in car servicing centre is 6 section supervisors with 24 skilled and 40 semi skilled labours. Presently the work is scheduled on FCFS (First Come First Serve) basis. The incoming car ranges from 25 to 30 per day. The time taken by a car from the arrival to delivery after service inside the company includes time taken by supervisor to attend first, time taken to prepare job card, time taken to prepare estimate, time taken for repair work and time taken to pay for service. Any delay in time taken for any one or more of above mentioned tasks results in customer complaints. Time taken to service the car is associated in either ways to delay in delivery and service quality, if the repair time is more, then the delivery may not at the committed time where as if the service time is less, then the quality of service may not be assured.
Analyze Phase: with available information regarding work load and labour force availability, this phase works out to determine the solution possibilities. It involves analysis of workload planning, scheduling, and developing improvement strategy as shown in figure 10.
CTQ Data Analysis: The overall workload to the company comprises of free service, paid service, body work and accident repairs. Since the company is an authorized dealer, many of the service requests from the customers belong to free service category (under warranty). Having a check, the incoming vehicle mixture for a period of past 3 months, it seemed that the 50% was occupied by free service vehicles out of an average incoming of 30 cars. As the free service request is comparatively more, it becomes obvious to look into the labour structure of free service department. In the company, the free service department is equipped with one service supervisor and four teams of labour; each team contains a skilled mechanic and two semi skilled helpers. The supervisor accepted the car for service work and allots it to any one the four teams depending upon the workload already assigned to that team.
Improvement Strategy: The reason for poor workload
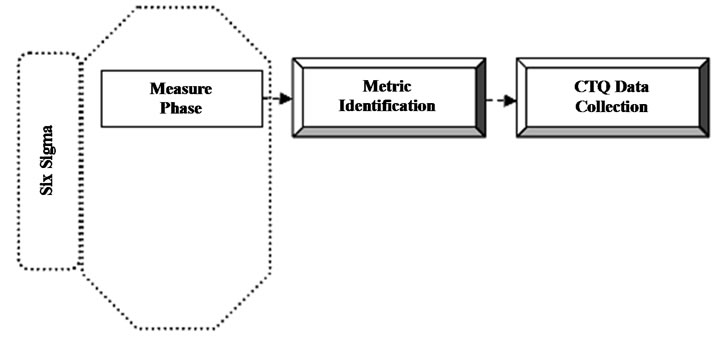
Figure 9. Six sigma measure phase

Figure 10. Six sigma analyses phase
sharing in this practice is that it is purely depends on the judgment of the respective supervisor. Even though the authorizing principle has provided standard labour schedules for service requests, the supervisor may not be in position to work out the total workload of each car when it arrives because of unknown pattern of car incoming and non standard works. This results in both overloading and under loading of teams, finally ends with customer complaints.
Improve Phase: In this phase, the strategy for improving performance is planned as shown in Figure 11 and executed in the following steps.
Improvement Planning: To improve the workload planning of free service department, an algorithm is developed for calculating the incoming workload. This algorithm felicitates the determination of incoming work load and department level workload of the company. The workload calculation aids the supervisors to commit the positive due date. It is also equally important to develop a solution for the problem of worker loading in the fleet. To handle work assigning task in a systematic way, an algorithm is developed to assist the work assigning task of section supervisors.
Solution Methodology: It is proposed to calculate the work load of the incoming car on receipt. Work load is expressed in terms of hours required to perform. For regular and routine service related enquiries, the company is already supplied the time standards by their principles. For non standard works, the approximate time required to complete is estimated with the help of experience of service personals.
Work Load Planning Algorithm:
Let N = Number of incoming cars per day.
n = Number of jobs reported in a car.
Tj = Time to complete job ‘j’ in terms of Hours Wi = Workload of car ‘i’ in terms of hours.
Wd = Total workload per day per department in terms hours.
On receipt of a car into to service centre, the information related to jobs are collected through work order form by the section in-charge. Then the workload is calculated with available standard time schedules as follows;
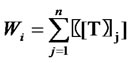 (1)
(1)
where Wi = workload of car ‘i’
j = repair job
n = Total jobs reported
Tj = time to do job ‘j’
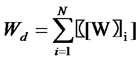 (2)
(2)
where Wd = workload of the department
Wi = workload of car ‘i’
N = Total incoming cars per day The company begins its day to day work at 08.30 am with lunch break for 1 hr and tea break for 15 mins in either sessions and closes works at evening 6.00 pm. The available labour time per day is 8 hrs per team. Hence the total work time available for free service department is 8hrs × 4 teams = 32 hrs. With the available work time, the free service department can service cars with maximum workload of 32 hrs per day with four teams. But in practice, time spent for non-work activities like tool search, power failure, work hazards, time to procure spares from store etc not allows to complete maximum workload of a day. Hence, whiling calculating the workload of car, some standard allowance is added at the rate of 10% of the workload of the car to accommodate above said non-work events. Also for the vehicle arriving just before the tea break or lunch break, the break time is added with service time to obtain actual workload of the car.
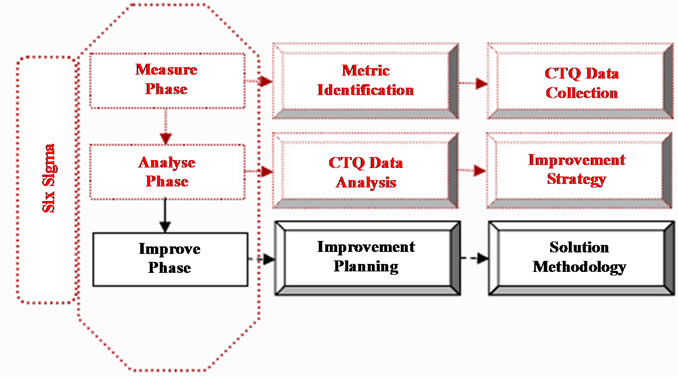
Figure 11. Six sigma improve phase
Hence Equation (1) becomes
 (3)
(3)
where Ta = Allowance time Tb = Break time Calculating the actual workload of incoming car by using above Equation (3) enables the section supervisor to calculate total workload of the department on that day, so that he can commit the delivery schedule to the customer easily and preciously. If any previous day’s work kept pending and to be carried out on next day, the same may be suitably added with the total workload of the department before committing the delivery time to the fresh customers.
Work Load Scheduling:
Calculating the workload and committing the delivery time accordingly is very tough to increase the effectiveness of the workload scheduling of the department or company, but effective and efficient work assigning to team is important to achieve the delivery commitments with work quality. To develop an effective assigning method, it is assumed that each team can handle one car at a time. With this assumption, the following algorithm is developed.
Let M = number of teams Wx = workload assigned to team ‘x’
With assumption that all the teams are free, the following sample work assigning illustrates how to schedule workloads among team in a systematic way as depicted in Figure 12.
§ Assign workload W1 = 2 hours to team 1. Now team 1 is loaded until 10.30 am.
§ Assign workload W2 = 1.5 hours to team 2. Now team 2 is loaded until 10.00 am.
§ Assign workload W3 = 3 hours to team 3. Now team 3 is loaded until 11.30 am.
§ Assign workload W4 = 6 hours to team 4. Now team 4 is loaded until 02.00 pm.
Now all the teams are given work and team 2 is in the position to complete earlier than team1. Next workload should be assigned to team 2. Hence
§ Assign workload W5 = 4 hours to team 2. No team 2 is loaded until 02.00 pm.
Now team 1 is in the position to complete earlier than team 3. Any next workload should be assigned to team 1. In this way, the available teams are equally shared with incoming workloads. This approach felicitates the workload sharing process as well as helps to identify the teams which can take up with fresh work after the execution of the existing service works. Further it helps to obtain the delivery schedules by using the time scale. Strictly adhering to workload norms and effective work assigning practice leads to improvement in overall efforts.
Control Phase: To sustain the improvement activities for ever, good monitoring system is important to control the workload determination process and workload assigning activity of each department in the company. In this phase, the control measures are identified and a control plan is devised to achieve the objective as shown in figure 13.
Control Measure Finding: the customer complaints are highly dynamic in nature and require continuous knowledge update to solve then and there. To sustain the advantage of this model, the following control measures are identified and put in force for result;
§ Periodic brainstorming sessions to share difficulties faced in this new approach.
§ Continuous watch on customer complaint.
§ Top management involvement.
§ Regular motivational and technical training for supervisors to promote their skill and work involvement.
Control Planning: The approved thump rule of 50% improvement in the first effort of new Six Sigma drive is applied here to set the target which should result from the improve phase.
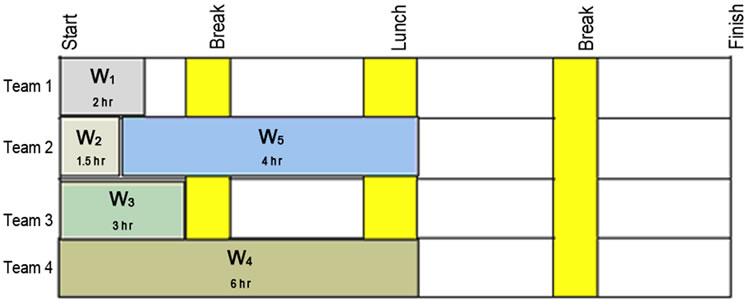
Figure 12. Work load scheduling
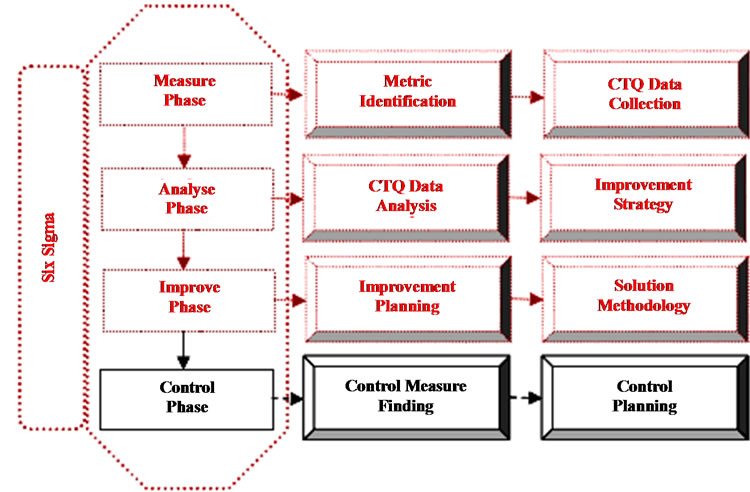
Figure 13. Six sigma control phase
6. Concluding Remarks
This study has developed a customer care management [CCM] model by using the conceptual features of QFD and Six Sigma. This model is proposed in an automotive service company to manage customer complaints. At the end of QFD phase, the ‘work load planning and scheduling’ was identified as CTQ. Through the four sub phases of Six Sigma, the CTQ is analyzed. In this improvement drive, work load calculation algorithm and work load assigning practice were developed to solve predominant customer complaints. In this new approach, the inter relationships between solution factors are not considered. Naturally in some cases improvement of one factor may have impact on another factor either to improve or to worse. Also, in the QFD analysis, the rectification factors are not evaluated against competitors as done for customer complaints. But it is one of the important analyses for companies to keep competitive edge. Since it is practically not possible to do competitive analysis for rectification factors, instead of that is may be advisable to look for innovative solution possibilities. This may be accomplished by adding the features of an innovative technique like TRIZ in CCM model. Further research exertion may please be extended to study the possibilities for accommodating the nature of relationship between the solution factors and innovative features in the CCM model.
REFERENCES
- Chakrabarty and K. C. Tan, “The Current State of Six Sigma Application in Services,” Managing Service Quality, Vol. 17, No. 2, 2007, pp. 194-208.
- R. Sousa and C. Voss, “Quality Management Revisited: A Reflective Review and Agenda for Future Research,” Journal of Operations Management, Vol. 20, No. 1, 2002, pp. 91-109.
- Gronroos, “Service Management and Marketing,” Lexington Books, Lexington, Massachusetts, 1990.
- R. L. Hensley and K. Dobie, “Assessing Readiness for Six Sigma in a Service Setting,” Managing Service Quality, Vol. 15, No. 1, 2005, pp. 82-101.
- A. Desai, “Improving Customer Delivery Commitments the Six Sigma Way: Case Study of an Indian Small Scale Industry,” International Journal of Six Sigma and Competitive Advantage, Vol. 2, No. 1, 2006, pp. 23-47.
- V. Zeithamal, A. Parasuraman and L. Berry, “Delivering Service Quality,” The Free Press, New York, 1990.
- Collier, “The Service/Quality Solution Suing Service Management to Gain Competitive Advantage,” Irwin, Milwaukee, 1994.
- K. Yoo and J. A. Park, “Perceived Service Quality, Analyzing Relationships Among Employees, Customers and Financial Performance,” International Journal of Quality & Reliability Management, Vol. 24, No. 9, pp. 908-926, 2007.
- M. Kumar, J. Antony, C. N. Madu, D. C. Montgomery and S. H. Park, “Common Myths of Six Sigma Demystified,” International Journal of Quality & Reliability Management, Vol. 25, No. 8, 2008, pp. 878-895.
- C. Fornell and B. Wernerfelt, “Defensive Marketing Strategy by Customer Complain Management,” Journal of Marketing research, Vol. 24, No. 4, 1987, pp. 337-346.
- J. Antony, “Six Sigma for Service Processes,” Business Process Management Journal, Vol. 12, No. 2, 2006, pp. 234-248.
- R. B. Coronado and J. Antony, “Critical Success Factors for the Successful Implementation of Six Sigma Projects in Organizations,” The TQM Magazine, Vol. 14, No. 2, 2002, pp. 92-99.
- R. G. Day, “Quality Function Deployment,” Tata McGraw-Hill Publishing Company Limited, New Delhi, 1995.
- Y. Hong and T. N. Goh, “Six Sigma in Software Quality,” The TQM Magazine, Vol. 15, No. 6, 2003, pp. 364-373.
- J. Goding and M. Hammer, “Putting Six Sigma in Perspective,” Quality, Vol. 40, No. 10, 2001, pp. 58-62.
- S. H. Park, “Six Sigma for Quality and Productivity Promotion,” Asian Productivity Organization, Tokyo, 2003.
- J. Antony, K. Downey-Ennis, F. Antony and C. Seow, “Can Six Sigma Be the “Cure” for our “Ailing” NHS?” Leadership in Health Services, Vol. 20, No. 4, 2007, pp. 242-253.
- M. Finster, “From Continuous Improvement to Continuous Innovation,” Quality Management Journal, Vol. 8, No. 4, 2001, pp. 7-33.