Journal of Geographic Information System
Vol.08 No.01(2016), Article ID:63587,8 pages
10.4236/jgis.2016.81007
Using River Altitude Determined from a SRTM DEM to Estimate Groundwater Levels of the Tokwe and Mutirikwi Watersheds in Zimbabwe
David Chikodzi*, Godfrey Mutowo
Department of Physics, Geography and Environmental Science, Great Zimbabwe University, Masvingo,
Zimbabwe

Copyright © 2016 by authors and Scientific Research Publishing Inc.
This work is licensed under the Creative Commons Attribution International License (CC BY).
http://creativecommons.org/licenses/by/4.0/


Received 22 January 2016; accepted 19 February 2016; published 22 February 2016
ABSTRACT
Groundwater resources provide most of the domestic water supply in rural Zimbabwe and support poverty reduction through irrigation facilities. Most agricultural and environmental plans need water table depth analysis as an input in designing best management strategies. There are limited direct measurements of groundwater levels in Zimbabwe due to high costs and the limited human expertise. The study is aimed at coming up with a proof of concept that altitude of rivers as determined by an SRTM digital elevation model can be used to estimate the levels of groundwater in parts of Mutirikwi and Runde sub catchments of southern Zimbabwe. The study also maps the groundwater levels of the area as determined by river altitude from the digital elevation model. Firstly, the groundwater levels for nine boreholes are measured. Secondly, the altitude of a river bed nearest to each borehole site is extracted from a digital elevation model. Finally, the Spearman’s correlation coefficient is used to determine the nature and strength of the relationship between the two variables. Linear regression analysis was also used to obtain the predictive equation of the relationship and its coefficient of determination. After the relationship between groundwater and river altitude is established, 9 new random points of river altitude are generated across the study area interpolated using kriging interpolation to give the estimated altitude of river altitude. The altitude of groundwater is then determined by running the predictive equation Y = 0.8736 * X + 0.852 obtained from regression analysis. The depth to groundwater level of area is obtained by subtracting the determined groundwater altitude from the SRTM DEM. The results show strong positive and statistically significant (ρ = 0.000, α = 0.01) correlation coefficient of 0.971 between measured groundwater levels and altitude of rivers. The regression model shows a coefficient of determination (r2) of 0.975. The research therefore determines that altitude of rivers and use of geostatistics can produce physically plausible estimates of groundwater levels in the study area.
Keywords:
SRTM DEM, Groundwater Level, Kriging Interpolation, River Altitude

1. Introduction
Groundwater is a major source of drinking water across the world and plays a vital role in maintaining the ecological value of many areas [1] . It provides most of the domestic water supply in rural Zimbabwe and supports poverty reduction through irrigation [2] . It can provide a potential buffer to support adaptation strategies to environmental changes with its greatest advantage being reliability because constant supplies can be maintained during periods of little or no rainfall and help to even out meteorological variability [3] . By virtue of it being a natural store of water, groundwater storage is in many ways better than what can be achieved through constructing surface water bodies [4] . Groundwater assessment is normally via extraction wells and boreholes.
Most agricultural and environmental plans need water table depth analysis as an input in designing best management strategies [5] . Borehole samples normally consist of between 15 to 20 individual samples for an area of 12 to 20 hectares. In certain applications like precision agriculture, recommendations call for one water table depth sample per hectare [6] . Hence, a common problem associated with management of groundwater, especially in resource constrained countries is the limited and low density of groundwater instrumentation networks [7] . These are noted to be both cost and management intensive [8] but fail to bring out in sufficient detail, information of the local setting. This thereby hampers context specific groundwater resources management [9] and limits effective evaluation and management of the resource. Other methods of obtaining water table depth include flights, analyses using resistivimeters or perforations of an area under study [5] . These diagnostic methods are indeed reliable based on the extensive research involved and the huge number of tests that have been conducted since their establishment [10] but are expensive and involve huge amounts of time in the analysis stage. In this regard, there is need to develop cheaper methods applied to groundwater monitoring that are reasonably accurate, save analysis time and yet cover smaller areas.
Remote sensed altimetry can provide an alternative and improved method to determine water table depth at a relatively low cost [5] . In the last few years, different remote sensing projects are making this possible by developing less time consuming analysis procedures [11] [12] . Ground-based Remote Sensing (geophysics) is usually more expensive than space and airborne remote sensing but is still more accurate and cheaper than invasive methods such as borehole drilling [7] . However, although remote sensing is an economic data provider with a global view, it is unfortunately less accurate than in situ measurements hence require calibration.
There are limited direct measurements of groundwater levels in Zimbabwe despite its potential and importance [13] . This is mainly due to the high cost of drilling boreholes for direct observation and the limited expertise required running groundwater monitoring stations. There has also not been any research done to date which tries to test if levels of groundwater can be determined using a remote sensing derived digital elevation model. The study therefore aims at coming up with a proof of concept that altitude of rivers as determined by a 30 m * 30 m SRTM digital elevation model can be used to determine the levels of groundwater in parts of Mutirikwi and Runde catchments of southern Zimbabwe. This method is not only cheaper but saves time and has coverage of the whole country. This study is based on the premise that altitude of rivers provides points from where groundwater levels can easily be determined. Thus we hypothesize that we can establish a function which links the groundwater levels to altitude that can then be generalised to provide a continuous surface of groundwater in the study area. Therefore, the research also aims at mapping the groundwater levels as determined by the digital elevation model of the study area.
2. Methods and Materials
2.1. Study Area
The study area is a 12.5 km * 7.5 km space located on the boundary or watershed area of Tokwe and Mutirikwi sub-catchments all of which are in Runde catchment. The area is located between geographic coordinates 300 52'31.6"E, 200 23'12"S and 300 59'59.56"E, 200 19'20.3"E which is about 40 km south of Masvingo City and covers an area of 93 km2. Figure 1 shows the location of the study area.
The area is dominated by semi-subsistence farming with a communal land tenure system. The place is in natural agro-ecological region 4 which is semi-arid climate with three distinctive seasons. The seasons are: November to April (hot and wet), cool and dry (May to Mid-August) and hot and dry between (mid-August to October). Annual rainfall ranges between 400 - 800 mm and daily potential evapotranspiration (PET) levels are high, ranging from 2 - 8 mm [14] . This gives a cumulative PET for the growing season of 600 - 900 mm, which explains the limited water surplus recharging aquifers and rivers. The mean maximum daily temperature ranges between 21˚C June and 29˚C in October. Furthermore the mean daily minimum temperature ranges between 5˚C July and 17˚C in January [15] .
The area is dominated by degraded savanna and has coarse textured sandy loam soils. Brachystegia spiciformis and Julbernardia globiflora are the common woodland species while as Dichrostachys cineria and Lantara camara dominates the bush land. Hyparrhenia filipendula and hyparrthelia dissolute are the common grass species [15] .
2.2. Methods
Relating groundwater levels to altitude
Before estimating groundwater levels using a digital elevation model, a proof of concept (POC) of the hypothesis was done. A proof of concept is a demonstration to verify that certain concepts or theories have the potential for real-world application. It is a small exercise to test a discrete design idea or assumption. To test if a digital elevation model and resulting altitude of rivers can be used to estimate groundwater levels the 30 m * 30 m Shuttle Radar Topography Mission (SRTM) DEM and observed borehole levels were used.
The (SRTM) digital elevation model (DEM) of the study area was used to obtain the altitude of rivers by overlaying vector layers of rivers on the DEM in ILWIS GIS software. The study area has nine accessible boreholes and deep wells all of which had their depth to groundwater measured. The fact that groundwater levels fluctuate means that the timing of the measurements of borehole levels is crucial. The month of July was chosen because groundwater recharge by rainfall will not be occurring. The altitude of a river bed nearest to each borehole site was extracted from the DEM. The pair of measurements i.e. river altitude and groundwater level were then correlated using the Spearman’s (rho) correlation coefficient in order to determine the nature and strength of the relationship between the two variables. Spearman correlation coefficient (rho) was used because it is more robust when used to analyse non parametric data and also because the data is monotonic. It assesses how well variables or rank orders are related. This was done is SPSS and the correlations were tested for statistical significance (α = 0.05) in order to assess whether observations reflected a true pattern or just occurred by random

Figure 1. Study area.
hydrological behaviour. Linear regression analysis was then done to obtain the predictive equation of groundwater from river altitude and its coefficient of determination.
Validation of the model
In order to come up with altitude of rivers which would then be used to estimate groundwater levels, 9 new random points were generated along river beds across the study area using the DNR random tools in ArcView GIS and altitude extracted from the SRTM DEM. Since it is impossible to obtain exhaustive values of data at every desired point because of practical constraints, interpolation is important and fundamental to mapping, analysing and understanding of spatial data. Ordinary kriging interpolation was done on these points. The ordinary kriging function is a point interpolation procedure in which estimations are weighted averaged input point values, calculated in such a way that they minimize the estimation error in each output pixel. The estimated or predicted values are thus a linear combination of the input values and have a minimum estimation error. The ordinary kriging function uses the inverse distance algorithm in order to ensure that points close to an output pixel obtain larger weights than points which are further away from it. The result is raster map showing estimated altitude of river level and output error map with the standard errors of the estimates. The output altitude of rivers map was then converted to a groundwater map through the equation Y = 0.8736 * X + 08.52 which is the relationship function obtained from regression analysis. The depth to groundwater level of each pixel was obtained by subtracting the determined groundwater altitude from the SRTM DEM.
The results were validated by comparing differences in altitude at each point between actual SRTM DEM river altitude and the determined groundwater altitude by using a new set of randomly selected points distributed along rivers throughout the study area.
3. Results
Figure 2 shows the comparison of the altitude of rivers and groundwater levels at selected sampling sites. In most cases depending on the river, groundwater levels are observed to be higher than the altitude of the river in some case by as much as 20 metres e.g. at Cheshanga River sample site 1. However, in some instances such as at Mupudzi river sample site 1, the altitude of the river and the groundwater level are equal.
As a proof of concept to determine if river altitude can be used to predict groundwater levels in the study area, the Spearman’s (rho) correlation coefficient analysis run for all the nine sampled sites. At each sample site, the altitude of groundwater was correlated with the altitude of the nearest river bed. The results show a very strong positive correlation coefficient of 0.971 between the measured groundwater levels and altitude of rivers. These correlations were also determined to be statistically significant (ρ = 0.000, α = 0.01).
To test the predictive power of the determined model, regression analysis was done. Figure 3 shows the distribution and relationship between river altitude and measured groundwater levels at the 9 sampling sites. The regression model shows a coefficient of determination (r2) of 0.975 which means that in over 97% of the cases, changes in river altitude can be used to explain changes in groundwater levels. Therefore, in the study area, the altitude of rivers can be used to estimate groundwater levels.

Figure 2. Comparison of river altitude and groundwater level at nine sampled sites.
Figure 4 shows the estimated levels of groundwater determined using altitude of rivers randomly obtained from an SRTM 30 * 30 digital elevation model (DEM). The nine randomly selected points used to determine the groundwater levels of the study area are shown in Figure 4. The altitude of groundwater is shown to range from 799 m - 1154 m in the study area. Figure 4 shows that the north-western parts of the study area have the highest altitude of groundwater levels while as the eastern parts have the lowest.
Figure 5 shows the estimated depth to groundwater level of the study area. The depth to groundwater levels range from 3 - 50 m on different places in the study area. In most cases areas that are low-lying have the minimum values of groundwater depth.
Comparison and validation
Table 1 shows the observed differences in metres between the actual SRTM DEM river altitude and the determined groundwater level in Figure 4. The observed differences range from as much as −11 m −14 m in

Figure 3. Relationship between river altitude and groundwater level.
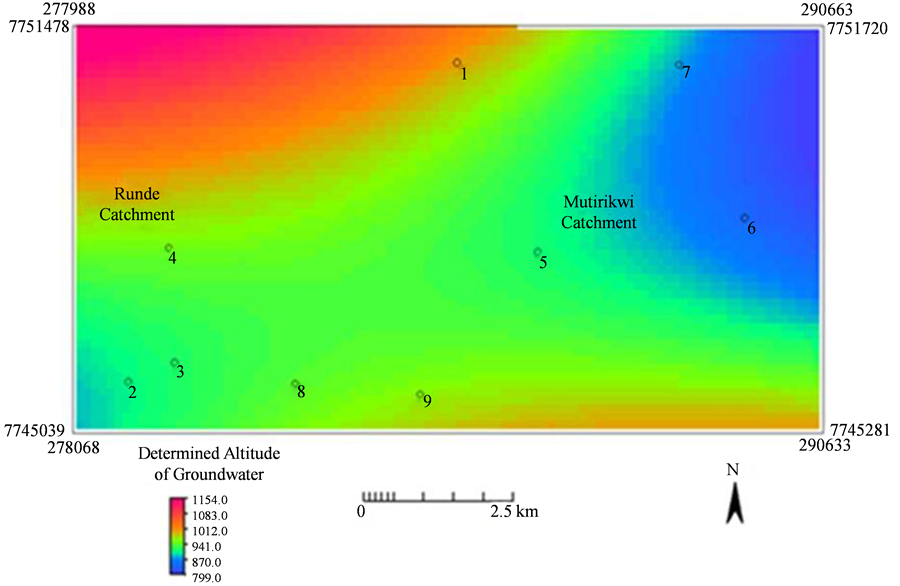
Figure 4. Groundwater altitude obtained from an SRTM DEM derived river altitude.

Figure 5. Estimated depth to groundwater level.

Table 1. Comparison and validation of derived groundwater altitude and river altitude.
different places. Hence errors are inherent in the prediction model and need to be noted and quantified in the analysis process. The standard error of estimates shows that the model is a significant predictor.
A further 9 random check points different from the ones used to calibrate the model were generated along rivers throughout the study area. The altitude of the river at each random point was then compared with the adjacent water table altitude derived in Figure 4 to see how they compare, Figure 6 shows the comparison.
Figure 6 confirms that there is a close match in the pattern of river altitude and determined groundwater levels with some points showing groundwater above the river altitude and some places showing it below the river level. All this shows that there is still a close relationship between river altitude and groundwater level.
4. Discussion and Conclusions
The method of determining groundwater levels from DEM has proved to be a very cheap and easy method of inventorying and mapping groundwater levels for management purposes. Most of the research done on ground water mapping in Zimbabwe has noted that there is an almost total lack of long-term groundwater level

Figure 6. Comparison of estimated water table altitude at 9 random check points distributed along rivers throughout the study area.
monitoring [4] or monitoring has been haphazard, inconsistent and done in areas where it has got much economic value [16] but data not enough to facilitate accurate mapping. The method used in the study can therefore be used reasonably and quickly estimate the levels of groundwater of an area to facilitate water resources management.
Groundwater mapping is one of the main tools for systematic and controlled development and planning of groundwater resources. These maps can be used by engineers, planners and decision makers in order to allocate, develop and manage groundwater within the context of a national water policy [7] .
A novel approach called topographic hydrology has been developed to estimate groundwater levels and flows using topographic information like DEMs [5] [17] . Using this approach along with remote sensing and geostatistical methods like kriging interpolation to estimate groundwater levels has mainly been done using limited well data recordings overtime and has been proved to be an effective and feasible approach [7] [16] [18] . Similarly in this study, it has been effective in estimating and mapping the levels of groundwater of the study areas. However, errors are inevitably introduced through the interpolation process so data needs to be validated each time; these methods are used and also how to increase the accuracy of the derived data has become an urgent issue for estimating groundwater levels [7] [17] .
In conclusion, a proof of concept was developed to determine if altitude of rivers as derived from an SRTM DEM could be used to estimate the levels of groundwater in the study area. It was determined that groundwater was strongly and positively correlated to the altitude on nearby rivers. The research went on to investigate spatial variability of groundwater depth as determined by a sample of altitude of rivers. Ordinary kriging was used in the interpolation process and to generate the groundwater map of the study area. The research therefore determined that the altitude of rivers and the use of geostatistics could produce physically plausible estimates of groundwater levels in the study area that could be used for water resources planning. However, further research to include borehole/well levels would significantly improve the function as it had the potential to take care of between rivers groundwater altitude variations.
Cite this paper
DavidChikodzi,GodfreyMutowo, (2016) Using River Altitude Determined from a SRTM DEM to Estimate Groundwater Levels of the Tokwe and Mutirikwi Watersheds in Zimbabwe. Journal of Geographic Information System,08,65-72. doi: 10.4236/jgis.2016.81007
References
- 1. Intergovernmental Panel on Climate Change (2007) Climate Change 2007: The Physical Science Basis, Contribution of Working Group I to the Fourth Assessment. In: Solomon, S., Qin, D., Manning, M., Chen, Z., Marquis, M., Averyt, K.B., Tignor, M. and Miller, H.L., Eds., Report of the IPCC, Cambridge Univ. Press, Cambridge, 87-117.
- 2. ZINWA (2015) Alleviating Water Shortage Using Groundwater.
http://www.zinwa.co.zw/alleviating-water-shortage-using-groundwater - 3. British Geological Survey (BGS) (2011) Groundwater Resilience to Climate Change in Africa, British Geological Survey 2011, Keyworth, Nottingham. http://www.bgs.ac.uk/gwresilience
- 4. Chikodzi, D. and Mutowo, G. (2014) Spatial Modelling of Groundwater Potential in Zimbabwe Using Geographical Information Systems Techniques. International Journal of Water, 8, 422-434.
http://dx.doi.org/10.1504/IJW.2014.065796 - 5. Caselles, E., Pitarch, C. and Caselles, V. (2014) Estimation of the Water Table Depth of the Calarasi District Island (Romania) at the Danube River Using ASTER/DEM Data. European Journal of Remote Sensing, 47, 169-180.
- 6. United Nations World Water Assessment Programme (2006) The United Nations World Water Development Report 3: Water in a Changing World. UNESCO, France and Earth Scan, Paris, London.
- 7. Elbeih, S.F. (2015) An Overview of Integrated Remote Sensing and GIS for Groundwater Mapping in Egypt. Ain Shams Engineering Journal, 6, 1-15. http://dx.doi.org/10.1016/j.asej.2014.08.008
- 8. Seguin, J. (2008) Carte Hydrogeologique de l’Afrique à l’échelle du1/10M, Bureau de Recherches Geologiques et Minieres (BGRM), Orleans.
- 9. Lightfoot, D.R., Mavlyanov, N., Begimkulov, D. and Comer, J. (2009) Reliability of Interview Data for Monitoring and Mapping Groundwater. International Association of Hydrological Sciences Red Book 334, Nanni and Dematte, 40-43.
- 10. Barcelona, M.J., Gibb, J.P., Helfrich, J.A. and Garske, E.E. (1985) Practical Guide for Ground-Water Sampling. Illinois State Water Survey, ISWS Contract Report 374.
- 11. Rodell, M., Chen, J., Kato, H., Famiglietti, J.S., Nigro, J., et al. (2007) Estimating Groundwater Storage Changes in the Mississippi River Basin (USA) Using GRACE. Hydrogeology Journal, 15, 159-166. http://dx.doi.org/10.1007/s10040-006-0103-7
- 12. Strassberg, G., Scanlon, B.R. and Rodell, M. (2007) Comparison of Seasonal Terrestrial Water Storage Variations from GRACE with Groundwater-Level Measurements from the High Plains Aquifer (USA). Geophysical Research Letters, 34, 1-5. http://dx.doi.org/10.1029/2007gl030139
- 13. Van Wyk, E., van Tonder, G.J. and Vermeulen, D. (2011) Characteristics of Local Groundwater Recharge Cycles in South African Semi-Arid Hard Rock Terrains—Rainwater Input. Water SA, 37, 147-154. http://dx.doi.org/10.4314/wsa.v37i2.65860
- 14. FAO/WFP (2010) Crop and Food Security Assessment Mission to Zimbabwe. Special Report, FAO Global Information and Early Warning System on Food and Agriculture.
- 15. Masocha, M. (2010) Savanna Aliens, PhD Thesis, Enchede, International Institute for Geoinformation Science and Earth Observation (ITC).
- 16. Siwadi, J. (2006) Redesign of the Groundwater Level Monitoring Network in the Nyamandhlovu Aquifer, Zimbabwe. Waternet Symposium Malawi 2006.
http://www.waternetonline.ihe.nl/downloads/uploads/symposium/malawi-2006/Siwadi.pdf - 17. Desbarats, A.J., Logan, C.E., Hinton, M.J. and Sharpe, D.R. (2002) On the Kriging of Water Table Elevations Using Collateral Information from a Digital Elevation Model. Journal of Hydrology, 255, 25-38. http://dx.doi.org/10.1016/S0022-1694(01)00504-2
- 18. Holland, K., Overton, I., Jolly, I. and Walker, G. (2004) An Analytical Model to Predict Regional Groundwater Discharge Patterns on the Floodplains of a Semi-Arid Lowland River. CSIRO Land and Water Technical Report No., CSIRO Land and Water, Atherton.
NOTES

*Corresponding author.