Natural Science
Vol.5 No.10(2013), Article ID:37738,9 pages DOI:10.4236/ns.2013.510136
Terrestrial ground temperature variations in relation to solar magnetic variability, including the present Schwabe cycle
![]()
1Royal Netherlands Institute for Sea Research, Formerly Astronomical Institute and SRON Laboratory for Space Research, Sorbonnelaan 2, Utrecht, The Netherlands; info@cdejager.com
2SRON Laboratory for Space Research, Sorbonnelaan 2, Utrecht, The Netherlands; h.nieuwenhuijzen@sron.nl
Copyright © 2013 C. de Jager, H. Nieuwenhuijzen. This is an open access article distributed under the Creative Commons Attribution License, which permits unrestricted use, distribution, and reproduction in any medium, provided the original work is properly cited.
Received 20 August 2013; revised 20 September 2013; accepted 27 September 2013
Keywords: Solar Activity; Climate; Dynamo; Toroïdal Field; Poloïdal Field
ABSTRACT
We study the influence of solar activity on climate by investigating the relation between the long-term components of the total magnetic fluxes of both the equatorial and polar fields of the sun and the average terrestrial ground temperature. This is done for the period 1610 (beginning of systematic sunspot observations) till present with an extrapolation to 2015. It is found that from 1610 till about the first half of the 20th century the variation of the long-term average terrestrial ground temperatures is chiefly due to the variation of solar activity, with seemingly random, non-solar residuals. Around 2007, after the Grand Maximum of the 20th century, solar activity, after having gone through a remarkable transition period (~2005 to ~2010), entered into another Grand Episode. That Episode started with the present solar cycle, in shape comparable to the equally weak Schwabe cycle #14. The transition period, in combination with the present low Schwabe cycle causes that the solar contribution to the total terrestrial temperature variation is small during the on-going decade. It results in a slowing down of the rise of temperature after ~2005.
1. SOLAR ACTIVITY AND CLIMATE
1.1. Outline
We study the relationship between solar activity and climate, more specifically the average terrestrial ground temperature, with the intention to better understand how the solar dynamo affects terrestrial climate. Since the notion “climate” implies average values of meteorological parameters over time, we study the relatively long-term (slightly shorter than the length of a Hale cycle) solar influence on terrestrial average ground temperatures, its causes and effects. We hereby restrict ourselves to the study of the solar contribution and do not investigate other (meteorological or climatological) mechanisms that may also affect ground temperatures.
For the purpose of this study we define ΔTearth as the observed average (northern hemisphere) terrestrial ground temperature, as usual with respect to an arbitrary zeropoint, while ΔTsun is defined as its solar component, also with respect to an arbitrary zero point. To give an example: if ΔTsun = ΔTearth + const we would conclude that only the sun affects average ground temperatures.
This paper is a follow-up of two earlier ones, viz. De Jager and Duhau [1] and De Jager, Duhau and Van Geel [2]. These authors studied the dependence of ΔTearth on the long-term variation of solar variability, whereby for that investigation long-term was interpreted as longer than ~18 years. That research was based on seven sets of average Northern Hemispheric ground temperature data files. These files were at that time considered to be the most recent ones.
The approach in these papers differed from the one that was generally followed up to that time, in which correlation was sought between terrestrial ground temperatures and—exclusively—the sunspot number of subsequent Schwabe cycles, which is considered a proxy for the total ensemble of solar activity, thereby neglecting other sources of solar activity. The weak aspect of that approach is that the sunspot number is only related to the magnetic flux contained in the equatorial (toroidal) sunspot belt. That activity shows itself in different ways: sunspots, faculae, flares, coronal mass emissions, just to mention the most important components. Since that ensemble of activities is only well known since the 2nd half of the 20th century, its values were simulated by the sunspot number, which is generally taken as a suitable proxy. A better proxy for the total magnetic energy contained in active regions would have been the integrated magnetic flux of all spots on the disk, but the latter quantity has only been measured during part of the 20th century.
Therefore, a better proxy lacking the variation of Rmax, the maximum international sunspot number for subsequent Schwabe cycles, was taken as a proxy for the longterm total equatorial activity. This was the case, practically in all studies prior to the two quoted above.
But by this approach the polar (poloïdal) magnetic field has not yet been incorporated in the analysis. Yet, the total polar flux is comparable in magnitude with the total equatorial one and offhand it does not seem that it wouldn’t affect terrestrial climate. Relevant phenomena are the polar faculae, the polar bright spots, including their surrounding ephemeral regions, polar faculae, and (partly) the area covered by the coronal holes, to mention the most important features. These features have only been measured systematically since the second half of the 20th century. A suitable proxy for the total polar activity is the minimum geomagnetic aa index aamin (Russel. [3], Russell and Mulligan [4]; Hathaway et al. [5]; Duhau and Chen [6]). This quantity is known from 1870 onward (Mayaud [7]), but later the series have been extended down to 1844 by Nevanlinna and Kataja [8], while Rmax data are known from 1610 onward.
1.2. Details of Calculations
In [2] a linear correlation was sought between the average terrestrial ground temperature ΔTearth and aamin between 1844 and 1970, the latter year being chosen as being before the most pronounced part of the present period of global warming. The correlation with Rmax was studied for the period 1610-1970. In the process of obtaining a continuous set of data for successive years, and for the two input variables Rmax and aamin, the interpolation between the Rmax data for subsequent Schwabe cycle maxima and between aamin for the years of minimum sunspot activity were smoothed such that only components of variability longer than a Hale cycle are contributing. The smoothing procedure is described by De Jager and Usoskin [9]. It consists of weighing the data by a triangular weighting function with a basis length of 18 years. These input data are basic to the quoted investigations and they are also used in the present one (cf. the Appendix to this paper).
The advantage of that procedure was that variations associated with the short term solar variation (the Schwabe cycles) as well as those due to disturbing shorttimescale meteorological effects are for a large part eliminated in the output data. E.g. the effect of the Tambora eruption (April 10, 1815) cannot be traced in the output data. This smoothing facilitates the study of longer lasting sun-associated effects.
With these input data a relation between ΔTearth and Rmax and aamin was derived. After a first attempt based on only two temperature data sets [1], this investigation was improved on the basis of seven different temperature data sets, all for the period 1610 (first telescopic solar observations) till 1970 (hence: before the onset of significant anthropogenic temperature variations).
In order to homogenize the observational data, the values of Rmax and aamin were normalized to those of the Transition Point (for this notion cf. Section 2 of this paper, and Duhau and De Jager, [10,11]. The coordinates of this Transition Point are there defined as 93.38 for Rmax and 10.34 for aamin. Thus, the following relation was derived:
 , (1)
, (1)
where, a = 0.3595 ± 0.0071 and b = – 0.1851 ± 0.0086. The errors are one-sigma values and their relative smallness is an indicator for the reliability of these data. Another satisfying aspect was that the values of a and b resulting from 14 parallel computations (each temperature data set was handled by two statistically independent methods) had quite similar internal and external errors, which proves that there are no systematic effects involved in the analysis.
Alternatively, using straight not-normalized values for Rmax and aamin, the expression (1) becomes:
 . (2)
. (2)
where c = 0.00385 ± 0.000076 and d = – 0.0179 ± 0.0008. Again, the errors are one-sigma values. Equations (1) and (2) are identical, but in actual practise we used Equation (2) in our computations. As should be evident from the foregoing, this expression, which is based on 18 years smoothed values of Rmax and aamin, quantities that are unique for each of the individual Schwabe cycles, cannot be applied to short-time variations of solar activity nor to these of the terrestrial temperature.
In [2] it was shown that the equatorial contribution to ΔTsun can be explained quantitatively on the basis of the above results: The variations of the Total Solar Irradiance (TSI) can be explained by the (variable) radiation from the solar active areas that surround the sunspots. Up to now these latter quantities have been measured during a few decades only, but their values can be extrapolated down to 1610 by their assumed correlation with the sunspot number. The terrestrial influence of the variable TSI, thus obtained, can be calculated and it is found that the calculated variation of the equatorial component of ΔTsun (i.e. represented by the constants a and c in Equations (1) and (2)) matches with the observations to within their observational uncertainties.
For the contribution related to the polar ensemble of activities a quantitative physical explanation has not yet been forwarded, but in view of the negative sign of the constants b and d in Equations (1) and (2) we infer that the most probable candidate for polar sun-induced warming is the solar wind emanating from coronal holes. The latter have maximum size at sunspot activity minimum, while at that time the polar faculae, ephemeral regions and bright spots are small in number. Cf. Callebaut and Makarov [12]. The physical explanation is a topic for later investigations.
1.3. Results
On the basis of Equation (2) we want to derive the expected variation of ΔTsun, the solar component of the terrestrial ground temperature for the period after 1610, when sunspot observations were regularly made. A difficulty is that aamin has been measured only for a fairly short period of time: only little more than one and a half century. We decided to make use of extrapolated aamin values deduced by Nagovitsyn [13], although we realize that these data are extrapolated and that therefore the results based on the years before 1844 should be taken with caution.
Basic to this investigation are the average terrestrial ground temperature and its variation with time. To that end we make use of the Northern Hemisphere data set from Moberg et al. [14]. That set does not go farther than 1979, but we have extended it to more recent years by using data from Brohan et al. [15]. For the years 2005- 2011 we have used data from Kennedy et al. [16], Kerr [17], Hansen et al. [18], and from internet data: www.drroyspencer.com/2012/10/) and www.climate4you.com/. The observations are shown by the middle curve in Figure 1. The curve drawn through these data points was obtained by smoothing with the LOWESS technique ([19,20], pp. 5-6, 167-178) with f = 0.045, corresponding with a time constant of ~ 18 years.
The upper curve of Figure 1 gives ΔTsun, the solar contribution to the terrestrial ground temperature, calculated with Equation (1) by using input data that were smoothed as described before. The lowest curve is based on the small triangular dots. These represent the result of subtracting the solar component ΔTsun, derived on basis of Equation (2) from the (smoothed) observed terrestrial
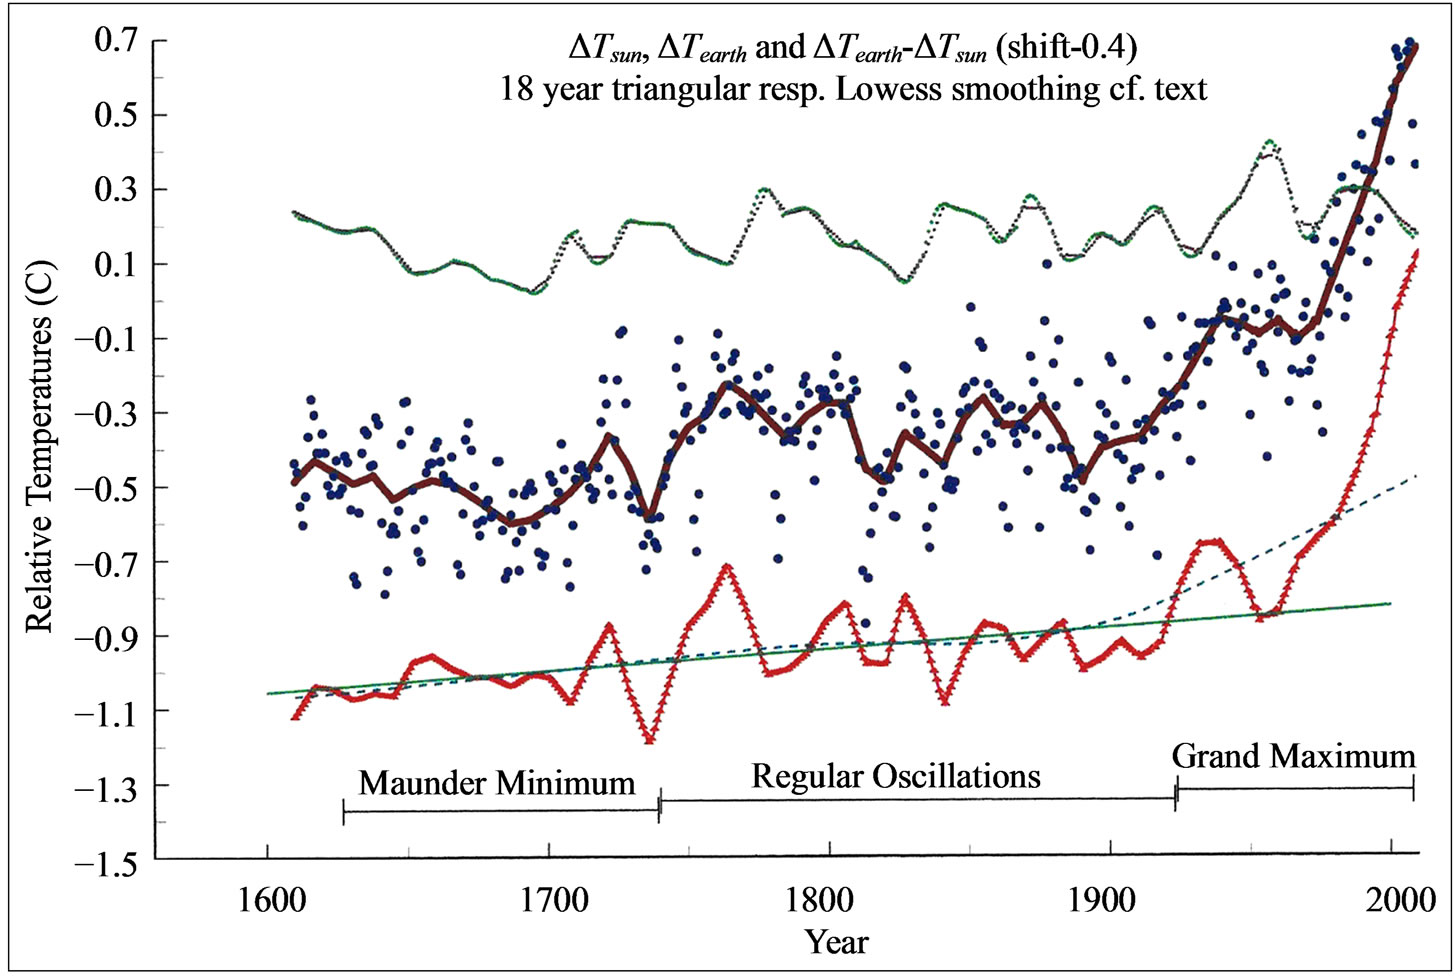
Figure 1. Middle curve: One of the seven sets of set of averaged terrestrial ground temperatures ΔTearth. The temperatures shown here are from [12], and extended with data from [13] and additional data points up to 2011. The curve through these points is the result of 18 years Lowess smoothing (details in the text). The upper curve gives ΔTsun, the calculated solar contribution to the average terrestrial ground temperature, derived as described in the text. The two smooth lines in the lower curve are LOWESS smoothed with characteristic times of about 18 and about 200 years. Details are given in the text. All three lines are with reference to arbitrary zero-points.
ground temperatures ΔTearth. The curve through these data have been obtained by smoothing with the LOWESS technique with f = 0.045, which corresponds with a time constant of approximately 18 years.
For comparison we also show, as the nearly horizontal dashed curve, another LOWESS curve of that difference, this time with f = 0.50, which corresponds with an integration time of 200 years. That curve confirms that during the years ~1600 till ~1900 the longer-scale terrestrial temperature variations are virtually only sun-driven. The deviating gradient of the lower end-part of that line might indicate some dependence on the Maunder Minimum. The upward gradient after ~1900 reflects the wellknown temperature increase of the 20th century. There is a small but conspicuous upward gradient in that curve with a value of 0.022 K/century with an approximate onesigma error of 0.001 K. It would be incorrect to conclude that it represents a non-solar contribution. In any case it is a yet unexplained component that is not due to solar poloïdal or toroidal magnetic activity.
1.4. Summarizing
We thus arrive at the following conclusions: Apart from irregular and seemingly random fluctuations of the residuals and the small gradual increase over the centuries, there is no significant or systematic difference between the long-term solar component and the observed terrestrial temperature variation between the years ~1600 and ~1900. More specific: it appears that the mean of the difference (but for the end-effects) is practically zero over these years. After ~1850 there is an initially hardly noticeable swing-up of the temperature, which becomes more significant around 1900 and quite large around 2000. The non-zero value of the tangent to the second LOWESS suggests an approximate temperature increase of 0.087 ± 0.004 K in ~400 years, or 0.022 K per century.
Summarizing: the variation of the earth’s temperature between 1600 and the first half of the 20th century is mainly due to the sun. One might even suspect a slight dependence on the three Grand Phases of solar activity: the Maunder Minimum (1628-1740), the phase of regular oscillations (1740-1923/24), and the Grand Maximum of the 20th century (1924-2007). The increase that started around the beginning of the 20th century is apparently non-solar and has another, most probably anthropogenic origin. The residuals may have various meteorological or climatological causes, but their study would hardly be possible with the present data because the input data have been smoothed. That reduces the effect of shortterm effects such as e.g. erupting volcanos or El Nino and solar variations at time scales as short as the Schwabe cycle. Anyway, their study has no relevance for the aims of the present paper, which is investigating the longer-term effects of the sun on the average terrestrial ground temperature.
2. THE RECENT SOLAR PHASE TRANSITION AND ITS CONSEQUENCES
During the first decade of the present century we have witnessed the exceptional and very intriguing phase transition (cf. Clete and Lefevre, [21]; reviews by Lockwood, [22]; De Jager and Duhau, [23,24]; De Jager, [25]). Such transitions occur between Grand Episodes of solar variability. A very well-known Grand Episode is the Maunder Minimum than lasted from about 1610 till about 1740, and another episode, one of the highest of the past ten thousand years (Usoskin et al., [26]; Solanki et al., [27]) is the recent Grand Maximum, this being the period of very intense solar activity that was witnessed during the main part of the 20th century.
Duhau [28] introduced a phase diagram, based on a plot of Rmax against aamin. Empirically, she found that there exist a special point in that diagram, with co-ordinates Rmax = 93.4 and aamin = 10.3, that she baptized the Transition Point. As explained in De Jager et al. ([2], p.928, with references), this notion is based on an observational analysis of the non-linear character of the solar dynamo and of its chaotic elements that characterize solar activity.
Actually, the two coordinates of this point were initially found as the average values of Rmax resp. aamin over the past centuries. After having derived these two values [28], it was a confirming addition to dynamo theory to find that new solar activity episodes tend to start when the (Rmax, aamin) curve in the phase diagram crosses through this Transition Point or passes near to it. This empirical finding of the special character of the Transition Point may have important implications for our understanding of some of the mechanisms active in the solar tachocline.
Such phase transitions took place around 1628 (onset of the Maunder Minimum), in 1740 (end of Maunder Minimum, and transition to a period of Regular Oscillations), in 1923/24 (onset of 20th century Grand Maximum), and the most recent one started around 2007. Other possible transitions may have occurred in 1230, 1349 and 1405 (Duhau and De Jager, [10]), but these are less certain, being based on more indirect proxy data on the magnetic fluxes.
Figures 2 and 3 illustrate the phase transitions that occurred in the past few centuries. They were obtained by drawing enlarged parts of the phase diagram concentrated around the Transition Point, mentioned above. Figure 2 gives the phase diagram for the period 1610-1800. It shows close passages to the transition point to occur
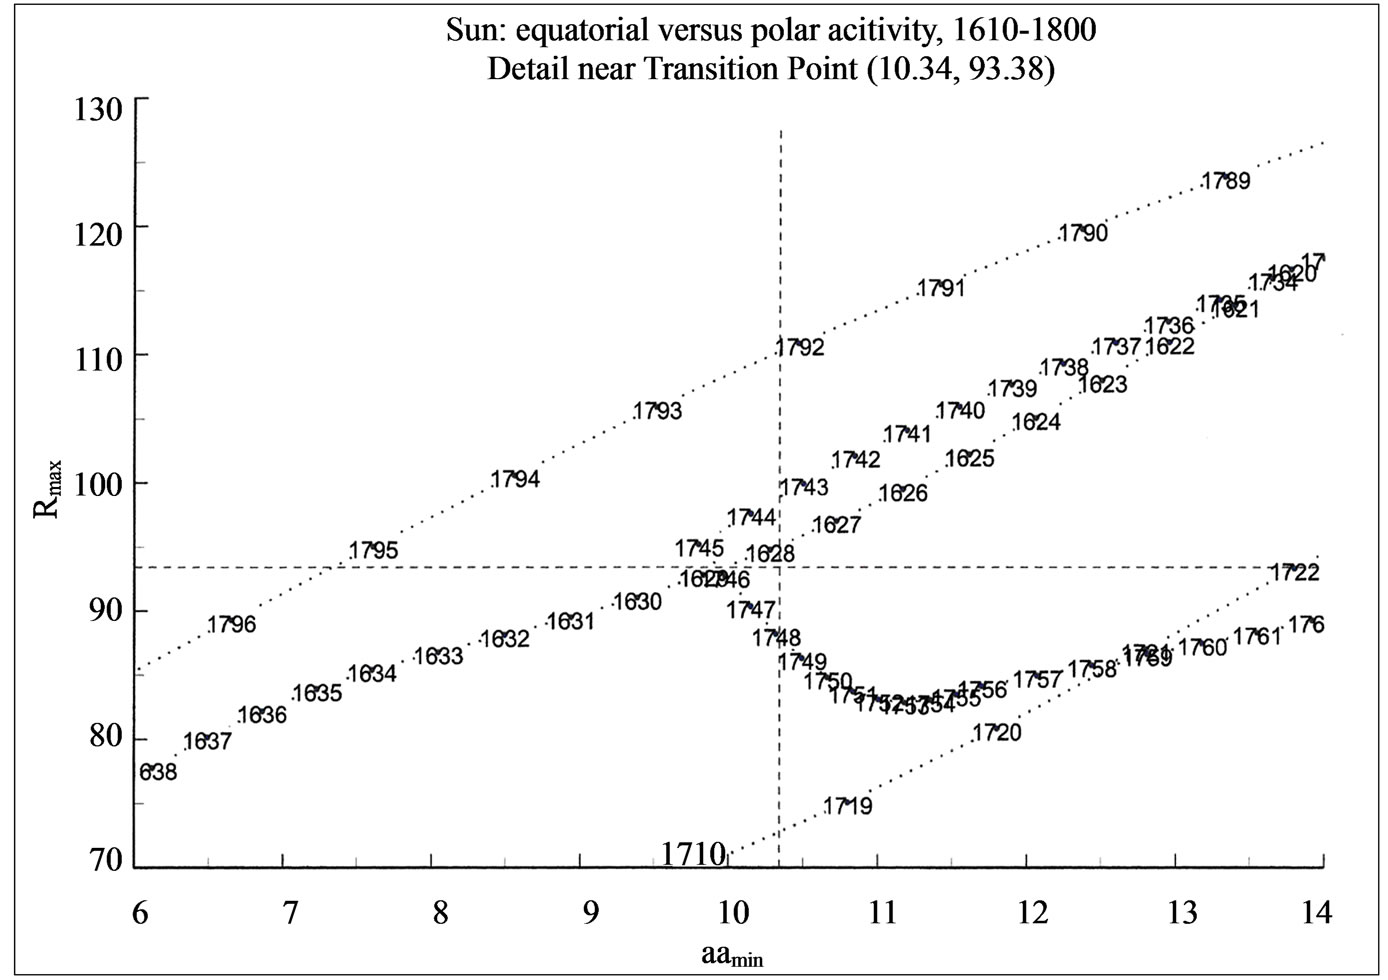
Figure 2. Enlarged central part of the phase diagram for the period 1610 to 1800 showing close passages to the Transition Point in 1628 and 1746.
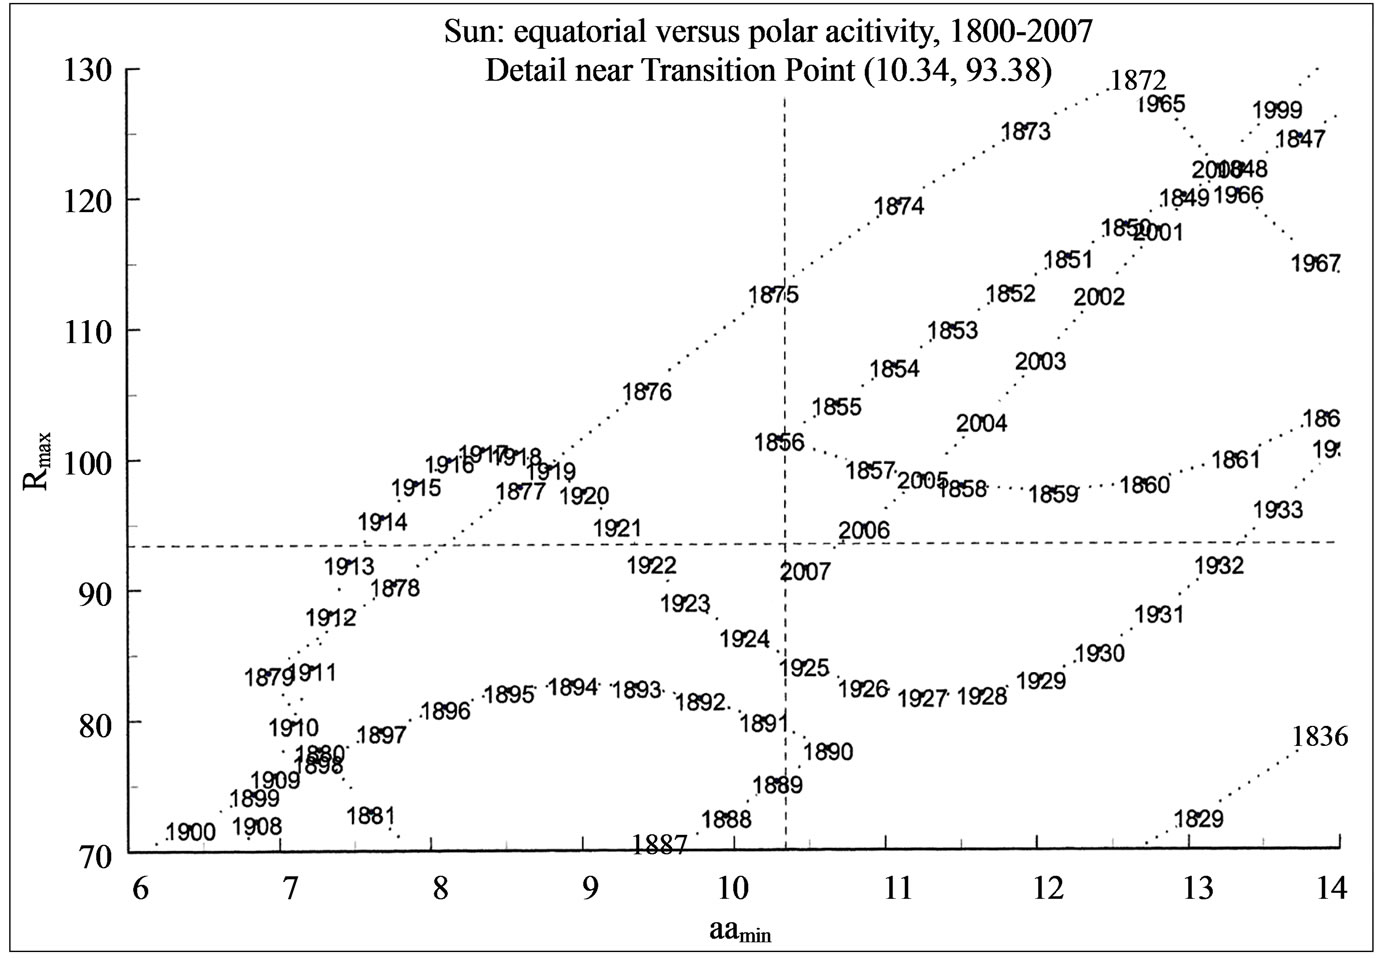
Figure 3. Enlarged central part of the phase diagram for the period 1800 to 2007 showing close passages to the Transition Point in 1923/’24 and in 2007.
in 1628 (onset of the Maunder Minimum) and again in 1746 (onset of the period of Regular Oscillations). We note that the Maunder Minimum terminated earlier than 1746, rather around 1740, and this deviating result may be due to the fact that the aamin data from before 1844 are based on an extrapolation and may, hence, not be fully reliable.
The phase diagram for the next period, from 1800 to 2007, is shown in Figure 3. The aamin data used here are direct measurements from 1844 onwards.
In order to find the “distance of closest passage” to the Transition Point we calculated the root of the quadratic sum of the differential aamin and Rmax values, both referenced against the coordinates of the Transition Point and both normalized by dividing them by the values of these coordinates, hence
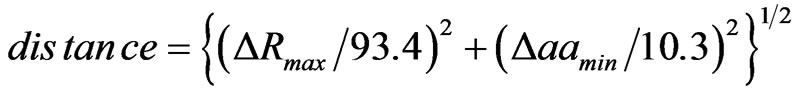 (3)
(3)
The resulting distance values are the following:
1628 0.01 start of Maunder Minimum
1746 0.03 start of Regular Oscillations
1923/24 0.07 start of Grand Maximum
2007 0.03 start of new Episode
These data confirm the empirical finding [28] that the passage of the (Rmax, aamin)-curve through or near the Transition Point signifies the start of another Grand Episode of solar activity. Why that is so, is a matter for another piece of solar research.
The essential result from the above exercise is that the extended transition phase, which lasted from ~2005 till ~2010, seems to be related to the start of another Grand Episode. Hence, it marks the end of the 20th century Grand Maximum, as described earlier in Duhau and De Jager [10] and in [2], cf. also [25,29].
The next question is that of the character of the new Grand Episode. It is unlikely that a Grand Minimum, such as the Maunder one, may be expected, because Grand Minima occur only during negative phases of the 2300 years lasting solar Hallstatt oscillation (Steinhilber et al., [27]; De Jager and Duhau, [24]). A diagram like Figure 10 in Versteegh [30] shows that phases of pronounced low solar (Grand Minima) activity tend to cluster together during periods of negative Hallstatt oscillations. Actually, the Hallstatt periodicity is just a reflex of the repetitive clustering of Grand Minima each 2300 years. The Hallstatt oscillation changed from negative to positive in the middle of the 20th century. Therefore we do not expect Grand Minima in the coming millennium. On statistical grounds it may also be unlikely that we may expect another Grand Maximum. Duhau and De Jager [10,11] have given arguments that we may expect an episode of Regular Oscillations, as also occurred between 1740 and 1924. That episode includes the Dalton Minimum. It has sometimes been suggested that the present Schwabe cycle (#24) would be the first of another Dalton Minimum, but closer inspection shows that it is stronger than the three cycles of the Dalton Minimum. Therefore, that suggestion seems unlikely.
3. THE ONGOING SOLAR CYCLE
The past ~15 years have been fascinating for understanding the mechanisms that drive solar activity. This is reflected in the history of the many papers devoted to forecasting the maximum sunspot number Rmax for the present Schwabe cycle #24. More than fifty papers have been published in the past ~15 years on that topic. In virtually all forecasts published before about 2007 fairly high values for Rmax were expected. The history of these forecasts reflects the dramatic events that took place in the sun in the past decade. We describe this history on the basis of a selection of a few forecasts that seem crucial for describing in these events.
Prominent among these early forecasts is the classical investigation by Dikpati et al. [31]. On the basis of a sophisticated computer program describing the intricate functioning of the solar dynamo, these authors were capable to correctly “predict” the parameters of virtually all sunspot cycles of the Grand Maximum of the 20th century. On the basis of this highly satisfactory result they forecasted a fairly high maximum (30% to 50% higher than cycle 23) for cycle 24. Dikpati’s prediction was
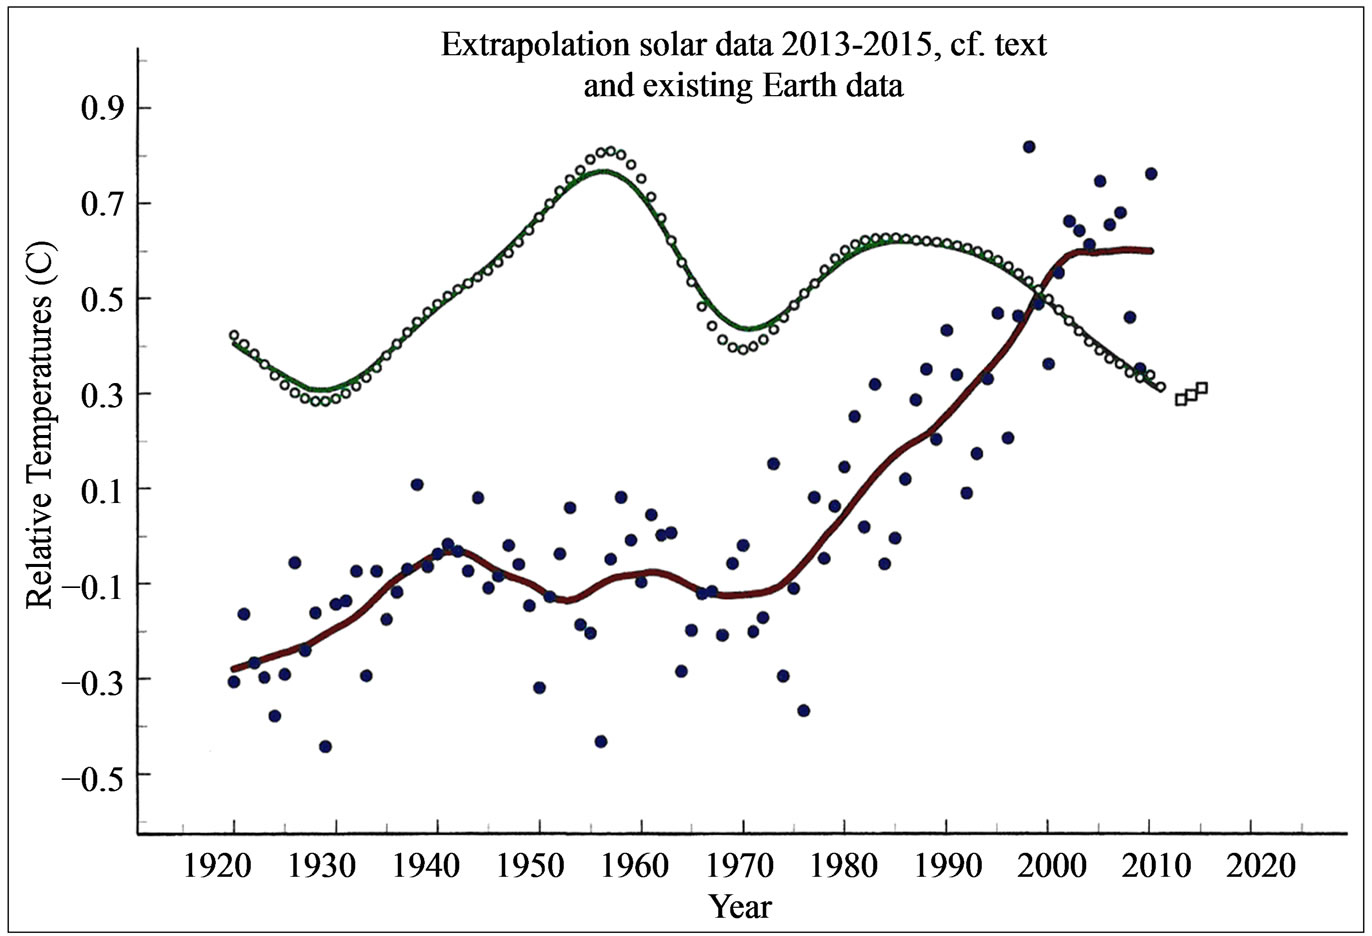
Figure 4. Values of ΔTsun for the Grand Maximum of the 20th century and their extrapolation to 2015 (dots), as explained in the text. For comparison the lower of the two curves gives ΔTearth.
supported by the initial work of Hathaway and Wilson [32], who expected a maximum as early as around 2010, with a maximum sunspot number of 160. In contrast to these high forecasts and prior to them Svalgaard et al. [33] had expected a low maximum, Rmax = 75 ± 8. This was supported by Schatten [34] who too had predicted a low maximum. The latter two investigations were made on the basis of an empirical relation between the preceding polar field strength of a solar cycle and the maximum sunspot number of the subsequent cycle.
At that time the solar community was still unaware of the exceptional and very intriguing phase transition that had just started at that time and that was to continue during the second part of the past decade (cf. [21-25]).
During that transition period, which lasted from about 2005 to 2010, solar activity reached very low values. As described in the preceding section this period marked the transition from the 20th centuries’ Grand Maximum to a next Grand Episode. It is yet unclear to solar researchers what happened to the solar dynamo during that transition period and neither are we certain of the character of the forthcoming Grand Episode that, apparently, has just started. As said earlier, a period of “Regular Oscillations” is most likely.
The low Svalgaard et al. [33] and Schatten’s [34] predictions were confirmed in later publications [2,10,11]. Their forecasts too were based on the empirical linear relation between aamin of the preceding cycle and Rmax of the subsequent one, in addition to a similar, also linear relation between the length of the forthcoming cycle and the preceding aamin value. These two relations were basic to the forecast that the maximum sunspot number would come around 2013.5 and that it would be low. While initially [10] an Rmax value of 68 was foreseen, the later publication [11] arrived at a value as small as 55. In [24] this number was changed to 62 ± 12. Within these error bounds the earlier two values do not deviate essentially from the latter one. A recent confirmation of this low forecasted sunspot number is by Kane [35] who published an expected value of Rmax = 72 ± 12, which lies within the Duhau-De Jager and the Schatten and Svalgaard et al. error bounds, hence essentially confirming these predictions.
At the time of writing this note, cycle 24 has passed through its maximum. The observed parameters of this cycle (cf. ISES Solar Cycle Sunspot Number Progression) show a maximum sunspot number of 66, while the maximum was reached in the first half of 2013. This information opens the way to estimate the value of ΔTsun for the duration of the present cycle.
A comparison of previous sunspot activity data [36] with those of the present solar cycle shows that the maximum of the present cycle is very similar in value to that of cycle #14. That cycle lasted from 1902 to 1913 and the maximum sunspot number, being 64.2 (smoothed: 67.24; cf. the Appendix to this paper) was reached in 1906. If one now would assume that the shape, as well as the Rmax and aamin data of the present cycle are the same as those of cycle #14 one would commit an error, because the smoothed data depend also on the preceding and following cycles. Therefore it would be erroneous to assume that the smoothed data for cycle #24 are identical to those for #14.
That being said, the best one can do is assuming that the data around sunspot maximum are approximately the same, because for these the influence of the neighbouring cycles is smallest (their total contribution is only ~16%). This is inherent to the smoothing procedure, that given most weight to the central data points. With these considerations in mind we copied the smoothed data for the years 1906-1908 and pasted then at the years 2013-2015. Figure 4 shows the values of ΔTsun for the past Grand Maximum (1924-2007 and up to 2009) as a solid line while the extrapolate data for the years 2013-2015 are given by dots.
The main result of the above is that the solar contribution ΔTsun is expected to be relatively small in the ongoing decade. The decrease to that low value started already around the year 2000. Figure 4 may help to explain why, after the sharp rise of the average terrestrial ground temperature between ~1950 and ~2000 (as shown in Figure 1), that rise slowed down during the past ~10 years (cf. e.g. [17,18]) to come (nearly) to a standstill. We suggest that this slowing down is the effect of the decrease in value of the solar component, a decrease that started to be of some importance after ~1998. It should be compared with the gradual temperature rise due to non-solar contributions. The combined effect results in the presently observed slower rise of temperature. For comparison we consider the period around 1970, when ΔTsun went through a valley. Here too, the rise in ΔTearth presented a standstill.
4. CONCLUSIONS; OPEN QUESTIONS
During the major part of the investigated time period, 1610 up to ~1900-1950, the variation of the terrestrial ground temperature appears to be related to solar variability, apart from apparently chaotic and irregular nonsystematic fluctuations.
The effect of the present solar low activity cycle (#24), in addition to the recent Phase Transition results in a reduced value of ΔTsun during the past decade. That component may be responsible for the slower rise of the temperature that occurred after about 2000.
The aim of this investigation was to examine how to improve our knowledge of the functioning of the solar dynamo by studying the influence of the sun on the average terrestrial ground temperatures. This paper shows the urgency of some theoretical investigations, of which we list the most essential ones, viz.:
• Why does solar activity change phase when the (Rmax, aamin)-curve passes through or near the Transition Point?
• Does the type of the next following Grand Episode depend on the “distance” of passage to the Transition Point, and if so, why?
• What is (are) the physical mechanism(s) that explain(s) the relation between the variation of the polar field fluxes and the terrestrial temperature variation?
• Why did the period of transition between the 20th century Grand Maximum and the subsequent Grand Episode last that unusually long, viz. from 2005 to 2010?
• We also note the small but conspicuous and yet unexplained gradient of the residuals between ~1700 and ~1900.
Answering these questions will greatly improve our knowledge of the solar dynamo.
5. ACKNOWLEDGEMENTS
We are obliged to Silvia Duhau for pleasant co-operation over the years that have also been leading to this investigation.
REFERENCES
- De Jager, C. and Duhau, S. (2009) Episodes of relative global warming. Journal of Atmospheric and Solar-Terrestrial Physics, 71, 94. http://dx.doi.org/10.1016/j.jastp.2008.11.013
- De Jager, C., Duhau, S. and Van Geel, B. (2010) Quantifying and specifying the solar influence on terrestrial surface temperature. Journal of Atmospheric and Solar-Terrestrial Physics, 72, 926. http://dx.doi.org/10.1016/j.jastp.2010.04.011
- Russell, C.T. (1975) On the possibility of deducing interplanetary and solar parameters from geomagnetic records. Solar Physics, 42, 259-269. http://dx.doi.org/10.1007/BF00153301
- Russell, C.T. and Mulligan, T. (1995) The 22-year variation of geomagnetic activity: Implications for the polar magnetic field of the sun. Geophysical Research Letters, 22, 328.
- Hathaway, D.H., Wilson. R.M. and Reichman, E.J. (1999) A synthesis of solar cycle prediction techniques. Journal of Geophysical Research, 104, 2257. http://dx.doi.org/10.1029/1999JA900313
- Duhau, S. and Chen, C. (2002) The sudden increases of solar and geomagnetic activity after 1923 as the manifestation of a non-linear solar dynamo. Geophysical Research Letters, 29, 6. http://dx.doi.org/10.1029/2001GL013953
- Mayaud, P.N. (1972) The aa-index; a 100 years series characterizing the magnetic activity. Journal of Geophysical Research, 67, 6870. http://dx.doi.org/10.1029/JA077i034p06870
- Nevanlinna, H. and Kataja, F. (1993) An extension of the geomagnetic index series aa for two solar cycles (1844 - 1898). Geophysical Research Letters, 20, 2700. http://dx.doi.org/10.1029/93GL03001
- De Jager, C. and Usoskin, I. (2006) On possible drivers of sun-induced climate changes. Journal of Atmospheric and Solar-Terrestrial Physics, 68, 2053. http://dx.doi.org/10.1016/j.jastp.2006.05.019
- Duhau, S. and De Jager, C. (2008) The solar dynamo and its phase transitions during the last millennium. Solar Physics, 250, 1. http://dx.doi.org/10.1007/s11207-008-9212-x
- Duhau, S. and De Jager, C. (2010) The forthcoming Grand Minimum of solar activity. Journal of Cosmology, 8, 983.
- Callebaut, D.K. and Makarov, V.I. (1992) Latitude-time distribution of three types of magnetic activity in the polar cycle. Solar Physics, 141, 381. http://dx.doi.org/10.1007/BF00155187
- Nagovitsyn, Yu.A. (2006) Solar magnetic activity on a long time scale. Reconstruction and possibility for predictions. Astronical Letters, 32, 344-352. http://dx.doi.org/10.1134/S1063773706050082
- Moberg, H., Sonechkin, D.M., Holmgren, K., Datchenko, N.M. and Karlén, M. (2005) Highly variable northern hemisphere temperatures, reconstructed from lowand highresolution proxy data. Nature, 433, 613. http://dx.doi.org/10.1038/nature03265
- Brohan, P., Kennedy, J.J., Harris, L., Tett, S.B.F. and Jones, P.D. (2006) Uncertainty estimates in regional and global observed temperature changes; a new data set from 1850. Journal of Geophysical Research, 111, D12106. http://dx.doi.org/10.1029/2005JD006548
- Kennedy, J., Good, S., Tichner, H. and Palmer, M. (2008). Global and regional climate in 2008. Weather, 64, 288. http://dx.doi.org/10.1002/wea.467
- Kerr, R.A. (2009) What happened to global warming? Science, 326, 28. http://dx.doi.org/10.1126/science.326_28a
- Hansen, J., Ruedy, R., Sato, M. and Lo, K. (2010) Global surface temperature change. Reviews of Geophysics, 98, RG 4004.
- Cleveland, W.S. (1981) LOWESS: A program for smoothing scatter plots by robust locally weighted regression. The American Statistician, 35, 54. http://dx.doi.org/10.2307/2683591
- Cleveland, W.S. (1985) The elements of graphing data (Wadsworth Advanced Books and Software).
- Clete, T. and Lefevre, S. (2012) Are the sunspots really vanishing? Anomalies in the solar cycle 23 and the implications for long-term models and proxies. Journal of Space Weather Space Climate, 2, A06. http://dx.doi.org/10.1051/swsc/2012007
- Lockwood, M. (2012) Solar influence on global and regional climates. Surveys in Geophysics, 33, 1513. http://dx.doi.org/10.1007/s10712-012-9181-3
- De Jager, C. and Duhau, S. (2011) The variable solar dynamo and the present solar activity; influence on terrestrial surface temperature. In: Cossia, J.M., Ed., Global Warming in the 21st century.
- De Jager, C. and Duhau, S. (2012) Sudden transitions and grand variations in the solar dynamo, past and present. Journal of Space Weather and Climate, 2, A07. http://dx.doi.org/10.1051/swsc/2012008
- De Jager, C. (2012) Solar forcing of climate. Surveys in Geophysics, 33, 445-451. http://dx.doi.org/10.1007/s10712-012-9193-z
- Usoskin, I.G., Solanki, S., Schüssler, M., Mursula, K. and Alanko, K. (2003) Millennium-scale sunspot number reconstruction: Evidence for an unusually active Sun since the 1940s. Physical Review Letters, 91, 211101-1-4.
- Solanki, S.K., Usoskin, I.G., Kromer, B., Schüssler, M. and Beer, J. (2004) Unusualactivity of the sun during recent decades compared to previous 11,000 years. Nature, 431, 1084. http://dx.doi.org/10.1038/nature02995
- Duhau, S. (2003) Solar variability as an input to the Earth’s environment. ESA SP, 535, 91.
- Steinhilber, E., Abreu, J.A., Beer, J. and McKracken, K.G. (2010) Interplanetary magnetic fields during the past 9399 years inferred from cosmogenic radionuclides. Journal of Geophysical Research, 115, A01104. http://dx.doi.org/10.1029/2009JA014193
- Versteegh, G.J.M. (2005) Solar forcing of climate. 2. Evidence from the past. Space Science Reviews, 120, 243. http://dx.doi.org/10.1007/s11214-005-7047-4
- Dikpati, M., De Toma, G. and Gilman, P.A. (2006) Predicting the strength of solar cycle 24 using a flux transport dynamo based tool. Geophys. Research Letters, 33, L05102. http://dx.doi.org/10.1029/2005GL025221
- Hathaway, D.H. and Wilson, R.M. (2006) Geomagnetic activity indicates large amplitude for sunspot cycle 24. Geophysical Research Letters, 33, L18101. http://dx.doi.org/10.1029/2006GL027053
- Svalgaard, L., Cliver, E.W. and Kamide, Y. (2005) Sunspot cycle 24: Smallest cycle in 100 years? Geophysical Research Letters, 32, L01104. http://dx.doi.org/10.1029/2004GL021664
- Schatten, K.H. (2005) Fair space weather for solar cycle 24. Geophysical Research Letters, 32, L21106.
- Kane, R.P. (2012) An estimate for the size of sunspot cycle 24. Solar Physics, 282, 87. http://dx.doi.org/10.1007/s11207-012-0131-5
- Kane, R.P. (2002) Some implications using the Group Sunspot Number reconstruction. Solar Physics, 205, 383. http://dx.doi.org/10.1023/A:1014296529097
APPENDIX
An appendix, containing the input and output data of this investigation can be consulted at the website www.cdejager.com on the page “sun-earth publications” and there on “2013_sun_climate_Appendix”.