Natural Science
Vol.5 No.7(2013), Article ID:34114,14 pages DOI:10.4236/ns.2013.57099
Application of the dust simulation models in the Middle East, and dust-dispersion toward the western/southwestern Iran (case study: 22-26 June 2010)
![]()
1Atmospheric Sciences and Meteorological Research Centre (ASMERC), Tehran, Iran
2Shakhes Pajoh Research Center, Isfahan, Iran; *Corresponding Author: ali_didehvar714@yahoo.com
Copyright © 2013 Mojtaba Zoljoodi et al. This is an open access article distributed under the Creative Commons Attribution License, which permits unrestricted use, distribution, and reproduction in any medium, provided the original work is properly cited.
Received 6 April 2013; revised 6 May 2013; accepted 14 May 2013
Keywords: Dust Simulation Models; HYSPLIT; WRF/CHEM; Satellite Images; Visibility Dataset; West/Southwest of Iran
ABSTRACT
Many developed researches have confirmed the increasing of dust event and its dangerous impacts on the environment, health, economy, etc. in west and southwest of Iran during the recent decade. This investigation aims to have a comparison between the derived outputs from the dust simulation models and satellite images analysis over 22-26 June 2010, as this spell is considered a typical case of the dust event over the western/southwestern parts of Iran. We found that the obtained results from the HYSPLIT and WRF/CHEM models respectively on dust dispersion trajectories and aerosol concentration rate were reliable to be used in dust prediction systems over the region.
1. INTRODUCTION
Dust aerosol in the atmosphere has a significantly direct and indirect effect on climate on various spatial scales, from local and regional to global [1].
In arid and semiarid areas, dust storms occur frequently. Sand and dust storms (SDS) have caused devastating damages to properties and human health in the southwest of Asia. When surface winds are strong, large amounts of sand and dust can be lifted from bare, dry soils into the atmosphere and transported downwind affecting regions hundreds to thousands of kilometers away. Jaffe et al.
(2003) [2] have shown that extreme episodes of dust transport can adversely impact air quality in regions far from the original emission source. Zouljoodi et al. (2013) [3] have developed a research on dust events in western Iran and drought expansion over the Middle East, through this investigation they have detected firstly the dust source areas over Iraq and Syria, then it is found that the recent droughts in the external dust source areas (over Iraq and Syria) had the remarkable potential to increase the dust events in the west of Iran.
Joseph M. and Peter J. (2003) [4], have considered African droughts and dust transport to the Caribbean, so they found that, because of the great sensitivity of dust emission to climate, future changes in climate could result in large changes in emissions from African and other arid regions that, in turn, could lead to impacts on climate over large areas.
In the last few decades numerical models have been designed to reproduce the dust cycle allowing us to estimate the influence of mineral dust on the climate system [5]. Dust models are also required for short to medium range air quality forecast applications. To this end, several models have been developed with some of them providing daily forecast products, e.g. the Dust Regional Atmospheric Model (DREAM) [6], the SKIRON model [7], CHIMERE-Dust model [8], the Navy Aerosol Analysis and Prediction System (NAAPS) [9], the JMAMASINGAR dust model [10], or the ECMWF-IFS [11]. The DREAM model was further re-fined and tested in the last years. The updated version BSCDREAM8b [12- 17] is operated.
K. Haustein et al. (2012) [5] have developed a research on atmospheric dust modeling from meso to global scales with the online NMMB/BSC-Dust model—
Part 2: Experimental campaigns in Northern Africa. The new NMMB/BSC-Dust model is intended to provide short to medium-range weather and dust forecasts from regional to global scales.
In the recent years a lot of studies have been developed in Iran on the frequency of dust storm events (from statistical point of view) and the consideration of synoptic meteorological patterns which are leading to the dust storms. However we had not yet operated a reliable forecasting model of dust storms in Iran with a capability to demonstrate the dust source areas. Through this investigation we will present the derived outputs from WRF/ CHEM and HYSPLIT models which are considered a basic step to high resolution dust forecasting, recognizing of dust sources, dust storm trajectory and dust concentration rate. Meantime by using of the visibility datasets from the selected stations we illustrated the long term variability of the dust in monthly and yearly scales. The satellite images of 22-26 June 2010 have been taken into consideration to comparing of the derived out puts from the applied models.
1.1. WRF/CHEM Model
The Weather Research and Forecasting (WRF) model is a next generation meteorological model being developed collaboratively among several agencies (NOAA/ NCEP, NOAA/ESRL, NCAR). WRF-Chem is a version of WRF that also simultaneously simulates the emission, turbulent mixing, transport, transformation, and fate of trace gases and aerosols. The WRF Atmospheric Chemistry Working Group is guiding the development of WRF-Chem. The main objectives of WRF/CHEM model are as following:
1) Integrate WRF-Chem simulations and a wide range of field campaign measurements to develop a better understanding of local and regional-scale evolution of particulates and aerosol radiative forcing that are sub-grid scale processes for global climate models;
2) Employ the modeling framework of WRF-Chem to develop new treatments of aerosol processes for global climate models;
3) Perform process studies investigating aerosol aging, aerosol-cloud interactions, and aerosol radiative forcing;
4) Explore the feasibility of using a version of WRFChem as a regional climate model.
As part of an internal PNNL project, the trace gas and aerosol chemistry modules of the PNNL Eulerian Gas and Aerosol Scalable Unified System (PEGASUS) [18, 19] were implemented into the WRF framework during 2004 and 2005. An “off-line” coupling of meteorology and chemistry is employed in PEGASUS so that the meteorological fields are read from files at specified time intervals; however, the “on-line” coupling of meteorology and chemistry in WRF more accurately represents of the evolution of trace gases and aerosols and permits the inclusion of feedback processes important for climate applications. Aerosol-radiation-cloud feedback processes, cloud chemistry, and cloud-aerosol interactions were incorporated into WRF-Chem during 2005 and 2006. Merging chemistry and aerosol process modules into the WRF framework have enabled PNNL scientists to better understand the uncertainties associated with aerosol radiative forcing and the impact of aerosols on clouds, distribute PNNL research among the scientific community, and promote collaborative activities with other research groups.
1.2. HYSPLIT Model
The HYSPLIT (HYbrid Single-Particle Lagrangian Integrated Trajectory) model is a complete system for computing simple air parcel trajectories to complex dispersion and deposition simulations. The initial development was a result of a joint effort between NOAA and Australia’s Bureau of Meteorology. Recent upgrades include enhancements provided by a number of different contributors. Some new features include improved advection algorithms, updated stability and dispersion equations, continued improvements to the graphical user interface, and the option to include modules for chemical transformations. Without the additional dispersion modules, Hysplit computes the advection of a single pollutant particle, or simply its trajectory.
The dispersion of a pollutant is calculated by assuming either puff or particle dispersion. In the puff model, puffs expand until they exceed the size of the meteorological grid cell (either horizontally or vertically) and then split into several new puffs, each with its share of the pollutant mass. In the particle model, a fixed number of particles are advocated about the model domain by the mean wind field and spread by a turbulent component. The model’s default configuration assumes a 3-dimensional particle distribution (horizontal and vertical).
The model can be run interactively on the Web through the READY system on our site or the code executable and meteorological data can be downloaded to a Windows or Mac PC. The web version has been configured with some limitations to avoid computational saturation of our web server. The registered PC version is complete with no computational restrictions, except that user’s must obtain their own meteorological data files. The unregistered version is identical to the registered version except that plume concentrations cannot be calculated with forecast meteorology data files. The trajectory-only model has no restrictions and forecast or archive trajectories may be computed with either version.
2. DATA AND MATERIALS
In this work, we have used the images derived from the Meteosat-91 for comparing with the outputs of the applied models. This satellite (Meteosat-9) is placed in a height of 35,800 km. over the equator (lat; 00˚:00') and prime meridian (lon; 00˚:00'). This satellite is the second generation of EUMETSAT2 satellites which were known already as MSG-23 that has been operated in 2005. The Meteosat-9 covers Europe, Africa, Middle East, some parts of the south eastern America, Atlantic Ocean and western side of the India Ocean. The images of Meteosat-9 through 12 spectrum channels are produced for each 15 minutes.
In order to run the models (WRF/CHEM and HYSPLIT) the FNL datasets have been used as the inputs of the models. The FNL (final) datasets in fact are the NCEP4 datasets which have been reanalyzed through the NOAA5 related laboratories. These datasets with a spatial resolution of 1˚ × 1˚ are available from Jul 1999, for 26 atmospheric levels (100 - 1000 hPa.) with the 6-hour time intervals. The FNL datasets use the GDAS6 for providing the initial data. The GDAS also gathers persistently the observation based datasets worldwide through the GTS7 and other resources [20].
Meantime the in situ visibility/dust datasets are gathered through the information technology administration of the IR of Iran meteorological organization.
Study Area
The developed studies on dust events over Iran demonstrated a high frequency of dust in the west and southwest of the country due to the external dust sources in Iraq and Syria [3], so we have chosen basically 5 stations over western and southwestern parts of the country which include: Sanandaj, Kermanshah, Ahvaz, Abadan and Boushehr synoptic stations (Figure 1). Also through the satellite images and the applied models the Middle East countries, especially Iraq and Syria, have been taken into account through this investigation.
3. RESULTS
3.1. Long Term Monitoring of Dust Events over 1980-2009
The datasets of horizontal visibility (visibility < 5 km.) from the 5 selected synoptic stations in the west and southwest of Iran have been gathered through 30 years (1980-2009) for monitoring the yearly and monthly variability of the dust events. All 5 stations (Sanandaj, Kermanshah, Ahvaz, Abadan and Bushehr) showed an increasing trend in dust frequency particularly over the recent decade/recent years, as this behavior seems to be more extreme in the southwest of the country than the western parts. Figure 2 shows a comparison between Ahvaz (in southwest) and Kermanshah (in west) stations, so obviously indicates high number of dusty days through the years in the Ahvaz station in contrast to the Kermanshah, in total we recorded 3600 dust events for Ahvaz, but 932 events in Kermanshah during this 30-year period.
3.2. Dust Event of 22-26 June 2010 (the Case Study)
In order to find the main causes and sources of dust events in the Middle East, we focused on the case study of 22-26 June 2010. This dust storm as a typical case is one of the most extreme dust events which caused effectively in declining of visibility as well as canceling of some flights in the west and southwest of Iran.
3.2.1. Using of Satellite Images (EUMETSAT)
Figures 3-6 are the images from the Meteosat-9 based on the universal time coordinated (UTC), during 22-26 June 2010.
The image of 22 June 2010 at 00:00 UTC (Figure 3) obviously showed a normal atmospheric status over the western parts of Iran and we did not observe any dust/ aerosols in the atmosphere over the study area, as the horizontal visibility in the 5 mentioned Iranian stations at this time has been normal.
Figure 4 shows the images of 23 June 2010 for different time intervals. According to the images at 06:00 and 12:00 UTC a concentration of dust over the centre of Iraq is observable (the dark rose color in the images indicates dust concentration). This dust concentration progressed toward the west of Iran at 15:00 and 18:00 UTC, so the visibility in Ahvaz and Kermanshah stations at 18:00 and 20:00 UTC has been recorded about 70 - 100 m that demonstrates an extreme dust event. Regarding the images of 21:00 and 22:00 UTC the dust is extended mostly over west and northwest of the country.
The Figure 5 shows the satellite images of 24 June 2010. A large dust concentration over west and northwest of Iran is observable at 06:00 and 09:00 UTC, also the southwestern border of the country has been covered by dust, as the visibility in Bushehr and Ahvaz stations respectively reached 800 m and 1200 m. As the images at 18:00 and 21:00 UTC illustrate the dust concentration over the western parts has been going gradually to be washy.
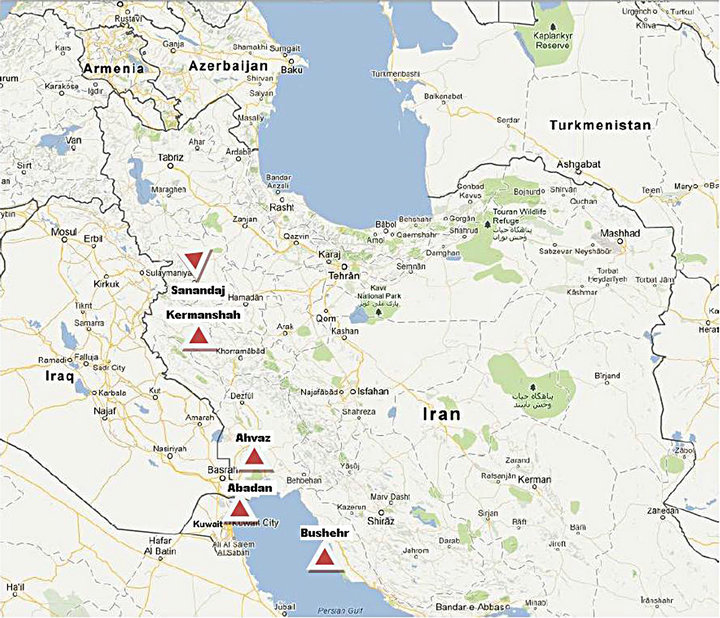
Figure 1. Geographic position of the study-stations (head of the red triangles).
Figure 6 includes the satellite images of 25 and 26 June 2010. As it is observable through the images the dust severity over the study area in the mentioned days remarkably has been decreased, and then the dust concentration in the atmosphere is very washy, so according to the 5 Iranian synoptic stations the horizontal visibility over west and southwest of the country is changed to the normal status.
3.2.2. HYSPLIT Model Implementation
For routing of the dust dispersion in 3 synoptic stations over the west of the country (Ahvaz, Eilam and Kermanshah stations) at 22-26 June 2010, the HYSPLIT model has been applied. The dispersion trajectories of aerosols/particles in the atmosphere are traced in 3 atmospheric levels of 100 m, 500 m and 1000 m through 6 h time intervals up to 24 h before dust reaching the stations. This model illustrates the routed trajectories of dust for each of the aforementioned stations in the horizontal (at the top of the figures) and the vertical (at bottom of the figures) profiles (Figure 7).
The Figure 7 shows the outputs of the HYSPLIT model for Ahvaz, Eilam and Kermanshah stations. The green, red and blue lines in the figures show respectively the trajectories of the suspended particles which were in the height of ≥1000 m, 500 m and ≤100 m, through 24 h ago that are dispersed toward Iran via atmospheric circulations. According to the found results the particles in 1000 m - 3000 m of the atmosphere due to low friction and high velocity of the wind more rapidly have been moved toward Iran than the particles in the 500 m and 100 m, as in the height of 1000 m - 3000 m the particles are fine and light and then easily lift into the air and progress to the high levels of the atmosphere. Mostly the
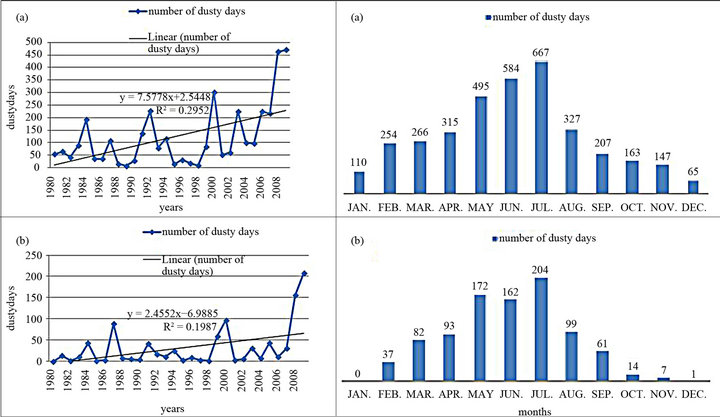
Figure 2. Number of dust events (visibility < 5 km) based on the years (left) and months (right) during 1980-2009 in Ahvaz (a) and Kermanshah (b) stations.
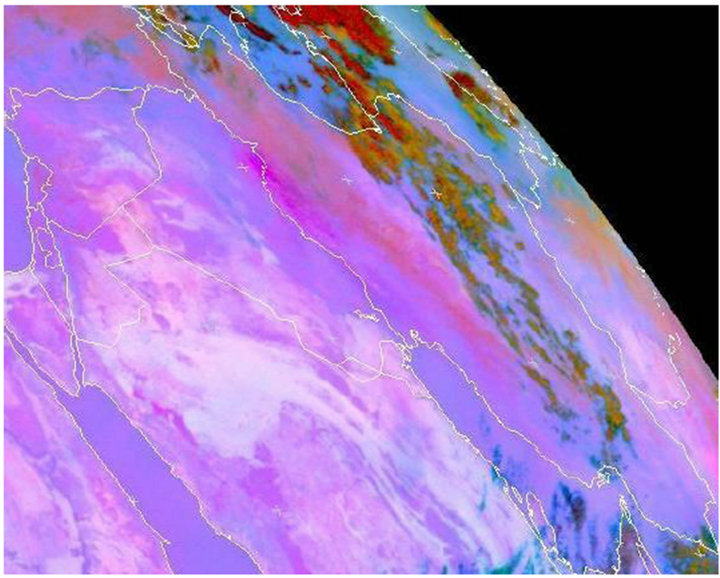
Figure 3. Satellite image from the Meteosat-9 at 22 June 2010, 00:00 UTC.
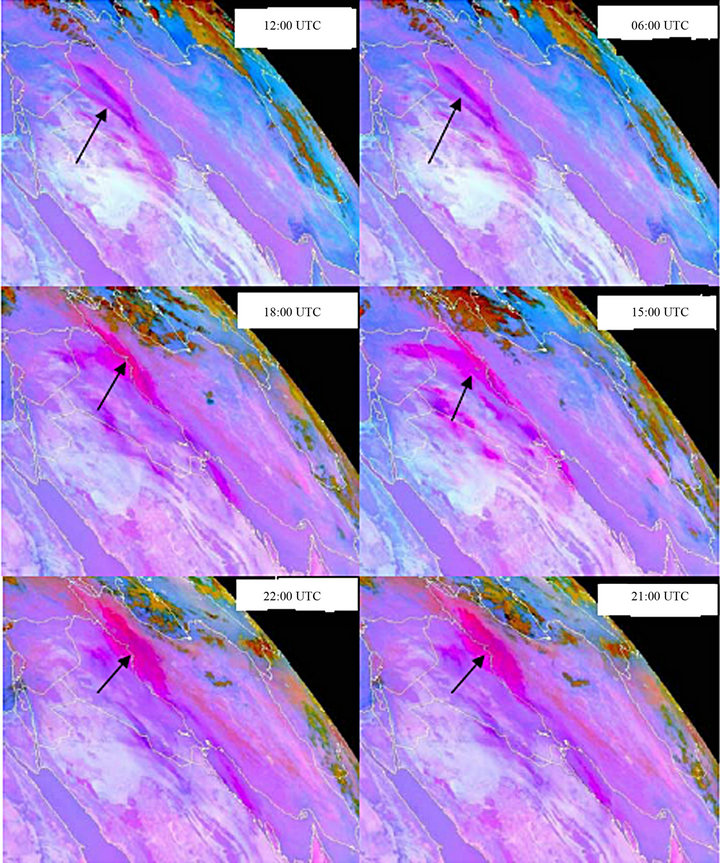
Figure 4. Satellite images from Meteosat-9 at 23 June 2010, for different hours (dark rose color in the images remarked by arrows indicate dust concentration).
sources of the dust in high levels of the atmosphere are in Syria or western parts of Iraq, whereas the particles in the height ≤ 100 m which include relatively gross as well as heavy particles and influence effectively the visibility, come from the sources in the centre or east parts of Iraq. For example the figures of 23 and 24 June 2010 (Figures
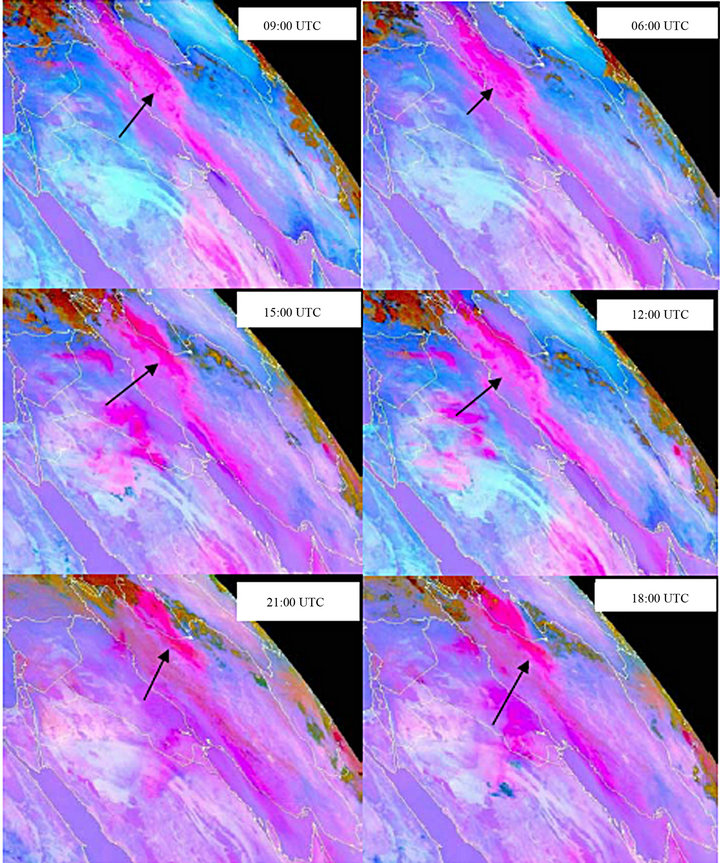
Figure 5. satellite images from Meteosat-9 at 24 Jun 2010, for different hours (dark rose color in the images remarked by arrows indicate dust concentration).
7(b) and (c)) that are considered the dusty days based on the images of Meteosat-9 and the visibility datasets of the synoptic stations, indicate the dust sources mostly in the centre of Iraq (in particular for the sources of particles in the height of ≤100 m). Comparing the results of the satellite images and the visibility datasets in the synoptic
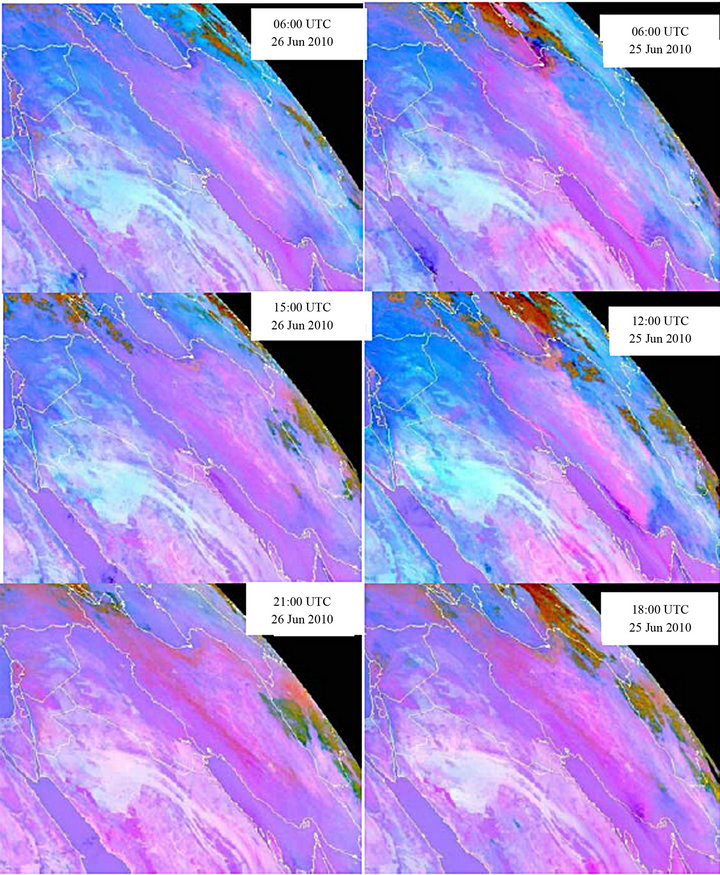
Figure 6. satellite images from Meteosat-9 at 25 and 26 June 2010, for different hours (Note: dust has been disappeared).
stations, we found that the HYSPLIT model can predict the trajectory of dust dispersion for each station 24 h before happening, so it seems to be a reliable model for dust early warning system. In the example of 23-24 June 2010, when the satellite images showed the dust over centre and west of Iraq, through the next 24 h the visibil-
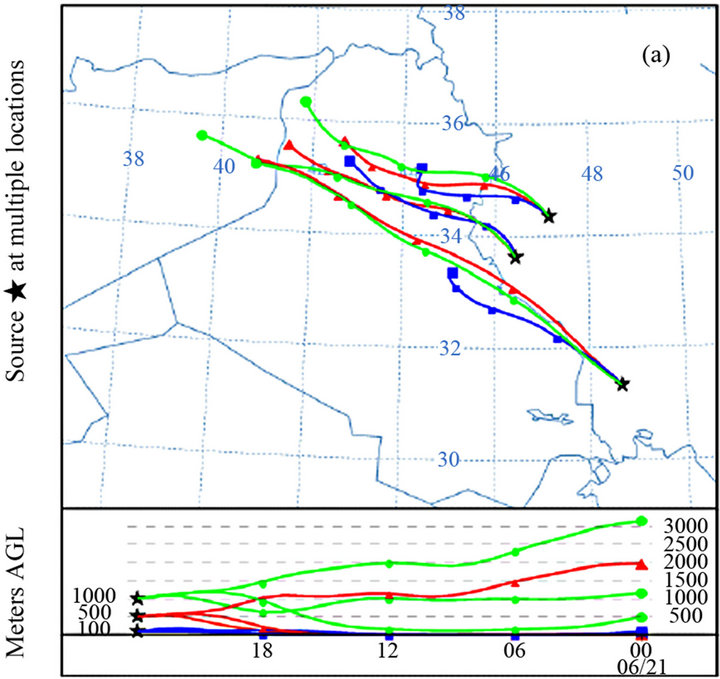
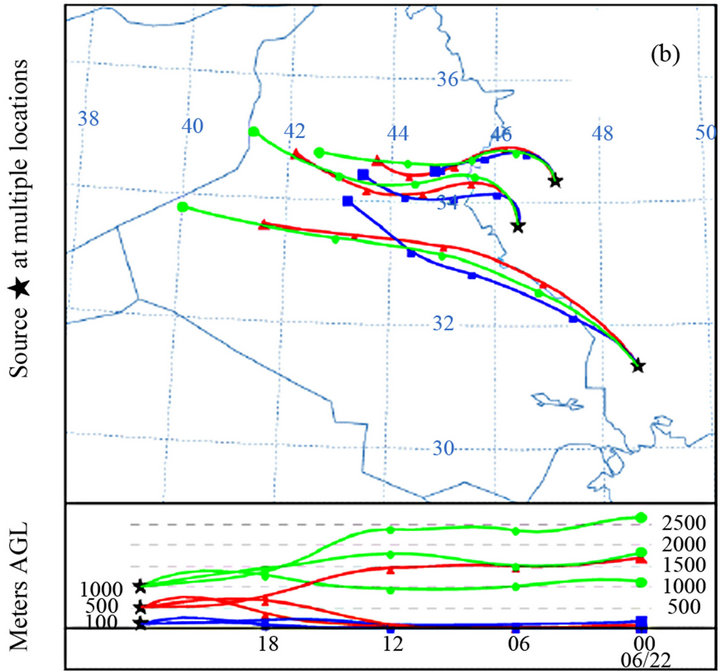
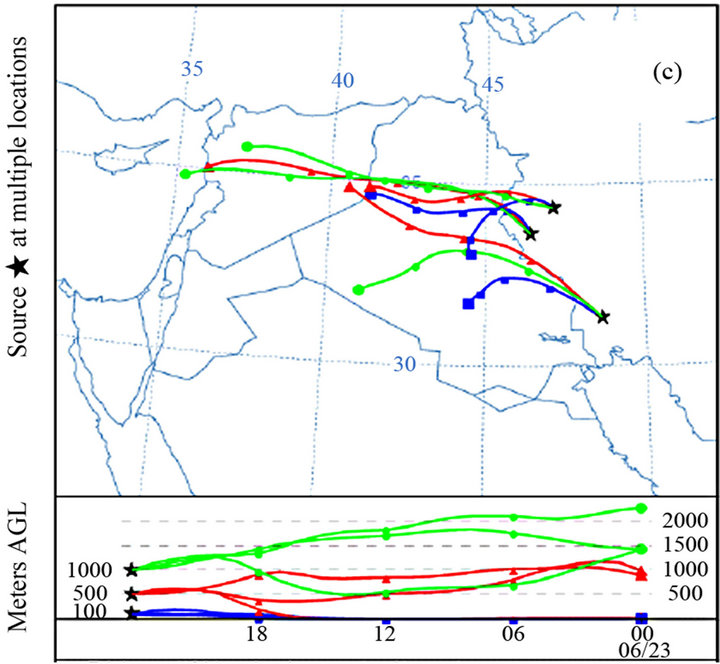
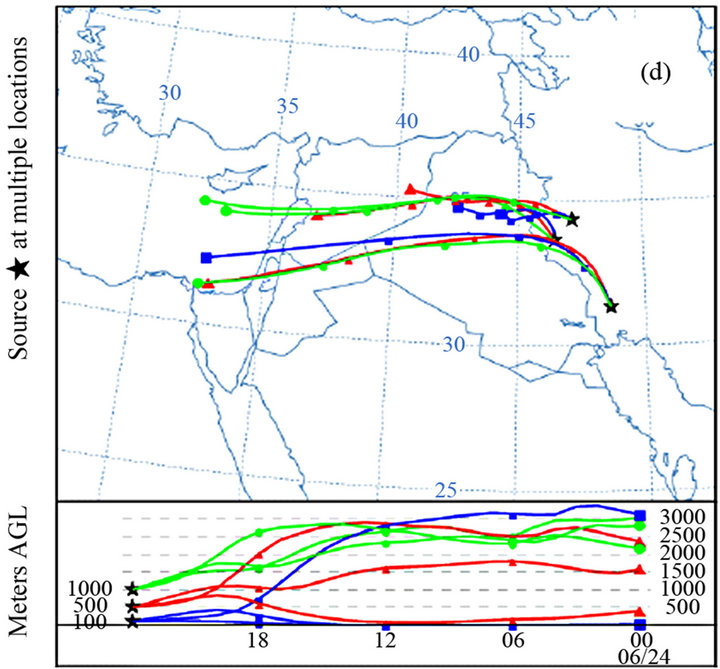
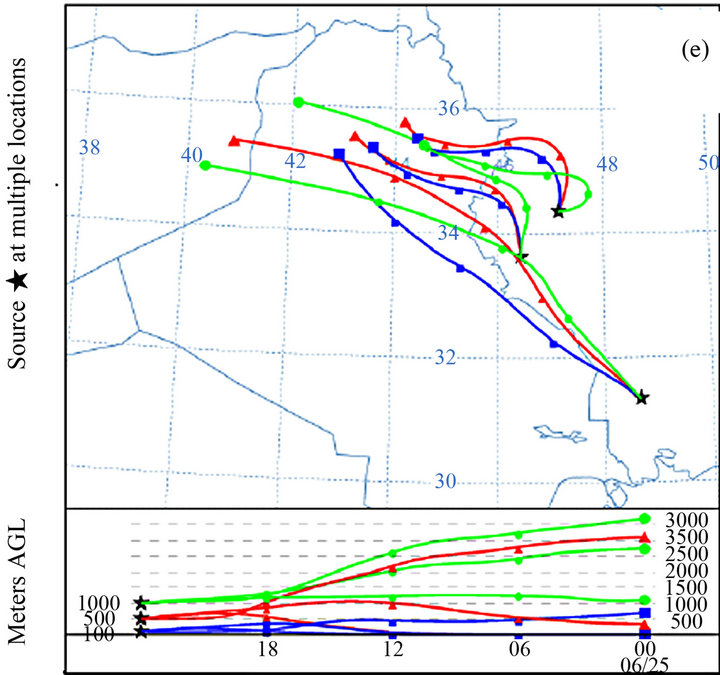
Figure 7. Derived outputs from HYSPLIT model for tracing of the dust sources and trajectories in the synoptic stations of Ahvaz, Eilam and Kermanshah at the heightlevels of 1000 m (green line), 500 m (red line) and 100 m (blue line) over 24 h. ago, with 6 h. intervals. (a) 22 June; (b) 23 June; (c) 24 June; (d) 25 June and (e) 26 June 2010. Back routing of the dust according to the atmosphere profile is drawn at the bottom of each figure over 24 h ago.
ity has been decreased to 800 - 200 m in Ahvaz, Boushehr, Eilam and Kermanshah stations.
3.2.3. WRF/CHEM Model Implementation
This model has been run for 22-26 June 2010 over the study area to predict the dust concentration in the atmosphere (in mcg/kg) regarding the wind directions and atmospheric pressure. We consider the outputs of the model here.
Figure 8 is the output of WRF/CHEM model for 22 June 2010 at 12:00 UTC over the study area. As the figure shows we don’t observe any dust concentration over Iraq and west of Iran and the visibility is in the normal status.
Figure 9 shows the dust concentration over the study area for 23 and 24 June 2010 at 00:00 and 12:00 UTC. As it is shown in 23 June 2010 at 00:00 UTC a dust accumulation has been active over the centre of Iraq, as it has a core with dust concentration rate around 5000 mcg/kg, and the westerly wind in the height of 10 m increased its velocity over this dust source. At the 12:00 UTC of the same day the westerly wind with high velocity gradually moved the dust accumulation toward west of Iran. In 24 June 2010 at 00:00 UTC the dust covers west and southwest of Iran, and at 12:00 UTC the dust concentration over western parts has been going to be more washy, whereas the southwest of the country indicates always a high dust concentration.
According to the model outputs, in 25 and 26 June 2010 dust event is disappeared gradually over the study area. As Figure 10 illustrates, in 25 June at 00:00 UTC only dust accumulation is observable over centre of Iraq and southwest of Iran and wind directions mostly are from northwest/north to southeast/south, then at 12:00 UTC the dust is almost disappeared over the region. In 26 June also we did not observe a remarkable dust accumulation over west and southwest of Iran.
As it is found through the outputs of WRF/CHEM model for 22-26 June 2010 over the study area, we can confirm a high correspondency about the spatial-temporal dust variations between these model outputs and satellite images of this period. This correspondency is a good index for the accuracy-test of the model.
Figure 11 shows dust concentration rates (based on WRF/CHEM) at a point in Iraq (33˚N and 43˚E) through 22-27 June 2010. As the hourly changes of dust variations indicated, in early hours of 23 June the dust concentration rate in this point reach around 6600 mcg/ kg and then this rate has been decreased in the next hours. In 24 and 25 June respectively the peak of dust concentration are about 4800 and 4700 mcg/kg and in 26 June it is in maximum 3800 mcg/kg.
According to the Figure 12, the dust concentration rates in the 4 Iranian stations which include Ahvaz, Eilam, Boushehr and Kermanshah, over the last hours of 23 Jun and especially early hours of 24 Jun have been increased and we observed the peak of aerosol concentration in the atmosphere. In the mentioned time respectively Ahvaz,
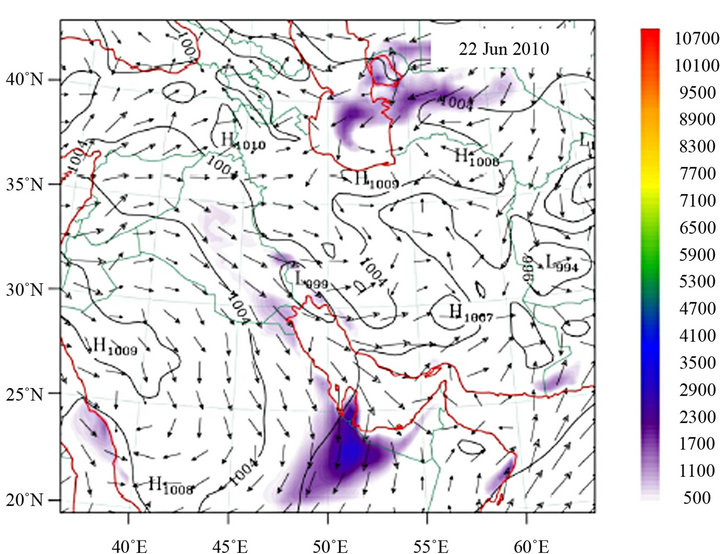
Figure 8. Dust concentration in dry air based on mcg/kg (colored legend), average of sea surface pressure in hPa. (black isobars) and wind directions in the height of 10 m (arrows) over the study area at 22 Jun 2010, 12:00 UTC.
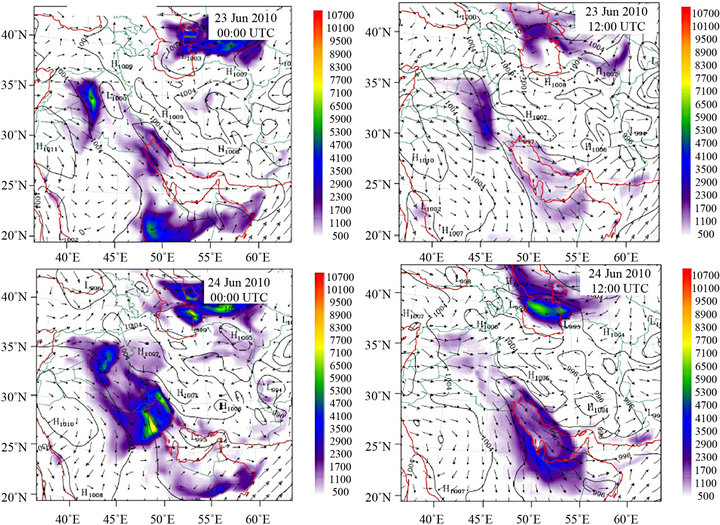
Figure 9. Dust concentration in dry air based on mcg/kg (colored legend), average of sea surface pressure in hPa. (black isobars) and wind directions in height of 10 m (arrows) over the study area at 23 Jun 2010, 00:00 and 12:00 UTC (top) and 24 Jun 2010, 00:00 and 12:00 UTC (bottom).
Eilam, Boushehr and Kermanshah stations indicated a rate of 3500, 3200, 3500 and 3200 mcg/kg, and in the coming days gradually the dust over the west and then southwest of the country is decreased and horizontal visibility changed to normal. The comparison between these temporal changes of dust concentration in Iraq and the Iranian stations, indicated the fact that; if we have dust event over centre of Iraq at a given time, then we may face to this event over west and southwest of Iran within coming 18 - 24 hours.
4. CONCLUSIONS
Dust storm as one of natural hazards which affect seriously economy, health, environment, etc. in the recent decade (especially in the recent years) has been increased in the Middle East countries and particularly over west and southwest of Iran. Atmospheric circulations, land surface cover and soil moisture deficit are considered the principal factors of dust rising. Studying the mechanism of dust storm occurrence, dust trajectory, velocity and concentration are so important in dust preparedness plans.
In this research, firstly, we have considered the frequency of dust events based on the hourly visibility dataset from 5 synoptic stations in west and southwest of the country during a 30-year period from 1980 to 2010. The obtained results obviously indicate the increasing of dust events in Iran especially over southwestern parts of the country in the recent decade/years. For example, Ahvaz synoptic station in the southwest with a long term yearly mean (in 30 years) of dust frequency about 120 dusty days, illustrates an increasing trend in the recent decade with a yearly mean of 221 dusty days, and in contrast, the results of other selected stations have been placed in the first rank. In a monthly analysis, we found that the highest frequency of dust events occurre at June and July, while the cold months show the lowest dust frequency. Through the analysis of the satellite images from Meteosat-9 over 22-26 June 2010, we find that during 2 days of 23 and 24 June, the dust reach the west and southwest of Iran and the visibility is decreased. And from 25 to 26 June gradually the visibility over the west-
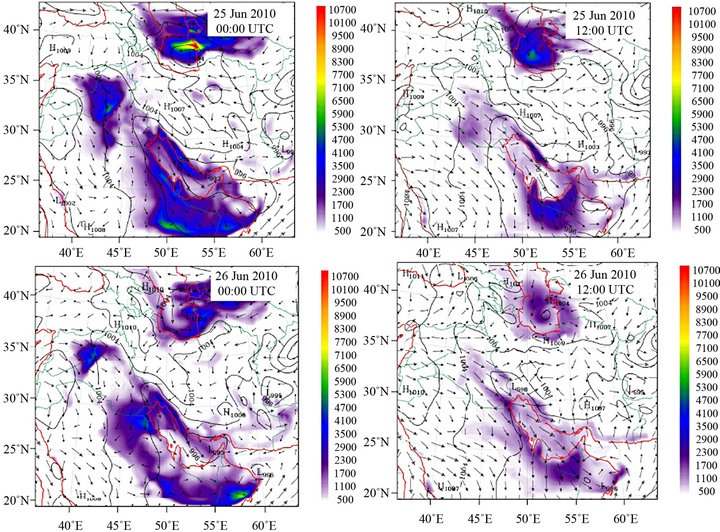
Figure 10. Dust concentration in dry air based on mcg/kg (colored legend), average of sea surface pressure in hPa. (black isobars) and wind directions in height of 10 m (arrows) over the study area at 25 June 2010, 00:00 and 12:00 UTC (top) and 26 June 2010, 00:00 and 12:00 UTC (bottom).
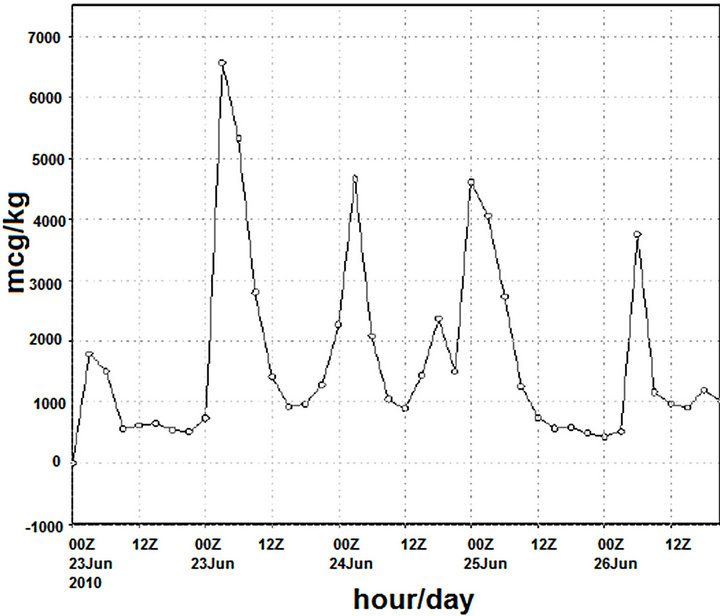
Figure 11. Temporal changes of dust concentration rate in dry air based on mcg/kg in a point of 33˚N and 43˚E (in Iraq) over 22-27 June 2010 (based on a 12 hour-intervals).
ern and then southwestern parts of the country has been changed to the normal status.
In the next step, we apply the dust simulation models for 22-26 June 2010. The HYSPLIT model that determines the dust sources and dispersion trajectories, illustrates that the sources of the aerosols suspended in the high levels of the atmosphere (1000 m - 3000 m) are in Syria or western parts of Iraq, whereas the particles in the height of below 100 m which include relatively coarse particles and influence seriously the visibility and health come from the sources in the centre or east parts of Iraq.
And the WRF/CHEM model has simulated the concentration/density rate of the suspended particles in the atmosphere. The results obtained from this model indicate a high accordance with the recorded visibility via the stations and the results of the satellite images analysis about dust accumulations and movements over the study area.
Briefly, the found results through this work imply that
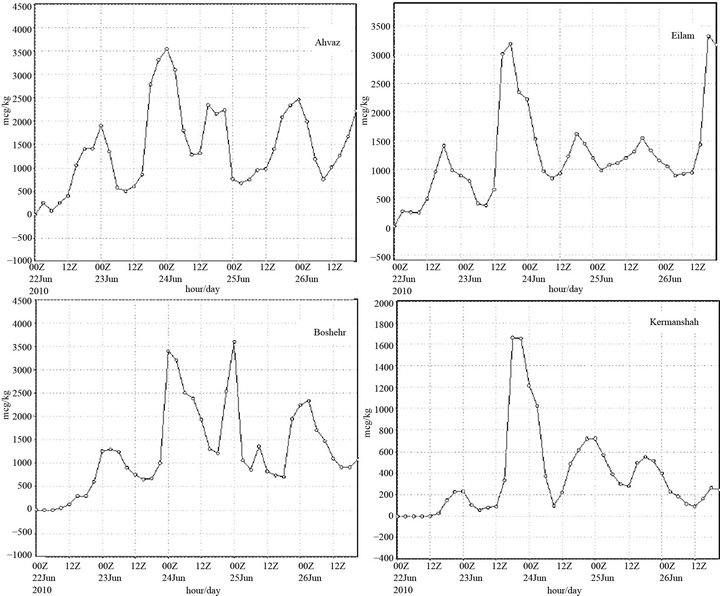
Figure 12. Temporal changes of dust concentration rate in dry air based on mcg/kg in Ahvaz (top left), Eilam (top right), Boshehr (bottom left) and Kermanshah (bottom right) synoptic stations of western and southwestern Iran over 22-27 June 2010 (based on a 12 hour-intervals).
the outputs of the applied models would be reliable to use in the dust early warning system which is considered a fundamental step of dust preparedness plan over the study area.
REFERENCES
- Huang, J.P., Minnis, P., Lin, B., Wang, T., Yi, Y., Hu, Y., Sun-Mack, S. and Ayers, K. (2006) Possible influences of Asian dust aerosols on cloud properties and radiative forcing observed from MODIS and CERES. Geophysical Reseach Letters, 33.
- Jaffe, D., Snow, J. and Cooper, O. (2003) The 2001 Asian dust events: Transport and impact on surface aerosol concentrations in the US. Eos, 84, 501-506. doi:10.1029/2003EO460001
- Zoljoodi, M., Didevarasl, A. and Ranjbar, A. (2013) Dust events in the western parts of Iran and the relationship with drought expansion over the dust-source areas in Iraq and Syria. Atmospheric and Climate Sciences (ACS), in press.
- Prospero, J.M. and Lamb, P.J. (2003) African droughts and dust transport to the Caribbean: Climate change implications. Science, 302, 1024-1027. doi:10.1126/science.1089915
- Haustein, K., Perez, C., Baldasano, J.M., Jorba, O., Basart, S., Miller, R.L., Janjic, Z., Black, T., Nickovic, S., Todd, M.C., Washington, R., Muller, D., Tesche, M., Weinzierl, B., Esselborn, M. and Schladitz, A. (2012) Atmospheric dust modeling from meso to global scales with the online NMMB/BSC-Dust model. Part 2: Experimental campaigns in Northern Africa. Atmospheric Chemistry and Physics, 12, 2933-2958. doi:10.5194/acp-12-2933-2012
- Nickovic, S., Kallos, G., Papadopoulos, A. and Kakaliagou, O. (2001) A model for prediction of desert dust cycle in the atmosphere. Journal of Geophysical Research: Atmospheres, 106, 18113-18129. doi:10.1029/2000JD900794
- Kallos, G., Nickovic, S., Papadopoulos, A., Jovic, D., Kakaliagou, O., Misirlis, N., Boukas, L., Mitikou, N., Sakelaridis, G., Papageorgiou, J., Anadranistakis, E. and Manousakis, M. (1997) The regional weather forecasting system SKIRON: An overview. Proc. Symp. Reg. Weather Pred. Par. Comp. Environ., 1, 109-123.
- Menut, L., Schmechtig, C. and Marticorena, B. (2005) Sensitivity of the sandblasting flux calculations to the soil size distribution accuracy. Journal of Atmospheric and Oceanic Technology, 22, 1875-1884. doi:10.1175/JTECH1825.1
- Christensen, J.H. (1997) The Danish eulerian hemispheric model—A three-dimensional air pollution model used for the Arctic. Atmospheric Environment, 31, 4169-4191. doi:10.1016/S1352-2310(97)00264-1
- Tanaka, T.Y. and Chiba, M. (2005) Global simulation of dust aerosol with a chemical transport model, MASINGAR. Journal of the Meteorological Society of Japan, 83A, 255-278. doi:10.2151/jmsj.83A.255
- Morcrette, J.-J., Beljaars, A., Benedetti, A., Jones, L. and Boucher, O. (2008) Sea-salt and dust aerosols in the ECMWF IFS model. Geophysical Research Letters, 35, L24813. doi:10.1029/2008GL036041
- Perez, C., Nickovic, S., Baldasano, J.M., Sicard, M., Rocadenbosch, F. and Cachorro, V.E. (2006) A long Saharan dust event over the western Mediterranean: Lidar, Sun photometer observations, and regional dust modeling. Journal of Geophysical Research, 111, D15214. doi:10.1029/2005JD006579
- Perez, C., Nickovic, S., Pejanovic, G., Baldasano, J.M., and Ozsoy, E. (2006) Interactive dust-radiation modeling: A step to improve weather forecasts. Journal of Geophysical Research, 111, D16206. doi:10.1029/2005JD006717
- Perez, C., Jimenez-Guerrero, P., Jorba, O., Baldasano, J., Cuevas, E., Nickovic, S. and Querol, X. (2007) Longterm simulations (1958-2006) of Saharan dust over the Mediterranean and the Eastern North Atlantic with the DREAM regional dust model. 24th International Union of Geodesy and Geophysics (IUGG) General Assembly, Perugia, 2-13 July 2007.
- Papayannis, A., Amiridis, V., Mona, L., Tsaknakis, G., Balis, D., Bosenberg, J., Chaikovsky, A., de Tomasi, F., Grigorov, I., Mattis, I., Mitev, V., Muller, D., Nickovic, S., Perez, C., Pietruczuk, A., Pisani, G., Ravetta, F., Rizi, V., Sicard, M., Trickl, T., Wiegner, M. and Gerding, M. (2008) Systematic lidar observations of aerosol optical properties during Saharan dust intrusions over Europe, in the frame of EARLINET (2000-2002): Statistical analysis and results. Journal of Geophysical Research, 113, 1-17, D10204. doi:10.1029/2007JD009028
- Haustein, K., Pérez, C., Baldasano, J.M., Muller, D., Tesche, M., Schladitz, A., Esselborn, M., Weinzierl, B., Kandler, K. and Hoyningen-Huene, W.V. (2009) Regional dust model performance during SAMUM 2006. Geophysical Research Letters, 36, L03812. doi:10.1029/2008GL036463
- Papanastasiou, D.K., Poupkou, A., Katragkou, E., Amiridis, V., Melas, D., Mihalopoulos, N., Basart, S., Pérez, C. and Baldasano, J.M. (2010) An assessment of the efficiency of dust regional modelling to predict Saharan dust transport episodes. Adv. Meteorol., 154368. doi:10.1155/2010/154368
- Fast, J.D., Gustafson Jr., W.I., Easter Jr., R.C., Zaveri, R.A., Barnard, J.C., Chapman, E.G., Grell, G. and Peckham, S.E. (2006) Evolution of ozone, particulates, and aerosol direct radiative forcing in the vicinity of Houston using a fully coupled meteorology-chemistry-aerosol model. Journal of Geophysical Research D: Atmospheres, 111, D21305. doi:10.1029/2005JD006721
- Fast, J.D., Zaveri, R.A., Bian, R.X., Chapman, E.G. and Easter Jr., R.C. (2002) Effect of regional-scale transport on oxidants in the vicinity of Philadelphia during the 1999 NE-OPS field campaign. Journal of Geophysical Research D: Atmospheres, 107. doi:10.1029/2001JD000980
- Stunder, B.J.B., Heffter, J.L. and Draxler, R.R. (2007) Airborne volcanic ash forecast area reliability. Weather and Forecasting, 22, 1132-1139. doi:10.1175/WAF1042.1
NOTES
1The Meteosat series of satellites are geostationary meteorological satellites.
2European Organization for the Exploitation of Meteorological Satellites.
3Meteosat Second Generation.
4National Centers for Environmental Prediction.
5National Oceanic and Atmospheric Administration.
6Global Data Assimilation system.
7Global Telecommunication System.