Natural Science
Vol.5 No.2(2013), Article ID:28061,7 pages DOI:10.4236/ns.2013.52033
Natural selection in vertebrate evolution under genomic and biosphere biases based on amino acid content: Primitive vertebrate hagfish (Eptatretus burgeri)
![]()
1Department of Obstetrics and Gynecology, Dokkyo Medical University, Tochigi, Japan; *Corresponding Author: kenjis@dokkyomed.ac.jp
2Center of Medical Informatics, Dokkyo Medical University, Tochigi, Japan
3Laboratory for International Environmental Health, Dokkyo Medical University, Tochigi, Japan
4Department of Anatomic Diagnostic Pathology, Dokkyo Medical University, Tochigi, Japan
Received 29 November 2012; revised 30 December 2012; accepted 14 January 2013
Keywords: Natural Selection; Vertebrate Evolution; Complete Mitochondrial Genome; Amino Acid Composition; 16S rRNA; Hagfish (Eptatretus burgeri)
ABSTRACT
Cluster analyses using the amino acid content predicted from the coding regions (13 genes) of complete vertebrate mitochondrial genomes as traits grouped selected vertebrates into two clusters, terrestrial and aquatic vertebrates. Exceptions were the hagfish (Eptatretus burgeri), thought to be an early ancestor of vertebrates, and the black spotted frog (Rana nigromaculata), which is terrestrial as an adult and aquatic as a larva. These two species fall into the terrestrial and aquatic clusters, respectively. Using the nucleotide (G, C, T and A) content in the coding and non-coding regions, and in the complete genome as traits, similar results were obtained but with some additional exceptions. In addition, phylogenetic analyses of 16S rRNA sequences produced a consistent result. The results of this study indicated that vertebrate evolution is controlled by natural selection under both an internal bias as a result of nucleotide replacement genomic rules, and an external bias caused by environmental biospheric conditions.
1. INTRODUCTION
The concept of natural selection was established by Charles Darwin and Alfred Wallace 150 years ago. This theory was derived from specific differences or similarities in the phenotypes of organisms that lived on geologically isolated islands. The theory of biological evolution has been further developed by palaeontology [1], using phenotypic changes in fossils, and by molecular biology [2], using genotypic changes (nucleotides or amino acids) in living organisms. The results from these studies have been used to draw phylogenetic trees that have helped make biological evolution more understandable.
Sorimachi [3] proposed that the amino acid composition of cellular proteins reflects biological evolution. Methods for complete genome analysis were also developed [4] and a draft sequence of the human genome was completed in 2001 [5,6]. However, the methods used for single gene analysis are unsuitable for the analysis of complete genomes, which consist of coding and noncoding regions. The amino acid composition of the proteins encoded in a genome is independent of the size of the genome. This property has been used to investigate the biological evolution of whole organisms [7]. The amino acid composition of the predicted proteins from the complete genomes of archaebacteria coincided with the composition obtained from whole cell lysates [8].
It has been reported that in complete single-stranded DNA genomes, the nucleotide content alternations were strictly controlled, and were expressed by linear regression lines of nucleotide content relationships in both coding and non-coding regions [9]. In addition, Chargaff’s second parity rule [10] was confirmed for a large number of complete double-stranded DNA genomes, and the nucleotide content relationships were expressed by linear formulas [11]. As a result of certain biases on nucleotide evolution, organisms have been classified into several groups, and many organisms have been classified based on cluster analyses using codon usage patterns or amino acid contents as traits [12]. This study has been designed to detect the existence of natural selection in biological evolution using factors such as internal bias as a result of genomic rules, and external environmental (original natural selection) biases that might influence biological evolution. The aim was to classify the organisms into two groups based on amino acid content, the terrestrial and aquatic vertebrates, reflecting the fact that evolution proceeded independently within these different biospheres.
2. MATERIALS AND METHODS
Mitochondrial genome data were obtained from the National Center for Biotechnology Information (NCBI, http://www.ncbi.nlm.nih.gov/sites). The organisms examined has been described previously [13]. In an earlier study, these organisms were chosen according to the alphabetical order of the scientific name without any prepossession for the organisms’ characteristics [13]. The nucleotide contents of the coding and non-coding regions of the mitochondrial genomes were compared to the content of the complete single DNA [13] and were normalized to 1 (G + C + T + A = 1). The predicted amino acid compositions of the coding regions of the complete mitochondrial genomes were estimated. The classifications were performed by multivariate analyses using software developed by ESUMI (Tokyo, Japan). Calculations were performed using Microsoft Excel (version 2003). The construction of phylogenetic trees of 16S rRNA was carried out by the Neighbour-joining method [14] based on multiple alignment using clustal W, DINASIS Axon, developed by Hitachi Solutions, Ltd., (Tokyo, Japan). The target gene was 16S rRNA which has been well characterized [15,16].
3. RESULTS
3.1. Amino Acid Compositions
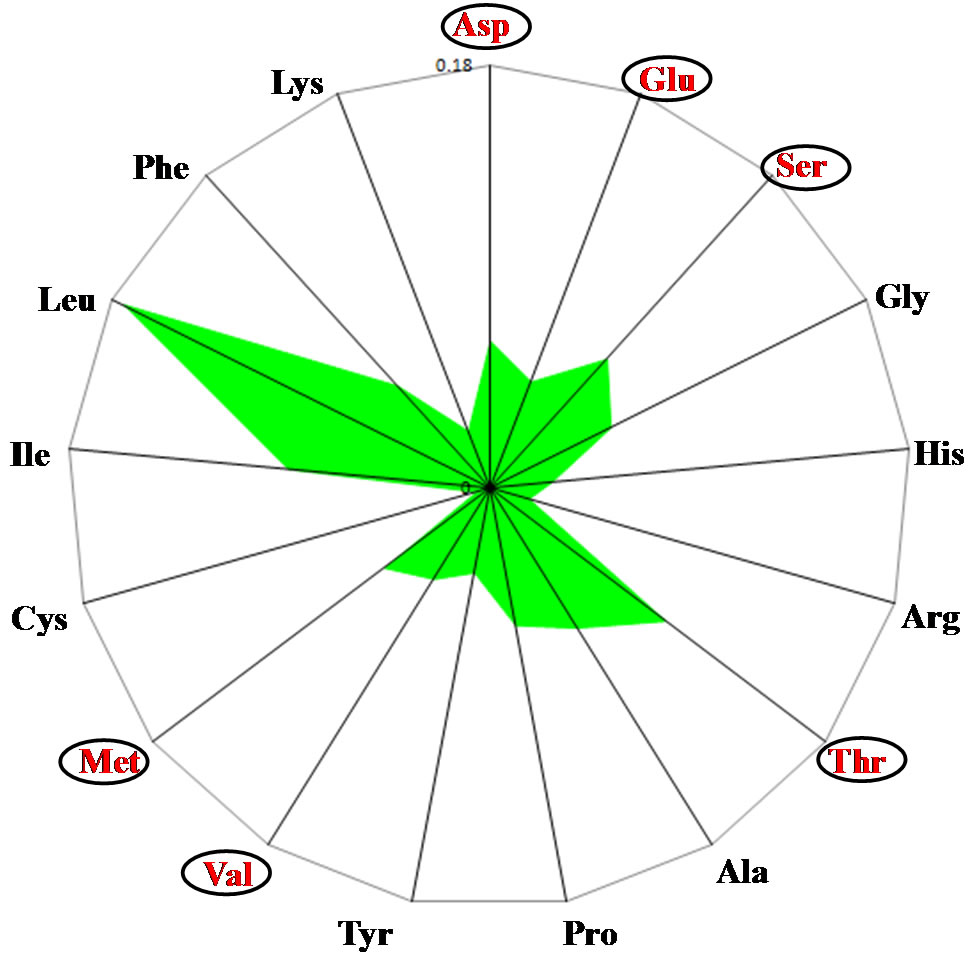
In the analysis of amino acid compositions in the human (Homo sapiens) mitochondrial genome, the Leu content was extremely high compared with the other amino acids (Figure 1(a)) and differed from that reported in nuclear genomes [13]. The Glu content was the lowest among the Asp, Glu and Ser contents, and the Thr and Met contents were higher than the Ala and Val contents, respectively. These differences formed characteristic shapes on the radar charts. The human mitochondrial genome was used to represent terrestrial vertebrates and the mitochondrial genome of Japanese medaka, bony fish (Oryzias latipes), was used to represent aquatic vertebrates. The amino acid composition in O. latipes wassimilar to that of the human mitochondrial genome (Figure 1(b)). However, the relationships among the Asp, Glu and Ser contents and the Thr and Ala, and Val and
 (a)
(a)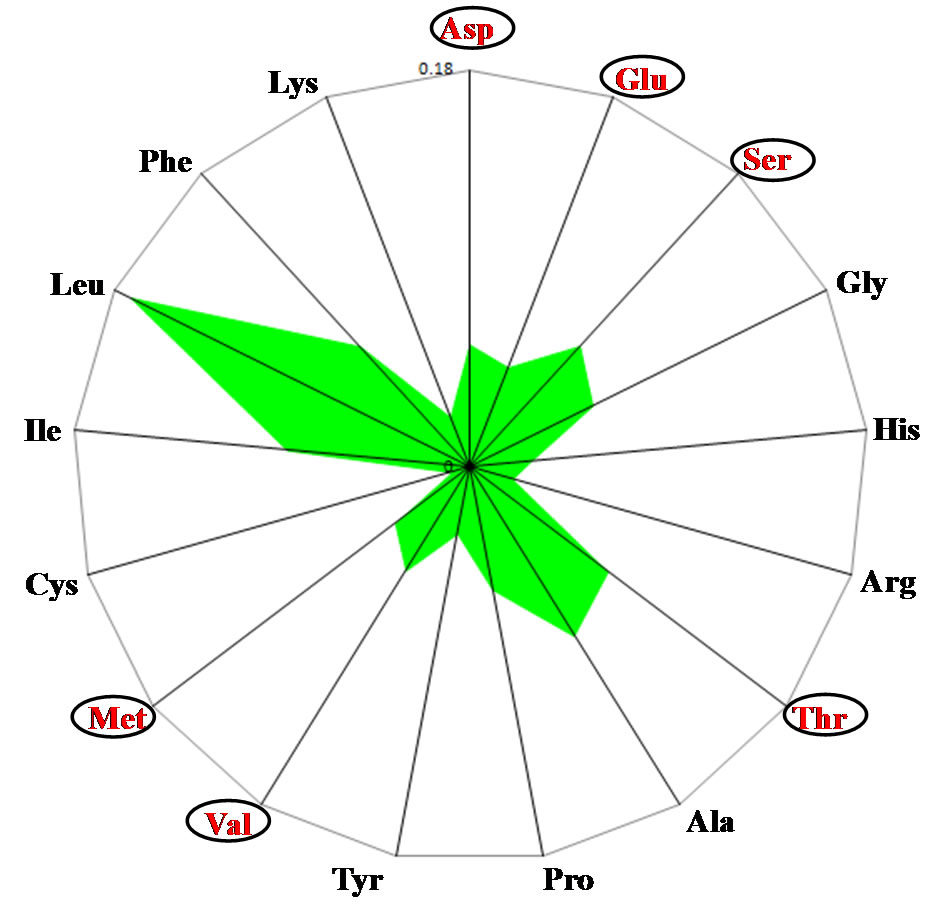 (b)
(b) (c)
(c)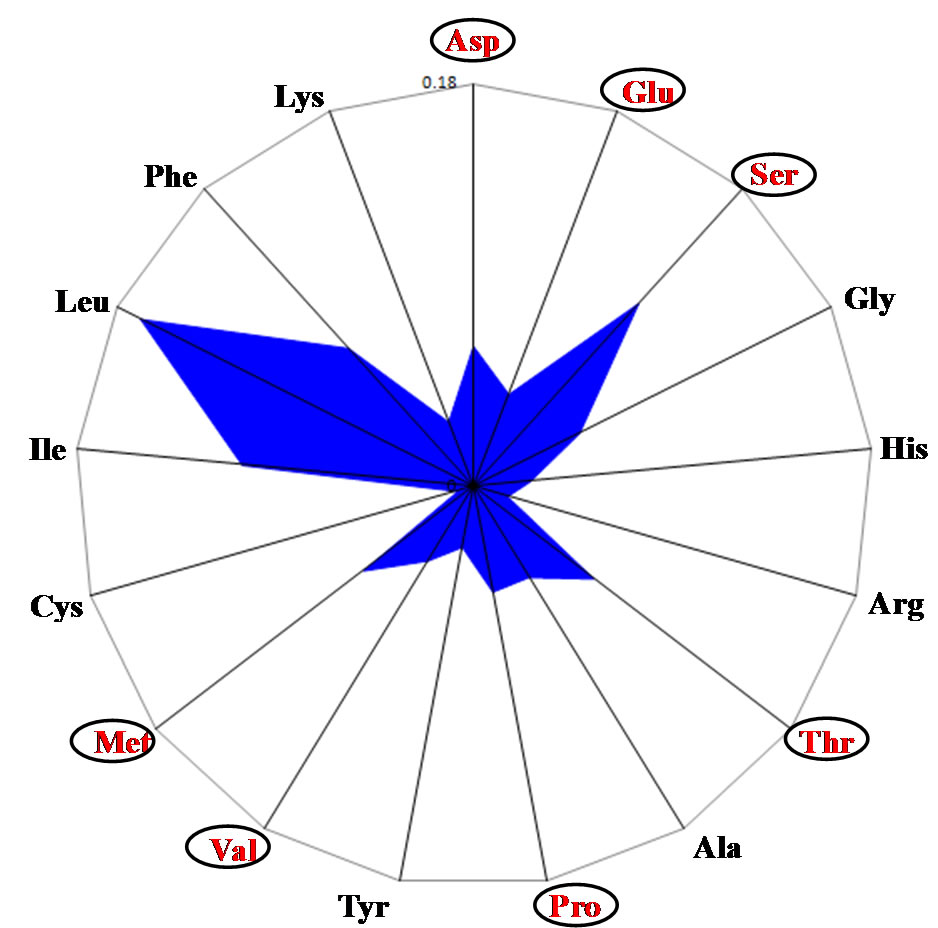 (d)
(d)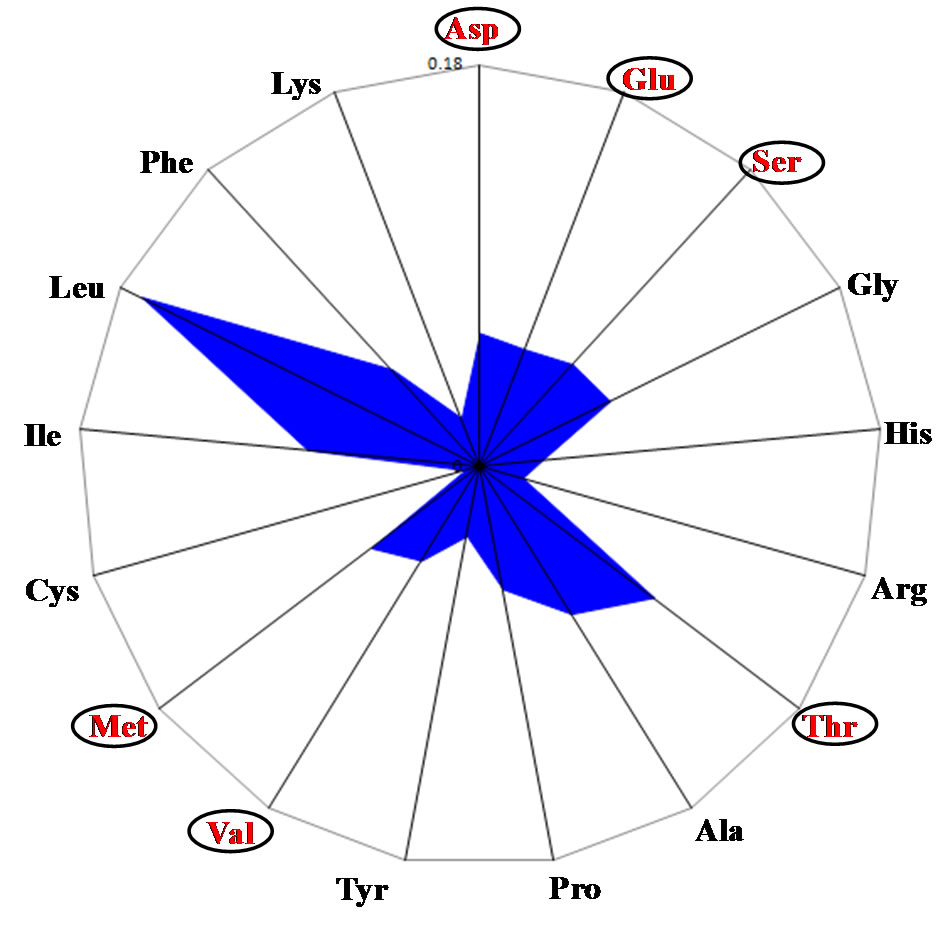 (e)
(e)
Figure 1. Radar charts of the predicted amino acid compositions of thirteen mitochondrial genes. Values are expressed as percentages of all the amino acids. (a) Homo sapiens; (b) Oryzias laptis; (c) Rana nitromaculata; (d) Latimeria chalumnae; (e) Eptatretus burgeri.
Met contents were significantly inverse compared with their content in human mitochondria. The relationships between the amino acid contents of human and bony fish (O. latipes) were used to represent the characteristics of terrestrial and aquatic vertebrates (Figure 2).
The black spotted pond frog (Rana nigromaculata), which is terrestrial as an adult and aquatic as a larva (tadpole) had an amino acid content pattern that was midway between the terrestrial and aquatic patterns (Figure 1(c)). Specifically, the relationship among the Asp, Glu and Ser contents in the frog mitochondria resembled that in the human mitochondria, while relationships between Thr and Ala contents, and between Val and Met contents resembled those in the bony fish mitochondria. However, the amino acid content of the African clawed frog (Xenopus laevis) mitochondrial genome
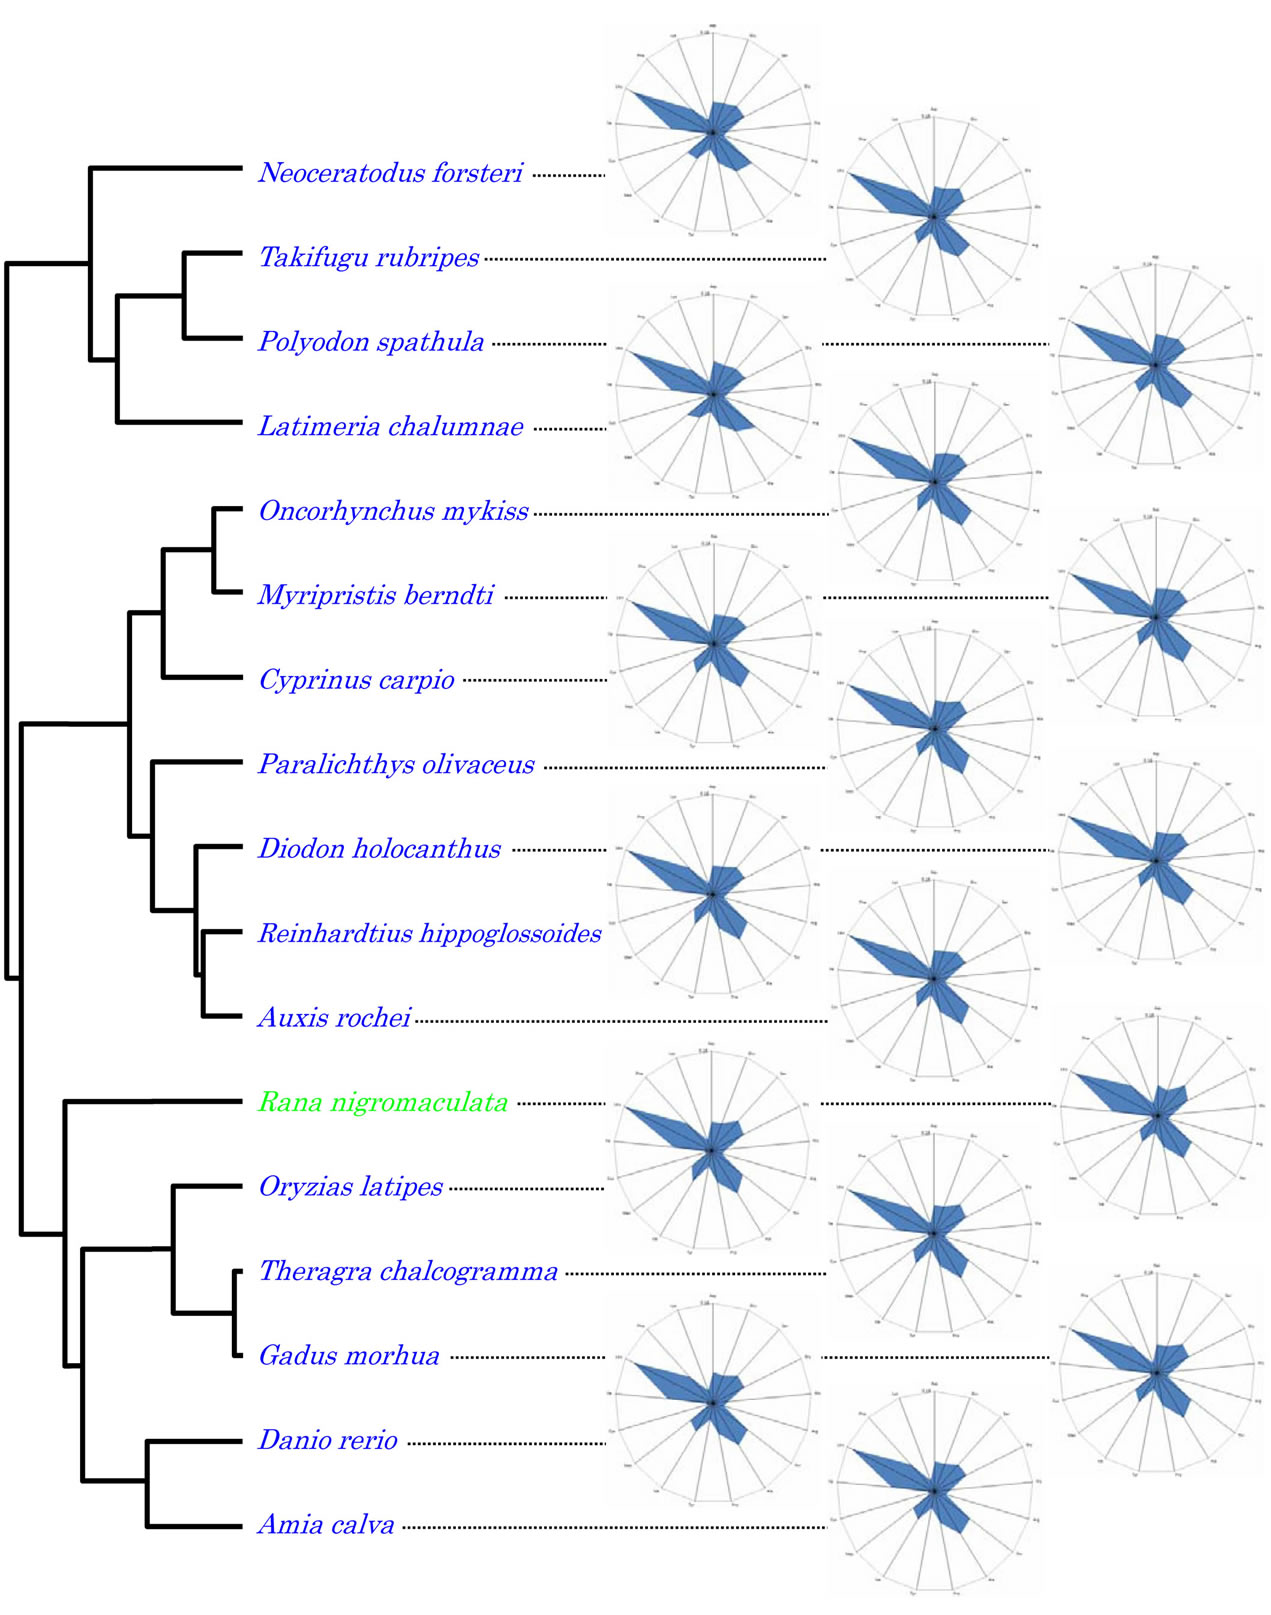
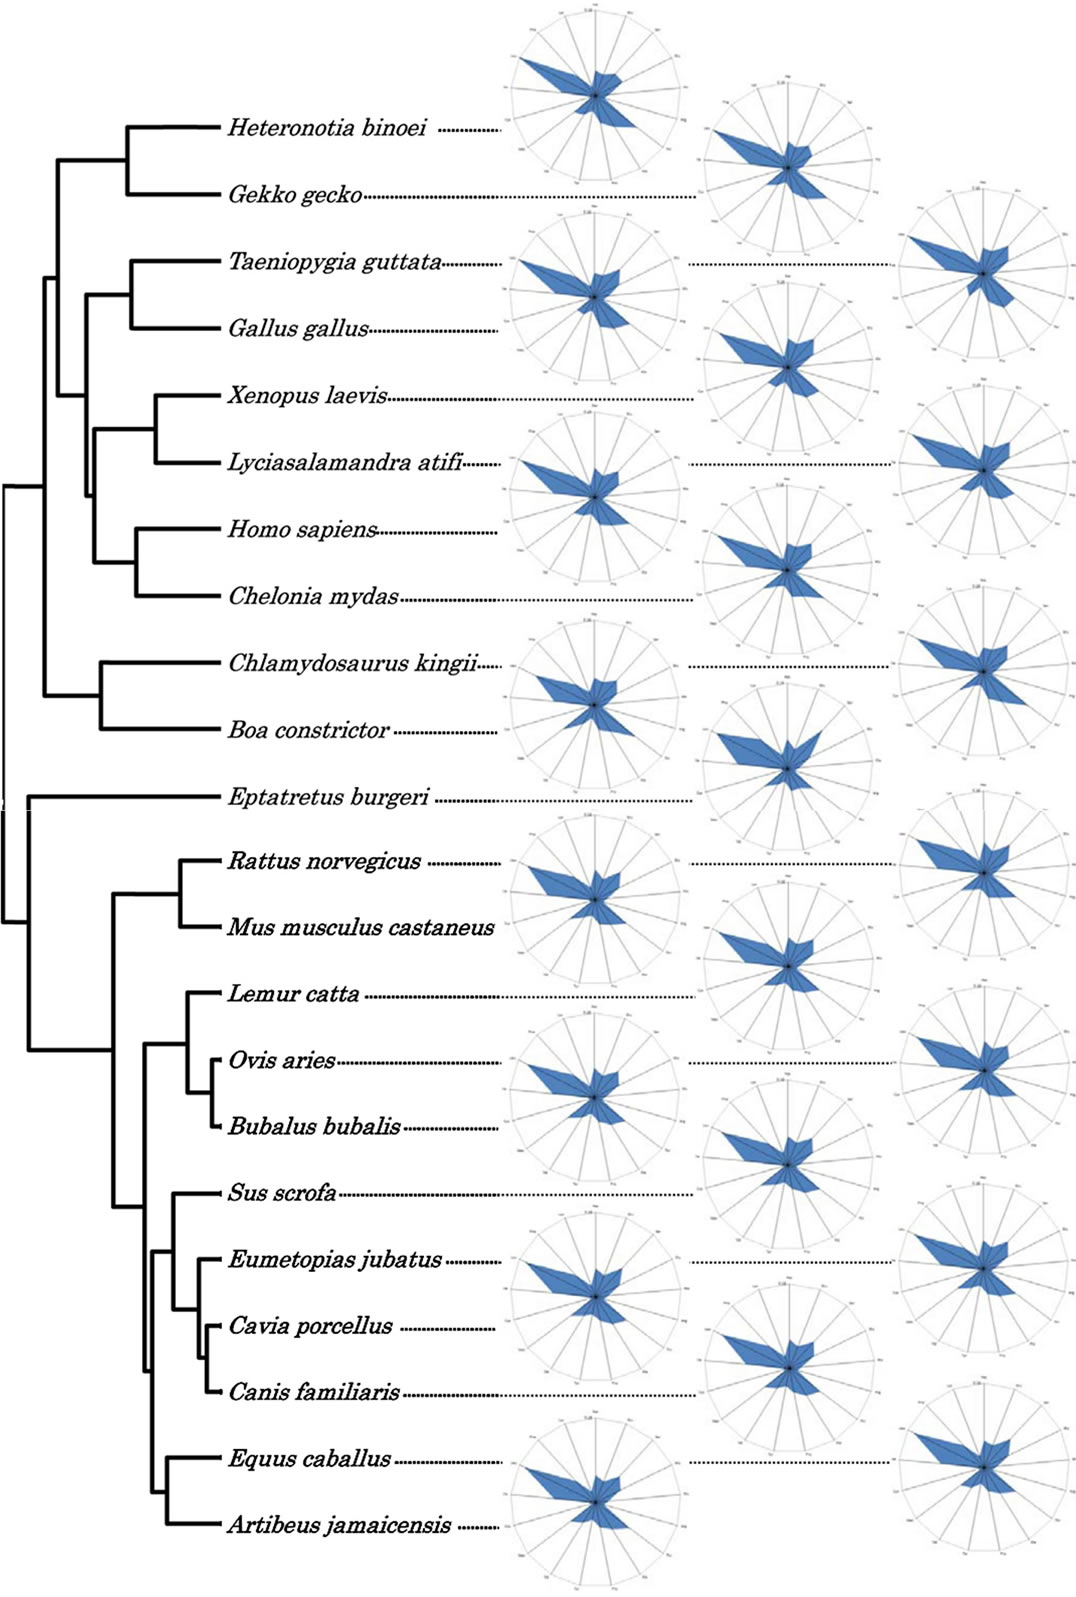
Figure 2. Dendrogram based on amino acid compositions of the coding regions of the vertebrate mitochondrial genomes.
matched that of the terrestrial group (Figure 2).
The coelacanth (Latimeria chalumnae) is thought of as a living fossil but the amino acid composition of the mitochondrial genome was similar to that of human mitochondria, although the Asp, Glu and Ser content pattern was intermediate between that of human and bony fish (Figure 1(d)).
Hagfish (Eptatretus burgeri) are thought to be the origin of vertebrates [17]. However, the amino acid composition of hagfish mitochondria differed from that of the human, bony fish, frog and coelacanth (Figure 1(e)).
The relationships among the amino acid contents of Asp, Glu and Ser, between Thr and Ala, and between Val and Met resembled the terrestrial vertebrate pattern. An exception was the high Pro content, which was a characteristic of the hagfish mitochondrial genome.
In previous studies [12,18], 12 eubacteria were classified into two groups, G type representing Staphylococcus aureus and E type representing Escherichia coli, based on their amino acid compositions [18]. Furthermore, other organisms including bacteria, archaea and eukaryotes were classified into two groups based on their codon patterns, GC-rich and AT-rich, by cluster analyses [12]. The G type and E type classification was confirmed by other computer analyses [19].
3.2. Cluster Analysis Based on Amino Acid Compositions
Using the amino acid composition as the trait, the vertebrates examined in this study were separated into two major clusters (Figure 3): the terrestrial vertebrate cluster represented by humans; and the aquatic vertebrate cluster represented by the bony fish (O. latipes). The exceptions were the hagfish (E. burgeri) that fell into the terrestrial vertebrate cluster and the black spotted frog (R. nigromaculata) that clustered with the aquatic vertebrates. The radar chart representing the amino acid composition of each organism from the cluster analyses is available in Figure 2. The coelacanth (L. chalumnae), Queensland lungfish (Neoceratodus forsteri), which is a living fossil and one of the oldest living vertebrate genera, and American paddlefish (Polyodon spathula), which is the oldest surviving animal species in North America, all belonged to an additional small cluster.
3.3. Cluster Analysis Based on Nucleotide Contents
Using the G, C, A and T content of the coding regions of the mitochondrial genomes as the trait for cluster

Figure 3. Dendrogram of vertebrates obtained from cluster analysis using the amino acid compositions of thirteen mitochondrial genes as traits. Green and blue characters represent terrestrial and aquatic vertebrates, respectively.
analyses, the vertebrates again separated into the two major clusters (Figure 4). Coelacanth (L. chalumnae), hagfish (E. burgeri) and zebrafish (Daino rerio) clustered with the terrestrial vertebrates, while black spotted frog (R. nigromaculata) and the water buffalo (Bubalus bubalis) clustered with the aquatic vertebrates.
In the non-coding regions of the mitochondrial genomes, some of the terrestrial vertebrates clustered with the major aquatic group (Figure 5). The hagfish was grouped with the terrestrial vertebrates, while the stellar sea lion (Eumetopias jubatus) was in the aquatic group. However, the cluster analyses for the non-coding regions showed that the clustering was not random, indicating that evolution of the non-coding regions was also controlled.
Using the G, C, T and A content of the entire genome as the trait, two major clusters were formed (Figure 6). Hagfish (E. burgeri), coelacanth (L. chalumnae), Queensland lungfish (Neoceratodus forsteri), carp (Cyprinus carpio) and zebrafish (D. rerio) all clustered with the main terrestrial group while black spotted frog (R. nigromaculata) clustered with the main aquatic group. In this analysis, the three most ancient kinds of fish (hagfish, coelacanth, and Queensland lungfish) robustly clustered with the terrestrial group.
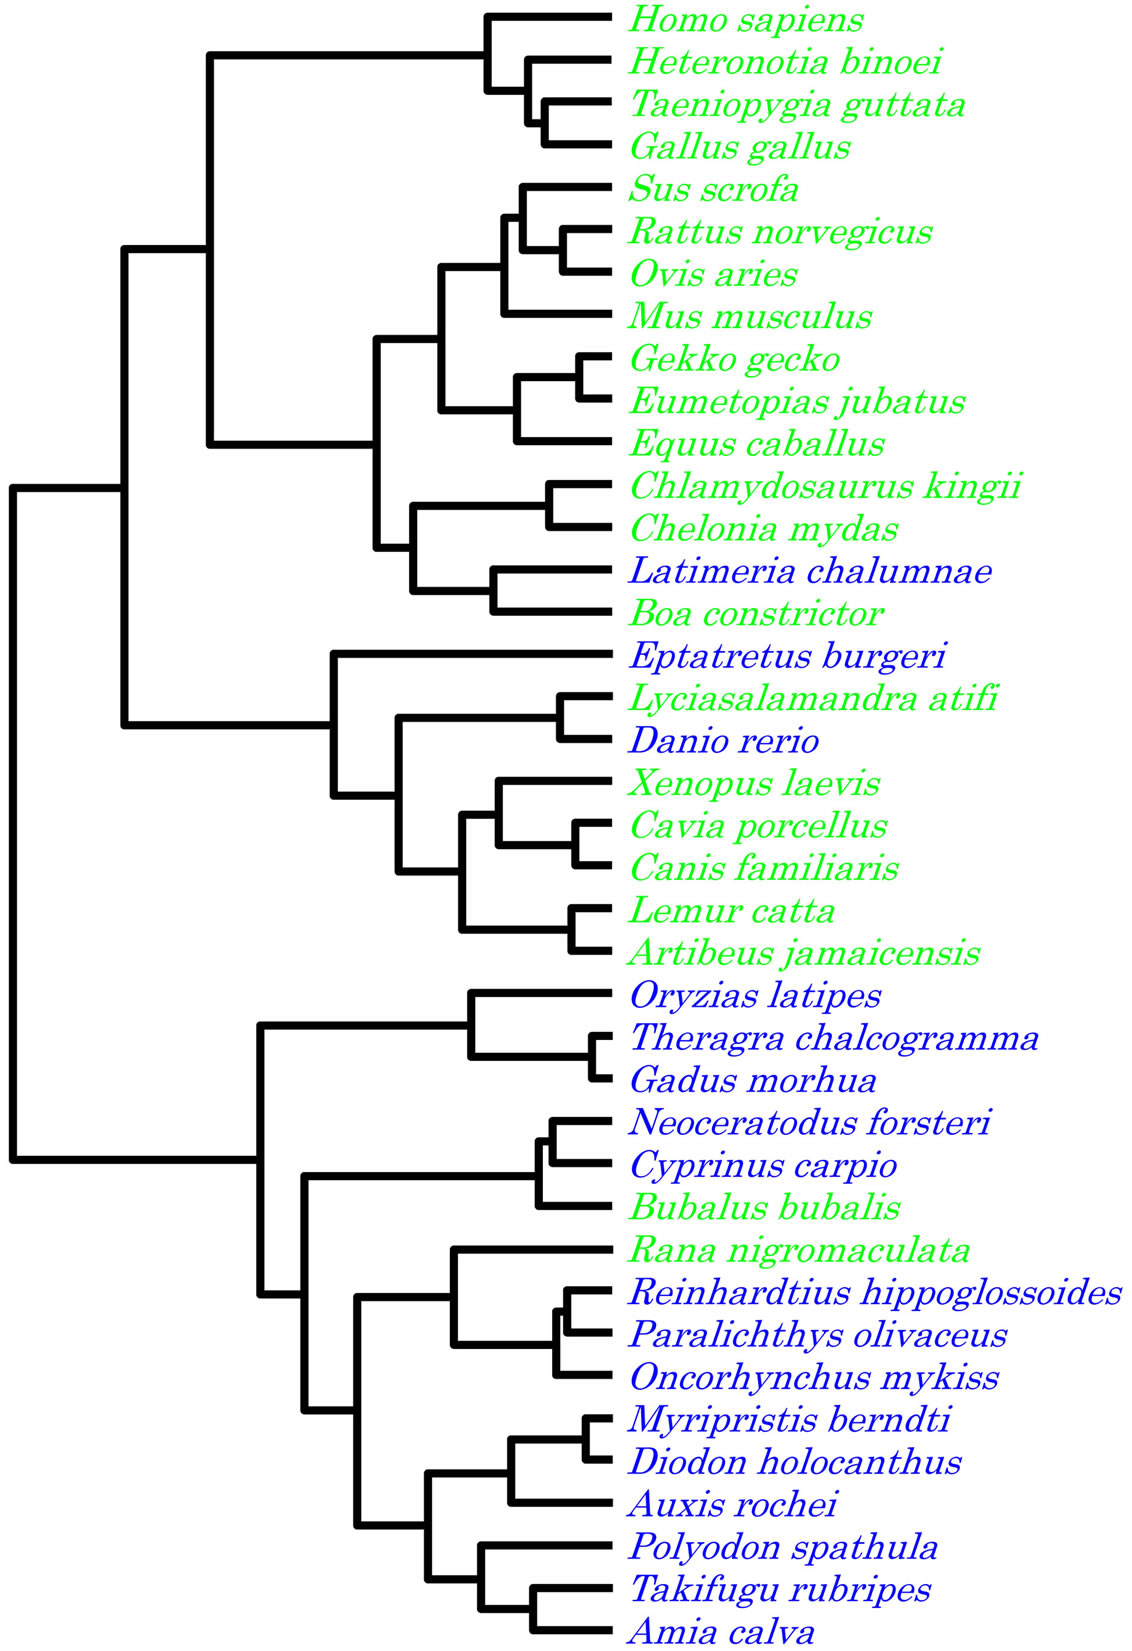
Figure 4. Dendrogram based on the nucleotide contents of the vertebrate mitochondrial coding regions.
3.4. Phylogenetic Tree Based on 16S rRNA Sequences
A consistent result was obtained by the Neighbourjoining method [14] using 16S rRNA sequences, as shown in Figure 7. Vertebrates were separated into two major clusters, terrestrial and aquatic, although the hagfish was incorporated into the cluster of the terrestrial vertebrates.
4. DISCUSSION
Using the nucleotide contents as traits, the vertebrates in the sample were classified into two major clusters, terrestrial and aquatic; however, some exceptions were observed (Figures 2-7). These results indicated that alternations in nucleotide content were controlled by internal biases that, in the cluster analyses, resulted in the formation of several clusters. Because nucleotide alternations are strictly governed by linear formulae in both the coding and non-coding regions [11], the codon usage pattern of an organism can be estimated by the insertion of its nucleotide content into a specific linear formula [9]. If the nucleotide alternations had occurred at random in the genomes of the selected organisms, such a clear
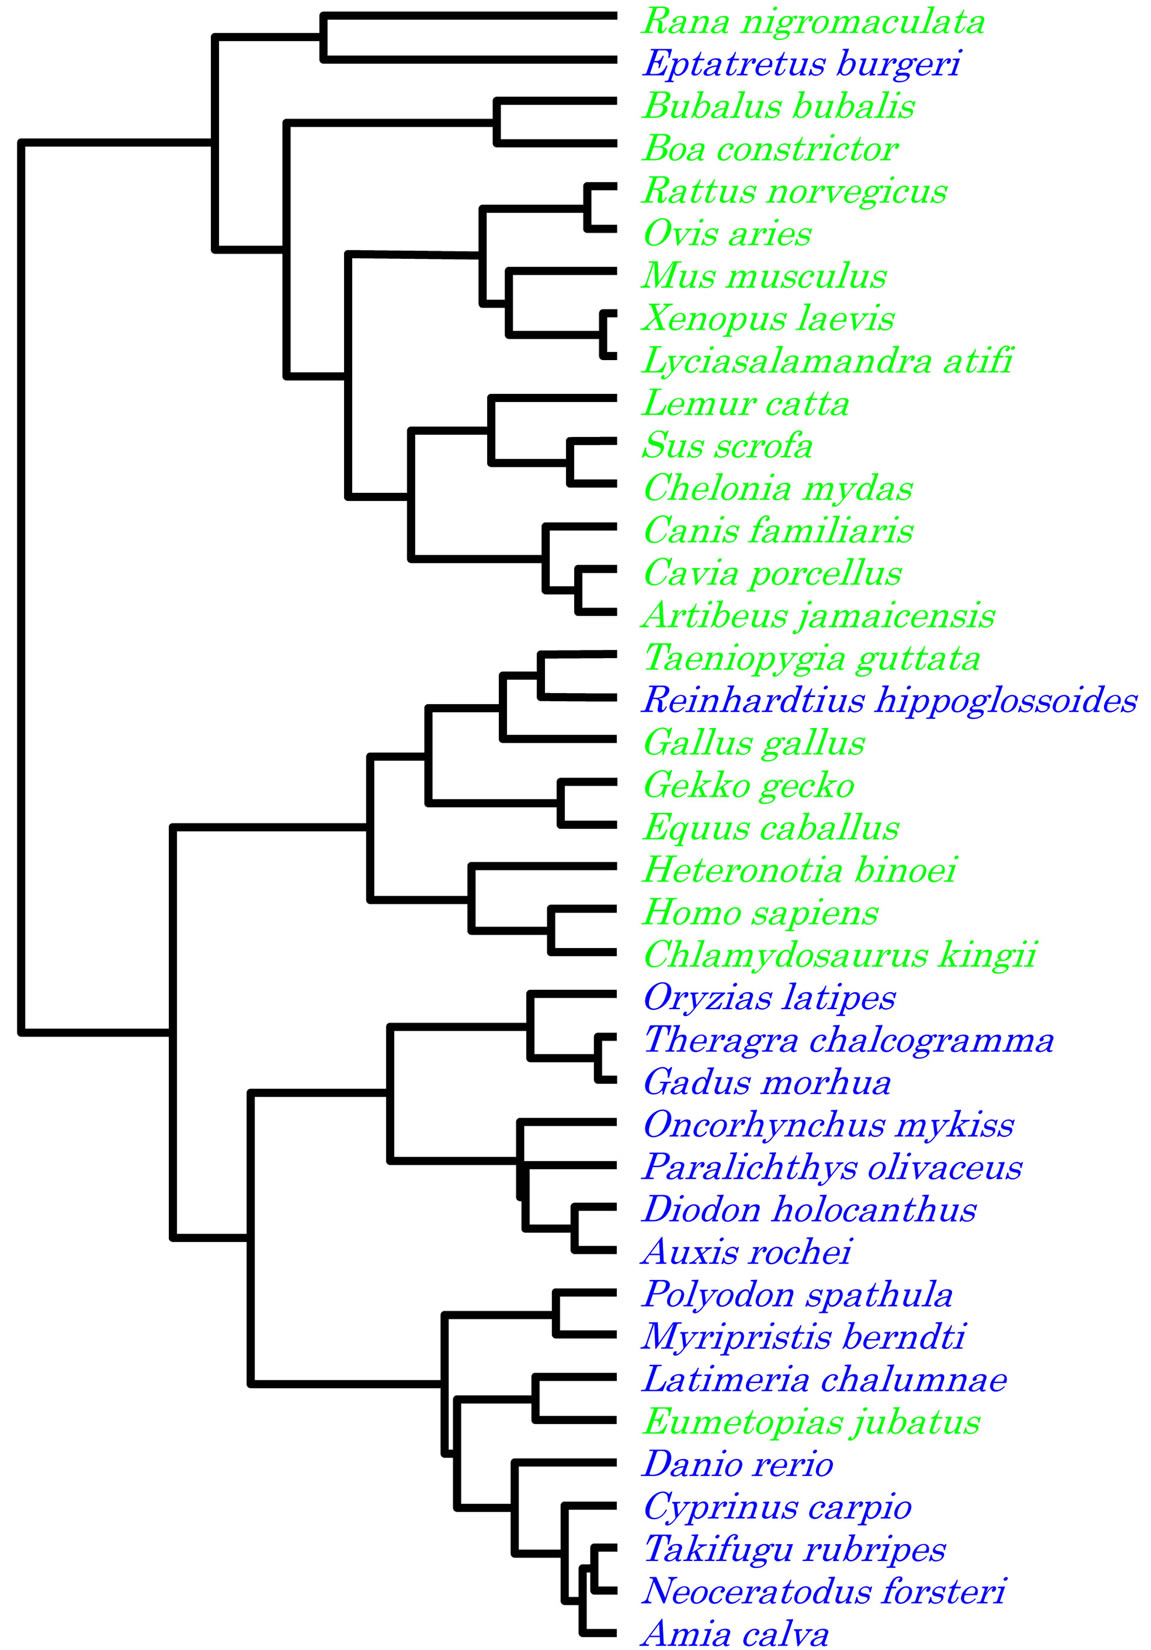
Figure 5. Dendrogram based on the nucleotide contents of the vertebrate mitochondrial non-coding regions.
separation between the terrestrial and aquatic vertebrates might not have been observed in the cluster analyses. Using amino acid content, the vertebrates in the sample were similarly classified into two major clusters, terrestrial and aquatic. The exceptions were the hagfish (E. burgeri) and the frog (R. nigromaculata) that clustered with the terrestrial and aquatic vertebrates, respectively (Figures 2-7). In the cluster analyses using the amino acid compositions at traits, the decrease in the number of exceptions might be because of the inclusion of phenotype expressions that were reflected in the amino acid composition [3]. Nevertheless, the clear separation of the two clusters representing the terrestrial and aquatic vertebrates indicates that both internal and external biases have contributed to codon evolution in the selected organisms.
Although the frog (R. nigromaculata) was consistently grouped with the aquatic vertebrates, this may reflect the conservation of tadpole characteristics after metamorphosis. The clustering of the hagfish (E. burgeri) with the terrestrial vertebrates may reflect the controversy over the classification of this fish [17]. In a previous study [20], the nucleotide content of the hagfish (E. burgeri) mitochondria was found to fit the vertebrate regression
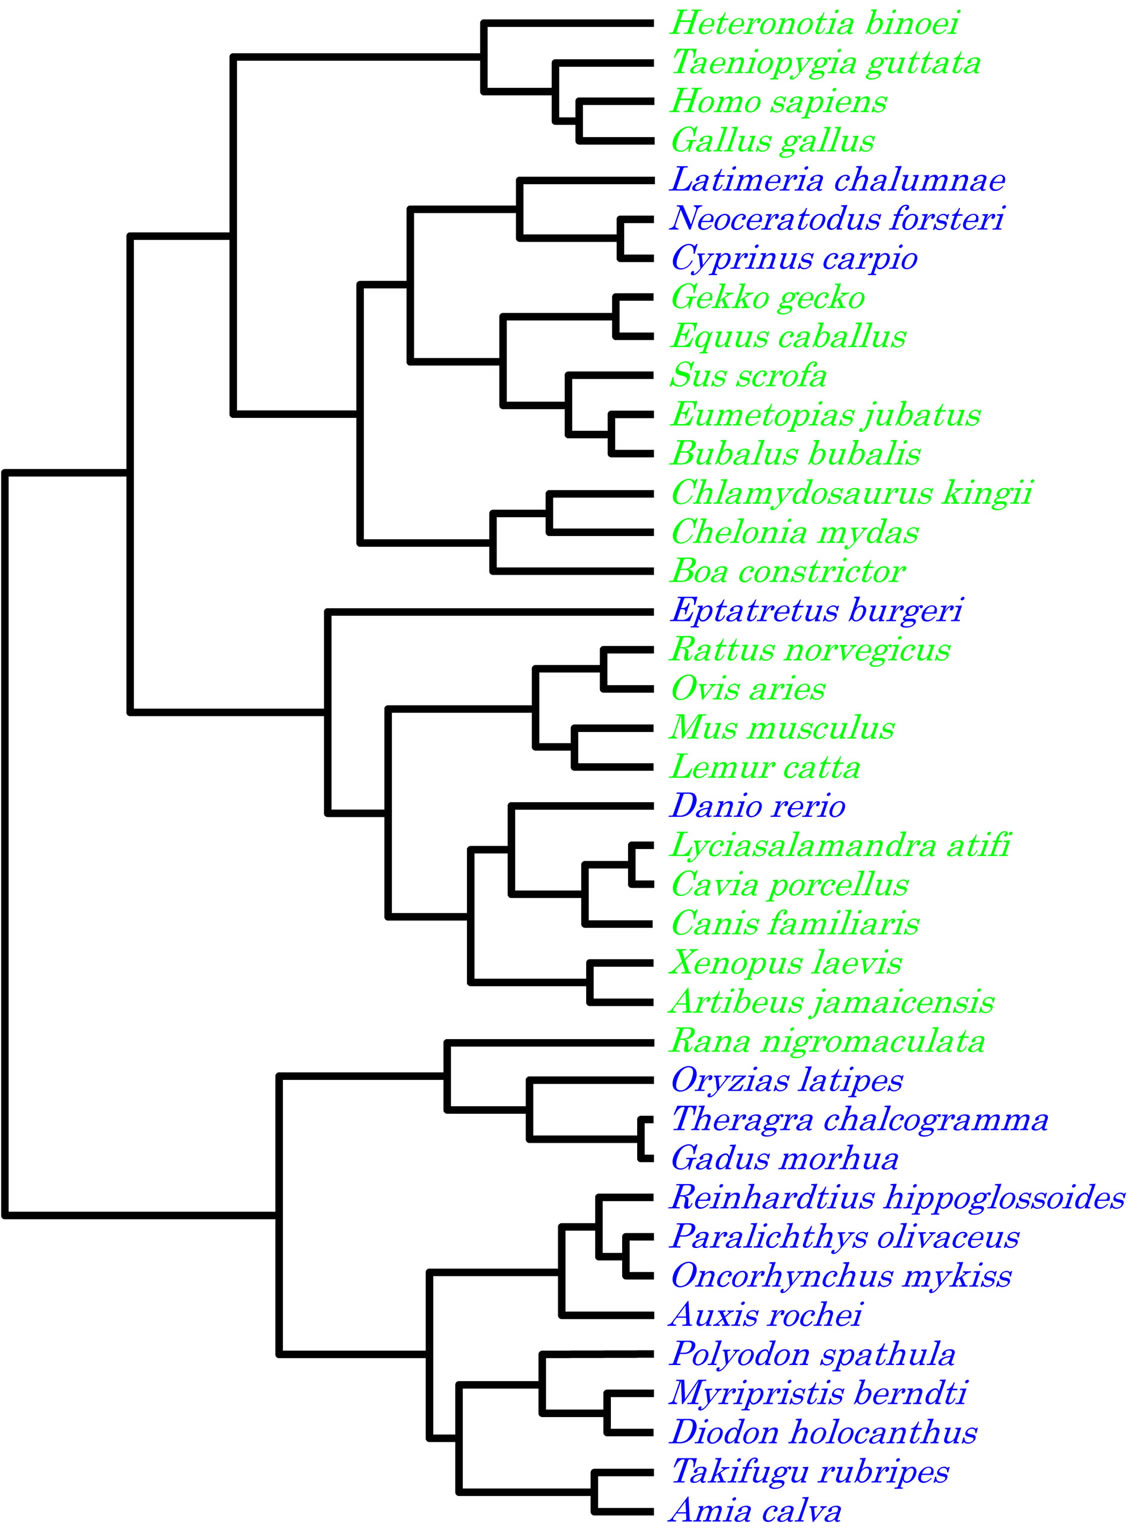
Figure 6. Dendrogram based on the nucleotide contents of the vertebrate complete mitochondrial genomes.
line better than the invertebrate regression line, and the vertebrate mitochondria diverged from the same origin of invertebrate mitochondria. If the hagfish truly belongs to the terrestrial group it suggests that hagfish still possess some primitive vertebrate mitochondrial characteristics that were present before its evolution. Terrestrial and aquatic vertebrates have evolved independently, and vertebrate evolution under natural selection has occurred based on both nucleotide alternation rules and on biosphere biases. In this study, the vertebrates were classified completely into the terrestrial and aquatic groups indicating that the barriers between these two biospheres have been definitive for vertebrate evolution. Because the mitochondrial function is not linked directly with either the genomic rules or with the biospheres, the present findings reflect vertebrate evolution itself.
5. CONCLUSION
Vertebrates were classified into two clusters, terrestrial and aquatic vertebrates, in the phylogenetic trees based on the amino acid content predicted from the complete mitochondrial genomes, nucleotide content of the complete mitochondrial genomes and 16s rRNA sequence homologies, with some exceptions. The hagfish (Eptatretus burgeri), which is thought to be an early vertebrate,
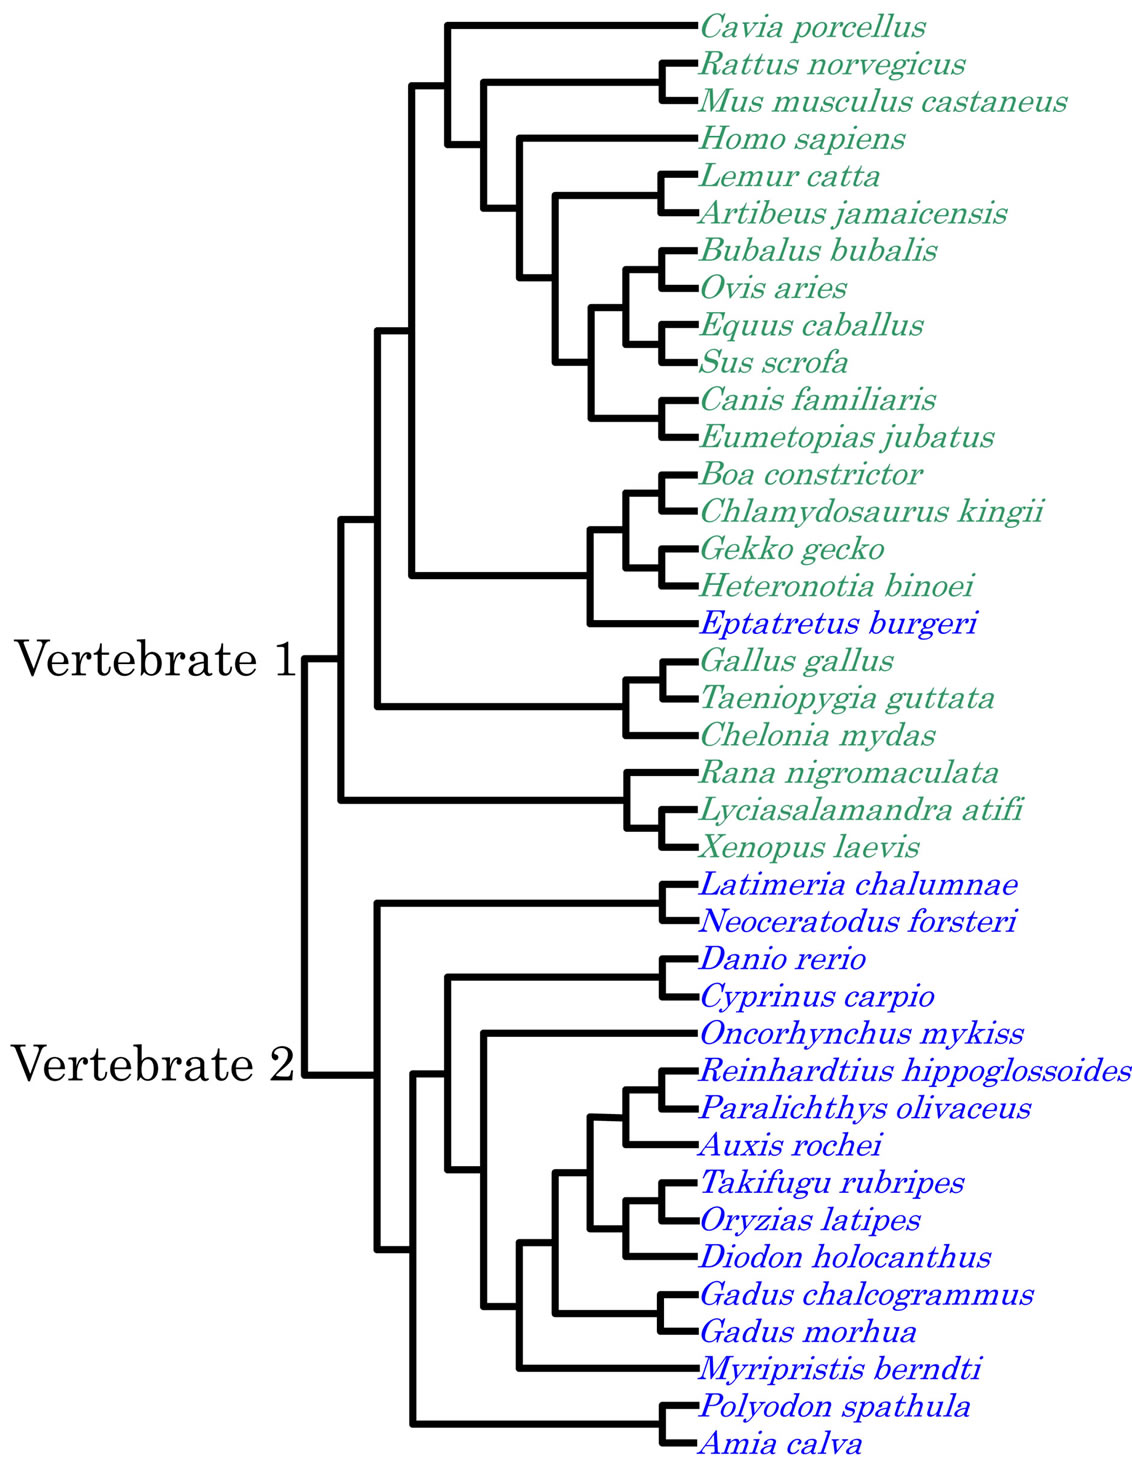
Figure 7. Phylogenetic tree of 16S rRNA. The parameters used for multiple alignments: Gap open penalty; 15, gap extension penalty; 6.66, gap distance; 8, max div.; 40.
falls into the terrestrial group. Thus, vertebrate evolution is controlled by natural selection under both an internal bias as a result of nucleotide replacement rules, and an external bias caused by environmental biospheric conditions.
REFERENCES
- Cobbett, A., Wilkinson, M. and Wills, M. (2007) Fossils impact as hard as living taxa in parsimony analyses of morphology. Systems Biology, 17, 753-766. doi:10.1080/10635150701627296
- Zuckerkandl, E. and Pauling, L.B. (1962) Molecular disease, evolution, and genetic heterogeneity. In: Kasha, M. and Pullman, B., Eds., Horizons in Biochemistry, Academic Press, New York, 189-225.
- Sorimachi, K. (1999) Evolutionary changes reflected by the cellular amino acid composition. Amino Acids, 17, 207-226. doi:10.1007/BF01361883
- Fleischman, R.D., Adams, M.D., White, O., Clayton, R.A., Kirkness, E.F., Kerlavage, A.R., Bult, C.J., Tomb, J.F., Dougherty, B.A., Merrick, J.M., et al. (1995) Wholegenome random sequencing and assembly of Haemophilus influenzae Rd. Science, 269, 496-512. doi:10.1126/science.7542800
- Lander, E.S., Linton, L.M., Birren, B., Nusbaum, C., Zody, M.C., Baldwin, J., Devon, K., Dewar, K., Doyle, M., FitzHugh, W., et al. (2001) Initial sequencing and analysis of the human genome. Nature, 409, 860-921. doi:10.1038/35057062
- Venter, J.C., Adams, M.D., Myers, E.W., Li, P.W., Mural, R.J., Sutton, G.G., Sutton, G.G., Smith, H.O., Yandell, M., Evans, C.A., et al. (2001) The sequence of the human genome. Science, 291, 1304-1351. doi:10.1126/science.1058040
- Sorimachi, K. and Okayasu, T. (2003) Gene assembly consisting of small units with similar amino acid composition in the Saccharomyces cerevisiae genome. Mycoscience, 44, 415-417. doi:10.1007/s10267-003-0131-2
- Sorimachi, K., Itoh, T., Kawarabayasi, Y., Okayasu, T., Akimoto, K. and Niwa, A. (2001) Conservation of the basic pattern of cellular amino acid composition of archaeobacteria during biological evolution and the putative amino acid composition of primitive life forms. Amino Acids, 21, 393-399. doi:10.1007/s007260170004
- Sorimachi, K. and Okayasu, T. (2008) Codon evolution is governed by linear formulas. Amino Acids, 34, 661-668. doi:10.1007/s00726-007-0024-3
- Rudner, R., Karkas, J.D. and Chargaff, E. (1968) Separation of B. subtilis DNA into complementary strands. 3. Direct analysis. Proceedings of the National Academy of Sciences, 60, 921-922. doi:10.1073/pnas.60.3.921
- Mitchell, D. and Bridge, R. (2006) A test of Chargaff’s second rule. Biochemical and Biophysical Research Communications, 340, 90-94. doi:10.1016/j.bbrc.2005.11.160
- Okayasu, T. and Sorimachi, K. (2009) Organisms can essentially be classified according to two codon patterns. Amino Acids, 36, 261-271. doi:10.1007/s00726-008-0059-0
- Sorimachi, K. and Okayasu, T. (2008) Universal rules governing genome evolution expressed by linear formulas. The Open Genomics Journal, 1, 33-43.
- Saitou, N. and Nei, M. (1987) The neighbor-joining method: A new method for reconstructing phylogenetic trees. Molecular Biology and Evolution, 4, 406-425.
- Woese, C.R. and Fox, G.E. (1977) Phylogenetic structure of the prokaryotic domain: The primary kingdoms 2. Proceedings of the National Academy of Sciences of the United States of America, 74, 5088-5090. doi:10.1073/pnas.74.11.5088
- Weisburg, W.G., Barns, S.M., Pelletier, D.A. and Lane, D.J. (1991) 16S ribosomal DNA amplification for phylogenetic study. Journal of Bacteriology, 173, 697-703.
- Janvier, P. (2010) Micro RNAS revive old views about jawless vertebrate divergence and evolution. Proceedings of the National Academy of Sciences of the United States of America, 107, 19137-19138. doi:10.1073/pnas.1014583107
- Sorimachi, K. and Okayasu, T. (2004) Classification of eubacteria based on their complete genome: Where does Mycoplasmataseae belong? Proceedings of the Royal Society B, 271, s127-s130. doi:10.1098/rsbl.2003.0141
- Qi, Z.H. and Wei, R.Y. (2011) A combination dimensionality reduction approach to codon position patterns of eubacteria based on their complete genomes. Journal of Theoretical Biology, 272, 26-34. doi:10.1016/j.jtbi.2010.12.014
- Sorimachi, K., Okayasu, T., Ohhira, S., Fukasawa, I. and Masawa, N. (2012) Evidence for the independent divergence of vertebrate and high C/G ratio invertebrate mitochondria from the same origin. The Natural Science, 4, 479-483. doi:10.4236/ns.2012.47064