Health
Vol.5 No.4(2013), Article ID:29882,9 pages DOI:10.4236/health.2013.54093
Comparison of price, volume and composition of services provided to inpatients for two procedures between a US and a Japanese academic hospital
![]()
1Department of Health Policy and Management, School of Medicine, Keio University, Tokyo, Japan; *Corresponding Author: inokuchi.tsuyoshi@gmail.com
2School of Medicine, Johns Hopkins University, Baltimore, USA
3Department of Health Policy and Management and Department of International Health, Johns Hopkins Bloomberg School of Public Health, Baltimore, USA
Copyright © 2013 Tsuyoshi Inokuchi et al. This is an open access article distributed under the Creative Commons Attribution License, which permits unrestricted use, distribution, and reproduction in any medium, provided the original work is properly cited.
Received 2 March 2013; revised 31 March 2013; accepted 9 April 2013
Keywords: Health Expenditures; United States; Japan; Percutaneous Coronary Intervention; Heart Valve Replacement
ABSTRACT
Background: To drill down into why per capita health expenditures vary between the US and Japan, this exploratory study compares the price, volume and composition of services provided to inpatients for two procedures in an academic hospital in the US, and one in Japan. Methods: Detailed analysis of the amount reimbursed and services delivered was made from claims data for 449 acute myocardial infarction treated with coronary stents placed by percutaneous coronary intervention (PCI) and 115 heart valve dysfunction with heart valve replacement (HVR) cases in Johns Hopkins Hospital (JHH) Baltimore, Maryland, and 34 PCI and 21 HVR cases in Keio University Hospital (KUH), Tokyo. Results: After making appropriate adjustments, the reimbursed amount per discharge at JHH was significantly higher (Wilcoxon ranksum test, p < 0.01) for both medical conditions. This was due to more use of higher priced technology and higher prices for the same technology at JHH compared with KUH. However, medical imaging was performed more frequently at KUH and the reimbursed amounts per unit for the devices were higher at KUH. Analysis of room and board costs showed that the higher staffing level and wages of nurses at JHH was compensated by its shorter average length of stay for PCI, but not for HVR. Conclusion: Detailed analysis of the reimbursed amount and the utilization of services are needed to understand international variations in healthcare spending.
1. INTRODUCTION
The Organization for Economic Cooperation and Development (OECD) data show that there is considerable variation in the level of per capita total health expenditures among its member countries [1]. However, the complex mechanisms involved have not been fully explained. Past studies show it is relatively easy to compare spending levels for the same products. The United States pays higher prices for brand name drugs, but often lower prices for generic drugs than most other developed countries [2,3].
However it is more difficult to compare hospitals and physician services since the products are not identical. One innovative approach used by the Health BASKET project compared diagnostic related group (DRG) systems in nine European Union (EU) member states using 10-case vignettes and questionnaires regarding the cost and services that patients would have received [4-12]. One research compared Japanese and American teaching hospitals by the mean and median of total cost actually incurred for several diseases [13]. Another showed costs incurred for treating acute myocardial infarction (AMI) patients by cost categories such as radiology, laboratory, drugs etc. at US and Germany hospitals. Their objective was to develop a method to adjust for the baseline differences in the patient groups of the two countries [14].
In contrast, our study focuses on the service side of why spending differs between the United States and Japan for patients in similar case-mix groups. To what extent is the higher spending due to the use of higher priced technology, higher prices for the same technology or more intensive use? Based on existing studies, our initial hypotheses are that all three would be greater in the US [15-17]. For this purpose, we drilled down into the reimbursed amounts for each unit of health care services which was a methodological challenge requiring a crosswalk between different reimbursement systems. We analyzed the amount reimbursed by payers, not the costs incurred by health care providers, because our interests lay in the level of spending in the health care system, and not on how efficiently resources are utilized in hospitals.
We chose to compare percutaneous coronary intervention (PCI) with coronary stents for AMI, and heart valve replacement (HVR) for heart valve dysfunction. We used the payers’ case-mix grouping systems to cluster patients undergoing these procedures and then imposed strict selection criteria in order to make the two patient groups as comparable and homogenous as possible. We chose these two procedures for the following reasons: they are relatively common and relatively expensive to treat; there is a generally accepted treatment protocol; a large part of spending for each episode occurs during the initial hospital admission; the variance in the reimbursed amount and treatment patterns within each hospital was expected to be relatively small; and both conditions are likely to use high-technology equipment. We also focus on only two hospitals—the Johns Hopkins Hospital (JHH) in Baltimore, Maryland and Keio University Hospital (KUH) in Tokyo, Japan. They were chosen because they are perceived as high quality academic medical centers.
This is an exploratory study and there is no intention to generalize to other conditions at these two hospitals, to all academic medical center hospitals in either country or to all hospitals in the country. There is also no attempt to compare the quality of care provided, the patient satisfaction, or access to care.
2. METHODS
2.1. Subjects
The Johns Hopkins Hospital (JHH) in Baltimore, Maryland has 924 patient beds and averages 764 inpatients per day and Keio University Hospital (KUH) in Tokyo, Japan has 1059 patient beds and averages 867 inpatients per day. They are similar in size, reputation, teaching status, nonprofit ownership and urban location. We combined hospital and physician services because Japanese payment system does not bill separately for physician services. The study was submitted to the Institutional Review Board (IRB) of the Johns Hopkins Bloomberg School of Public Health which concluded that it did not warrant further IRB review. In Japan, the government guidelines state that consent is not required to undertake clinical epidemiological studies if all patient identifiers are removed.
Both hospitals used case-mix based grouping systems for inpatient care: Medicare Severity-Diagnosis Related Group (MS-DRG) at JHH and Diagnosis Procedure Combination (DPC) at KUH. Because each grouping system has been developed to reimburse similar amounts for cases in each group, it is ideal if we can have a one-to-one match of the MS-DRG groups with the DPC groups. However, although the algorithm for grouping is basically the same, there are several differences between the two grouping system and it was not possible to make exact matches. Therefore, we chose the DRG and DPC groups that were as similar as possible and then applied additional selection criteria to them to make them more similar. Our basic strategy was to exclude any cases that had a separate group in either the MS-DRG or DPC grouping as this would mean they would have a higher rate of reimbursement.
For PCI at JHH, as the initial inclusion criteria, we took patients who had a code of 246 - 249 (PCI with drug-eluting or non-drug-eluting stent) in MS-DRG at JHH. We used corresponding codes of “050030XX03- X0XX”-“050030XX03X4XX” (AMI with PCI) in DPC at KUH. From these two samples, based on our basic strategy mentioned above, we excluded patients who had four or more coronary stents placement and who had used nuclear medicine diagnostic equipment. There was a separate subcategory in the DPC if a tissue plasminogen activator was provided, but none of the patients received this treatment in the two hospitals. For HVR, as the initial inclusion criteria, we took patients with a code of 219 - 221 (Cardiac valve and other major cardiothoracic procedure without cardiac catheterization) in MSDRG at JHH and corresponding codes of “050080XX 02X0XX”-“050080XX02X4XX” (Heart valve dysfunction with HVR) in DPC at KUH. From both hospitals, we excluded patients who had aortic root replacement and multiple heart valve replacement for the same reason we excluded some PCI cases. For both PCI and HVR, patients who had received intra-aorta balloon pump, dialysis and abdominal or pelvic surgery were also excluded.
We excluded people under 18 years old and people who died before discharge or left against medical advice. In addition, cases at JHH who lack the entire physician fee data, and whose hospital or physician fee data was inconsistent with their DRG codes were also excluded.
MS-DRG places patients with complications/comorbid conditions into different groups but DPC usually does not do so, and when it does, the conditions differ from that of the MS-DRG. Since we could not obtain additional data from medical records to pursue the issue of complications/comorbid conditions, we could not adjust for these differences.
2.2. Data Preparation for Analysis
We received data on all inpatients admitted between April 2009 to March 2010 that met the inclusion and exclusion criteria. Detailed utilization and accounting information including both hospital and physician payment for each admission was obtained from administrative data after removing all patient identifiers.
Maryland hospitals are unique in the US in two aspects: the same rates are applied to all payers (including Medicare, Medicaid and self-pay patients) and payment is made based on itemized unit rates, not by per case payment system. Although the latter is constrained so that amount stays within the range set by the case-mix adjusted using DRG, because hospitals closely monitor their charge per case, rewards and penalties at the end of each fiscal year are usually very small [18]. Because of these characteristics, we can disaggregate the reimbursed amounts for hospital services into itemized level. Additional adjustments were made to reflect contractual allowances, payer denials and bad debts. According to data obtained from JHH, these factors resulted in discounts of 9.2% for PCI and 5.6% for HVR cases than the amount set by the Health Services Cost Review Commission. Therefore, we reduced the amount charged by 9.2% or 5.6% to estimate the reimbursed amount.
For physician services, we used the amounts charged and the amounts reimbursed for PCI and HVR at JHH. We reduced the amounts charged by 58.7% for PCI and 59.7% for HVR to reflect the average discounts given to insurance plans. We then added the physician and hospital services together to obtain the combined reimbursed amount for each discharge.
In Japan, reimbursement rates are set by the Japanese government’s fee schedule to virtually all hospitals. For inpatient care at KUH, reimbursement is divided into two parts: the per-case inclusive payment part and the feefor-service part [19]. The former is determined by the DPC case-mix index and is adjusted at KUH by the hospital’s specific coefficient which increases this index by 24%. Hospitals paid by the DPC must submit a detailed item-by-item list of the services, drugs and material provided for each patient. We increased the fee schedule’s rate for each item that was delivered to the patient by 24% to reflect the amount reimbursed. For the fee-forservice part, such as surgical operations and devices (stents, catheters, mechanical valves, etc.), we used the amount as listed in the fee schedule. Next, the total amount for both parts was reduced by 0.3% because this is the average percentage denied by insurance plans for inpatient care at KUH. We did not add the extra charges for rooms with better amenities which are not covered by public insurance which amounts to 5% of inpatient revenue. Physician fees are included in the reimbursed amount.
In both hospitals, we grouped the itemized amounts reimbursed into eleven categories: room and board, procedure, medication, devices, medical imaging, laboratory test, physiological test, general anesthesia, physical medicine, blood transfusion, and miscellaneous. For some categories we made additional breakdowns where there were significant differences in the contents.
We also collected hospital level data to better understand the difference in the average amount reimbursed for room and board. Data for JHH was obtained from the Medicare cost report of 2009 and data for KUH was obtained from internal administrative data.
We used purchasing power parity (PPP) for currency conversion from Japanese Yen (JPY) amount at KUH to US dollars (USD). The PPP rate of 1 USD = 115.19 JPY was used for 2009 and 1 USD = 111.45 JPY was used for 2010.
2.3. Statistical Analysis
P values for the difference of the ratio of binomial outcome were calculated using chi-square test. Other P values were calculated using Wilcoxon rank-sum test because the data were not expected to distribute normally and generalized linear models could not be used. Data was analyzed using Stata Statistical Software: Release 11 (StataCorp, College Station, TX, 2009).
3. RESULTS
3.1. Sample Selection
Figure 1 shows the selection process of our sample. JHH admitted 664 PCI cases that met the initial inclusion criteria and, after exclusion, 449 cases were analyzed. KUH admitted 50 PCI cases that met the initial inclusion criteria and 34 cases were analyzed. JHH admitted 314 heart valve dysfunction cases that met the initial inclusion criteria and 115 cases were analyzed. KUH admitted 26 cases that met the initial inclusion criteria and 21 cases were analyzed.
Among cases at JHH, 65 PCI cases and 29 HVR cases were excluded because of physician fee data availability. There were no statistically significant differences in the reimbursed amount for hospital services in the total (p > 0.05) and the eleven categories (p > 0.01) between the analyzed and the excluded cases (449 cases vs. 65 cases of PCI, 115 cases vs. 29 cases of HVR).
3.2. Demographic Characteristics
Table 1 shows demographic characteristics of PCI and HVR cases at the two hospitals. There was no significant difference in their age (p > 0.05). There was a smaller percentage of female PCI cases at KUH (p = 0.02), but the reimbursed amount per discharge did not differ significantly by sex (p > 0.05). Average length of stay was
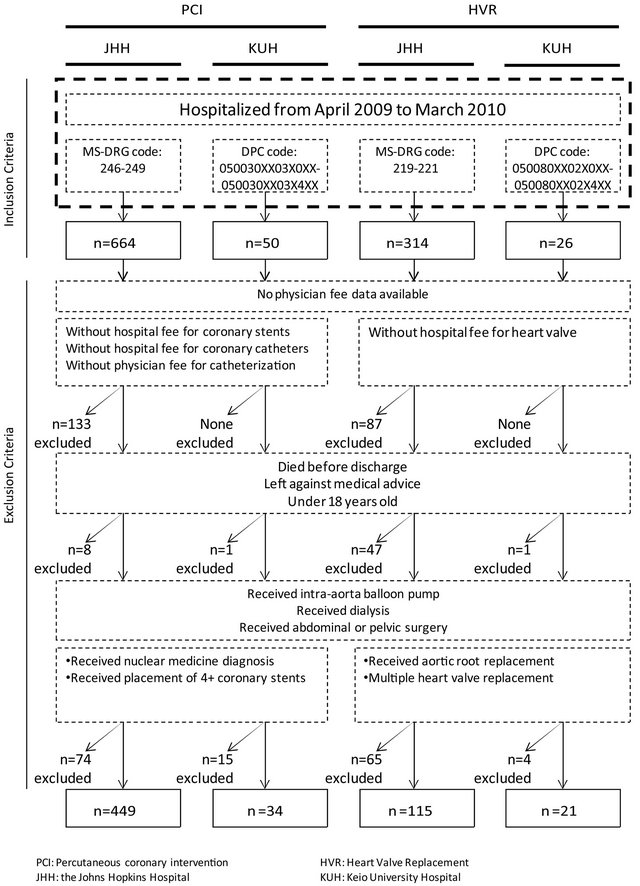
Figure 1. Sample selection process.
Table 1. Demographic and clinical characteristics of cases.

IQR: Interquartile Range; LOS: Length of Stay; FTE: Full-time Equivalent.
significantly longer at KUH, while the average registered nurses’ staff intensity per day was significantly higher at JHH for both conditions.
3.3. Reimbursed Amount per Discharge
Table 2 shows the reimbursed amount per discharge and their distribution in the eleven categories. The total reimbursed amount was significantly higher at JHH (p < 0.05). When broken down into categories, JHH’s reimbursed amounts were significantly higher than KUH’s in most categories for both of PCI and HVR groups. The only category in which the amount was significantly higher at KUH for both groups was devices. The difference in the categories of room and board and procedure accounted for more than 80% of the difference in the total reimbursed amount of both groups.
3.4. Service Utilization and the Reimbursed Amounts for Unit of Services
Table 3 shows the proportion of patients receiving
Table 2. Mean reimbursed amount per discharge for PCI and HVR, total and for each category.

Each amount is presented in a form of mean (US$) and Interquartile range; -: Data not applicable.
Table 3. The proportion of patients receiving each service, the mean volume provided to each patient and the mean reimbursed amount per unit for each patient.

aExcept for medication; bReimbursed amount per discharge calculated among patients who had received the medication; -: Data not applicable.
each service, the mean volume provided to each patient and the mean reimbursed amount per unit for each patient who received the service. There was significant variation in the utilization of higher priced technology across the two hospitals. For example, some highly priced new medications for blood and blood forming organs were used only at JHH because these drugs were not available in Japan in 2009, which accounted for 85% of the reimbursed amount for medications of PCI cases at JHH. On the other hand, anti-infectives were more commonly used at KUH. Drug-eluting stents were used more commonly at JHH, while bare-metal stents were used more at KUH. Intravascular ultrasound (IVUS), which is most often used to guide stent deployment or to help determine if an edge dissection following stent is present in PCI, was used in all of the cases at KUH, but seldom used at JHH. For HVR, JHH tended to use biological heart valves while KUH tended to use mechanical heart valves.
There were some tradeoffs between the average amounts reimbursed for each unit of service and the service volume provided. Reimbursed amounts for room and board per day were significantly higher at JHH, but since average length of stay was longer at KUH, the differences were offset. Reimbursed amount per unit of medical imaging at JHH tended to be higher but since a higher proportion of patients received medical imaging at KUH, the differences were offset. The same tendency could be observed for general anesthesia; the average amount reimbursed per-minute was higher at JHH, but the time spent on anesthesia was longer at KUH.
Although the per-unit reimbursed amounts for services tended to be higher at JHH, for some devices the per-unit reimbursed amounts were higher at KUH. This difference was offset somewhat by the greater uses for some devices at JHH, but the reimbursed amount for devices at KUH remained higher as shown in Table 2.
3.5. Hospital Level Data
For room and board, at JHH, the proportions of spending that could be appropriated to registered nurses’ labor (salaries, fringe benefits and contracted labor), to labor other than that for nurses, and to overhead allocated from departments providing services such as administration, employee benefit, pharmacy and dietary were about the same for PCI and HVR. They were 48.4% and 45.7%, 11.0% and 12.7%, and 37.8% and 38.1% respectively.
We focused on the labor costs of registered nurses because comparable detailed data for other labor costs could not be obtained from KUH. The staffing level for registered nurses was substantially higher at JHH: 3.6 full-time equivalent (FTE) nurses per bed for intensive and intermediate care, compared with 2.6 FTE at KUH; and 1.4 FTE per regular bed at JHH, compared with 0.7 FTE at KUH. The average salary plus fringe benefits per nurse were also higher at JHH, $97,190, compared with $61,319 at KUH. When staffing ratios and salaries are both taken into account, the per-diem cost for registered nurses at JHH was 2 - 3 times higher for both PCI and HVR. However, because the average length of stay at KUH was much longer, the estimated actual cost for registered nurses’ labor per discharge was substantially offset for PCI—it was only 9% higher at JHH, $1798, compared with $1642 at KUH. However, it was not sufficient to compensate for HVR, so that the amount was 53% higher at JHH, $5244, compared with $3432 at KUH.
4. DISCUSSION
This study examines the reasons for the differences in hospital spending per discharge at two hospitals in the US and Japan for two procedures using actual detailed patient level claims and cost accounting data. This exploratory study is novel in focusing on reimbursed amounts by payers for health care services and in the use of very detailed pricing, utilization and staffing data that can explain variations in the use of categories of drugs, each modality of medical imaging, and other factors that explain treatment variations. The methodological challenge was to identify comparable patients given the differences in coding systems, treatment protocols and admission requirements, and to examine levels of spending taking into account differences in how the payment rates are set. We hope that this exploratory study will assist others when they compare the amount reimbursed for hospital services or treatment patterns internationally using detailed data.
Because of considerable variation in the level of per capita total expenditures between the US than Japan [1], we were surprised to find that the difference in the total reimbursed amount per discharge for PCI and HVR at the two hospitals were much less than expected. Based on the literature, our initial hypothesis was that JHH would use higher priced technology; pay higher prices for the same technology; and have more intensive utilization of services. JHH actually tended to use more expensive medication acting on blood and blood forming organs, drug-eluting stents and biological heart valves than KUH. However, we observed some tradeoff between prices for the same technology and volume of service provided. In some devices, such as stents, the total amount reimbursed was significantly less at JHH for both of PCI and HVR, despite the greater quantity used, because the reimbursed amounts per unit for devices of the same grade were generally less at JHH. On the other hand, despite fewer patients receiving medical imaging at JHH, the total amount reimbursed for imaging was significantly greater at JHH for both procedures because the amounts reimbursed per unit of the service were generally greater at JHH. We confirmed that differences in the amounts reimbursed per unit were not due to the functional level of the equipment used; they were found to be of the same level.
For HVR, most of the difference in reimbursed amount is attributable to differences in room and board. The higher per diem rate at JHH was not completely compensated by the shorter length of stay. One explanation for the higher room and board spending was the difference in costs for registered nurses’ labor. Another could be administrative spending would be higher at JHH. Although we could not obtain comparable data from KUH, a previous study showed that their proportion was about twice in the US, 10%, compared with 6% in Japan [20]. We were able to confirm this study at JHH using the same method. Its administrative costs were 13.6%.
The reimbursed amount for the actual procedures was greater at JHH for both of PCI and HVR. In particular, for PCI cases, the amount paid to the hospital at JHH was greater than the amount for both hospital and physician services at KUH. This indicates that the amount reimbursed to the hospital for PCI and other accompanied procedures at JHH would be considerably more than the corresponding amount at KUH. For HVR cases, the combined amount at JHH was also higher than at KUH, but the difference was relatively small.
The reasons for the differences of prices and volume of service provided could be ascribed to multiple factors. Since reimbursed amount for each medical service is fixed by the government in Japan and also regulated in the State of Maryland, the differences in reimbursed amounts per unit may be partially explained by the differences in the officially-fixed prices. Although there are generally accepted treatment protocols for PCI and HVR, there may still be variations in each hospital, which could explain the differences in the service volume and composition. Regulations also differ but despite the fact the State of Maryland does not have mandatory hospital nurse to patient staffing ratios as in Japan, the staffing ratio at JHH was higher than at KUH. We could not compare physicians’ incomes but that of registered nurses was higher at JHH.
This is an exploratory study and its primary purpose is to compare in detail how health care services were reimbursed in one academic hospital in US with the one in Japan. The results are not intended to explain the difference of health care spending between the United States and Japan. In order to do so, we need to overcome five limitations in the design of this study. First, our sample was limited to one hospital in each country and only two procedures. Second, we analyzed only spending for inpatient care; analysis of pre and post care was not included. For example, 15% of HVR patients at JHH were discharged to rehabilitation hospitals while most likely none at KUH because very few rehabilitation hospitals exist in Japan. In Japan, rehabilitation services would most likely be provided while the patient remains hospitalized. Thus, the total amount paid would be even greater at JHH than at KUH if post-discharge care were to be included. Third, we assumed, but did not confirm, whether the level of health care quality at JHH and KUH was similar. Fourth, although we excluded atypical cases in order to make our sample more comparable, our result may still have been affected by potential baseline differences in the case mix in the two hospitals. Finally, we compared reimbursed amount per discharge and did not consider the difference in the per capita number of procedures performed in the two countries. Factors such as morbidity, access to health care and health care provider’s tendency to choose invasive care need to be considered.
5. CONCLUSION
This study suggests that studies relying on aggregate data may not be able to explain why there is such large variation in hospital spending across countries. Each category must be studied in detail to analyze the extent that differences accrue to the choice of technology, the price of the same grade technology, or their intensity of use. Future studies will need to refine our approach; improving methodology to crosswalk different reimbursement system, expand the number of procedures, hospitals and countries; and consider other factors as well, such as morbidity, access to health care, quality of care, and preference for invasive treatment procedures.
REFERENCES
- OECD Health Data (2012) http://stats.oecd.org/index.aspx?DataSetCode=HEALTH_STAT
- Danzon, P.M. and Furukawa, M.F. (2008) International prices and availability of pharmaceuticals in 2005. Health Affairs, 27, 221-233. doi:10.1377/hlthaff.27.1.221
- Anderson, G.F., Shea, D.G., Hussey, P.S., Keyhani, S. and Zephyrin, L. (2004) Doughnut holes and price controls. Health Affairs, Web Exclusives, W4-396-404. doi:10.1377/hlthaff.w4.396
- Busse, R., Schreyögg, J. and Smith, P.C. (2008) Variability in healthcare treatment costs amongst nine EU countries: Results from the Health BASKET project. Health Economics, 17, S1-S8. doi:10.1002/hec.1330
- Stargardt, T. (2008) Health service costs in Europe: Cost and reimbursement of primary hip replacement in nine countries. Health Economics, 17, S9-S20. doi:10.1002/hec.1328
- Epstein, D., Mason, A. and Manca, A. (2008) The hospital costs of care for stroke in nine European countries. Health Economics, 17, S21-S31. doi:10.1002/hec.1329
- Tiemann, O. (2008) Variations in hospitalisation costs for acute myocardial infarction: A comparison across Europe. Health Economics, 17, S33-S45. doi:10.1002/hec.1322
- Bellanger, M.M. and Or, Z. (2008) What can we learn from a cross-country comparison of the costs of child delivery? Health Economics, 17, S47-S57. doi:10.1002/hec.1325
- Schreyögg, J. (2008) A micro-costing approach to estimating hospital costs for appendectomy in a cross-European context. Health Economics, 17, S59-S69. doi:10.1002/hec.1323
- Fattore, G. and Torbica, A. (2008) Cost and reimbursement of cataract surgery in Europe: A cross-country comparison. Health Economics, 17, S71-S82. doi:10.1002/hec.1324
- Tan, S.S., Ken Redekop, W. and Rutten, F.F.H. (2008) Costs and prices of single dental fillings in Europe: A micro-costing study. Health Economics, 17, S83-S93. doi:10.1002/hec.1326
- Schreyögg, J., Tiemann, O., Stargardt, T. and Busse, R. (2008) Cross-country comparisons of costs: The use of episode-specific transitive purchasing power parities with standardised cost categories. Health Economics, 17, S95- S103. doi:10.1002/hec.1327
- Ishikawa, K.B., Holt, M., Kaihara, S., Yoshikawa, A., Hopkins, D.S. and Mason, M. (1993) Performance, characteristics, and case mix in Japanese and American teaching hospitals. Medical Care, 31, 542-551. doi:10.1097/00005650-199306000-00008
- Schreyögg, J., Stargardt, T. and Tiemann, O. (2011) Costs and quality of hospitals in different health care systems: A multi-level approach with propensity score matching. Health Economics, 20, 85-100. doi:10.1002/hec.1568
- Newhouse, J.P. (1993) An iconoclastic view of health cost containment. Health Affairs, 12, 152-171. doi:10.1377/hlthaff.12.suppl_1.152
- Newhouse, J.P. (1992) Medical care costs: How much welfare loss? Journal of Economic Perspectives, 6, 3-21. doi:10.1257/jep.6.3.3
- Cutler, D. (1995) Technology, health costs, and the NIH. National Institutes of Health Roundtable on the Economics of Biomedical Research.
- Murray, R. (2009) Setting hospital rates to control costs and boost quality: The Maryland experience. Health Affairs, 28, 1395-1405. doi:10.1377/hlthaff.28.5.1395
- Ikegami, N. and Anderson, G.F. (2012) In Japan, all-payer rate setting under tight government control has proved to be an effective approach to containing costs. Health Affairs, 31, 1049-1056. doi:10.1377/hlthaff.2011.1037
- Ikegami, N. Wolfson, J. and Ishii, T. (1996) Comparison of administrative costs in health care between Japan and the United States. In: Containing Health Care Costs in Japan, University of Michigan Press, Ann Arbor.