Engineering
Vol. 4 No. 6 (2012) , Article ID: 19860 , 9 pages DOI:10.4236/eng.2012.46043
Prediction of Natural Frequency of Laminated Composite Plates Using Artificial Neural Networks
School of Mechanical Engineering, R.G.M. College of Engineering & Technology, Kurnool, India
Email: bsrrgmcet@gmail.com
Received March 6, 2012; revised April 24, 2012; accepted May 2, 2012
Keywords: DOE; Laminated Composite Plates; ANN; MLP; D-Optimal Design; Finite Element Analysis
ABSTRACT
The paper is focused on the application of artificial neural networks (ANN) in predicting the natural frequency of laminated composite plates under clamped boundary condition. For training and testing of the ANN model, a number of finite element analyses have been carried out using D-optimal design in the design of experiments (DOE) by varying the fibre orientations, –45˚, 0˚, 45˚ and 90˚. The composite plate is modeled using linear layered structural shell element. The natural frequencies were found by analyses which were done by finite element (FE) analysis software. The ANN model has been developed using multilayer perceptron (MLP) back propagation algorithm. The adequacy of the developed model is verified by coefficient of determination (R). It was found that the R2 (R: coefficient of determination) values are 1 and 0.998 for train and test data respectively. The results showed that, the training algorithm of back propagation was sufficient enough in predicting the natural frequency of laminated composite plates. To judge the ability and efficiency of the developed ANN model, absolute relative error has been used. The results predicted by ANN are in very good agreement with the finite element (FE) results. Consequently, the D-optimal design and ANN are shown to be effective in predicting the natural frequency of laminated composite plates.
1. Introduction
Laminated composite plates are becoming increasingly popular as major structural components and are now in common use in primary aircraft structures owing to the many advantages they offer: high strength/stiffness for lower weight, superior fatigue response characteristics, facility to vary fibre orientation, material and stacking pattern. To avoid the resonant behavior of the laminated structures, the accurate mathematical model is required to predict the results of the free vibration analysis for the laminated composite structures in the structural design. However, free vibration analysis of laminated composite plates and shells has not received ample attention. Laminated composite materials are usually fabricated from unidirectional plies of given thickness and with fibre orientations limited to a small set of angles, e.g., 0˚, 45˚, –45˚ and 90˚ [1]. Recently many researchers used finite element method in the analysis of engineering structures [2-4]. Kant and Kommineni [5] developed the higher order shear deformation theory to study the free vibration analysis of laminated composite plates. Latheswary et al. [6] used a four-noded finite element for free vibration analysis of laminated composite plates, based on higherorder shear deformation theory. They found that, the nondimensional fundamental frequency of vibration increases with increase in width-to-thickness ratio, material anisotropy and angle of fibre orientation and decrease with aspect ratio. They also found that, the effect of number of layers is found to be insignificant beyond four layers. The free vibration analysis of carbon nano tube reinforced composite panels studied using finite element method [3]. They found that, the natural frequency increases with the addition of carbon nano tubes into the fibre composite. Prabhakaran et al. [7] investigated free vibration and the effect of stacking sequence on tensile, impact and absorption properties of composite laminates. They concluded that, the stacking sequence greatly affects the tensile strength and increase of thickness of layers increases the natural frequency. Kant and Swaminathan [8] developed the analytical solutions for free vibration of composite and sandwich plates based on higher-order refined theory. Küçükrendeci and Omer [9] investigated the effects of elastic boundary conditions on the linear free vibrations. They observed that frequency parameters increase when boron/epoxy used. Zhao et al. [10] employed two dimensional reproducing kernel functions in the Ritz method to analyze the vibration analysis laminated composite cylindrical panels. Metin and Taner [11] employed the Ritz method to find the natural frequencies of anti-symmetric angle-ply laminated thin square composite plates for different boundary conditions. The static deflections and free vibration of plates with different shapes and boundary conditions were examined by the Liu et al. [12]. They used the first order shear deformation theory. Rakesh Kumar et al. [13] employed a C0 isoparametric finite element formulation based on a shear deformable model of higher-order theory using a higher order facet shell element to study the free vibration analysis of composite and sandwich laminates. They also studied the parametric effects of degree of orthotropy, length to-thickness ratio, plate aspect ratio, number of layers and fibre orientation on the frequency and mode shapes. Lin et al. [4] performed the vibration analysis of angleply laminated composite plates with an embedded piezoceramic layer. A semi-analytical method has been used by the Rao and Desai [14] to evaluate the natural frequencies as well as displacement and stress eigenvectors for simply supported, cross-ply laminated and sandwich plates by using higher order mixed theory. Patel et al. [15] was used the finite element method for analyzing the free vibration of laminated anisotropic composite conical cylindrical shell structures. A simple two-noded shear flexible axi-symmetric shell element based on field consistency approach is employed. Shankara and Iyengar [16] developed a C0 element for the free vibration analysis of laminated composite plates, together with a higher order shear deformation theory (HSDT) to account for the parabolic variation of transverse shear stresses through the thickness and linear variation of the normal stresses. Afshari [17] studied the free undamped vibration response of laminated composite plates. They developed a series of plate elements, based on the modified complementary energy principal. Free vibration analysis of rotating composite panels using finite strip method with modified shape functions is also developed by Mohammad et al. [18]. Kant and Mallikarjuna [19] presented a higher-order theory with C0 finite element for free vibration of asymmetrically laminated composite and sandwich plate. They also studied the effect of plate aspect ratio on the fundamental natural frequencies and transverse shear moduli of stiff layers. Reddy et al. [20] used the finite element method and ANN to optimize the stacking sequence of laminated composite plates using Distance based optimal design in the design of experiments.
In the present study, 16 ply symmetric laminated composite plate has been modeled using linear layered structural shell element. The composite plate is analysed using finite element analysis software for various fibre orientations in each layer i.e., –45˚, 0˚, 45˚ and 90˚. The D-optimal design in the design of experiments technique has been employed to carry out the finite element analyses. A predictive model for natural frequency in terms of fibre orientations is then developed using artificial neural networks. The developed model is tested with the test data which were never used for developing the model. The experimental results show that the maximum absolute relative error predicted by ANN and FE results is 0.0000707%, which is less than 5%. Hence ANN model predicted results are in very good agreement with the FE results. Consequently, the D-optimal design and ANN are shown to be very effective in predicting the natural frequency of laminated composite plates under clamped boundary condition.
2. Geometry of the Linear Layered Structural Shell Element
There are many element types, in ANSYS software, available to model layered composite materials. In our FE analysis, the linear layered structural shell element is used. It is designed to model thin to moderately thick plate and shell structures with a side-to-thickness ratio of roughly 10 or greater. The linear layered structural shell element allows a total of 250 uniform-thickness layers. Alternately, the element allows 125 layers with thicknesses that may vary bi-linearly over the area of the layer. It also has an option to offset the nodes to the top or bottom surface. The geometry of the linear layered structural shell element is shown in Figure 1 [21].
where
xIJ = Element x-axis if ESYS (Element co-ordinate system) is not supplied.
x = Element x-axis if ESYS is supplied.
LN = Layer Number.
NL = Total Number of Layers.
3. Design of Experiments and Artificial Neural Networks
3.1. Design of Experiments
A Design of Experiment (DOE) is a structured, organized method for determining the relationship between factors affecting a process and the output of that process. Standard DOE arrangements are available for box-like or

Figure 1. Geometry of 8-node element with six degrees of freedom.
spherical domains. However, we can’t use such simple geometrical arrangement of points for more complicated design domains. Instead, a D-optimal computer-generated DOE is used to select design data points. The Doptimality criterion minimizes the variance in the regression coefficients of the fitted model [22].
3.2. Artificial Neural Networks
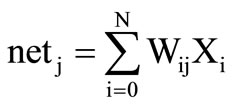
The artificial neural networks are the excellent tools in modeling the complex process. The use of artificial neural networks (ANN) has been well accepted in the areas of telecommunication, signal processing, pattern recognition, prediction, process control and financial analysis. Artificial neural networks which are simplified models of the biological neuron system, is a massively parallel distributing processing system made up of highly intercomnected neural computing elements or processing units is called neurons. Neural networks are built by connecting these neurons together by weighted inter connections. Determination of these weights called training is the most significant task. In supervised learning the network is trained to learn a mapping from certain inputs to given outputs. An example of supervised learning is the backpropagation method for multilayer perceptron (MLP) networks. Multilayer means the addition of one or more hidden layers in between the input and output layers. In the network each neuron receives total input from all of the neurons in the preceding layer according to the Equation (1).
 (1)
(1)
where netj is the total or net input and N is the number of inputs to the jth neuron in the hidden layer. Wij is the weight of the connection from the ith neuron in the forward layer to the jth neuron in the hidden layer. A neuron in the network produces its output (Outj) by processing the net input through an activation (transfer) function, such as tangent hyperbolic function as in Equation (2).
 (2)
(2)
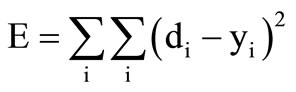
In the training process the algorithm is used to calculate neuronal weights, so that the squared error between the calculated outputs and observed outputs from the training set is minimum and is calculated using Equation (3).
 (3)
(3)
where di is the desired response (or target signal), yi are the output units of the network, and the sums run over time and over the output units. When the mean square error is minimized, the power of the error (i.e. the power of the difference between the desired and the actual ANN output is minimized [23].
4. Model Description
4.1. Physical Model
The physical structure that used in this work is a fibre reinforced composite plate, shown in Figure 2. The length and width of the plate is 250 mm and thickness of the plate is 2.5 mm. the ply orientation is treated as a design variable.
4.2. Finite Element Model
A total 164 analyses are performed in this design study, using a finite element model of the plate. The model was developed using linear layered structural shell element in ANSYS 10.0, using 400 elements. The global x-coordinate is taken along the length of the plate; the global y-coordinate is taken along the width of the plate while the global z-direction is taken out the plate surface. The plate is analyzed for natural frequencies under clamped boundary condition.
4.3. Validation of Linear Layered Structural Shell Element—Case Study
In order to validate the usage of the linear layered structural shell element, numerical examples are solved for free vibration analysis.
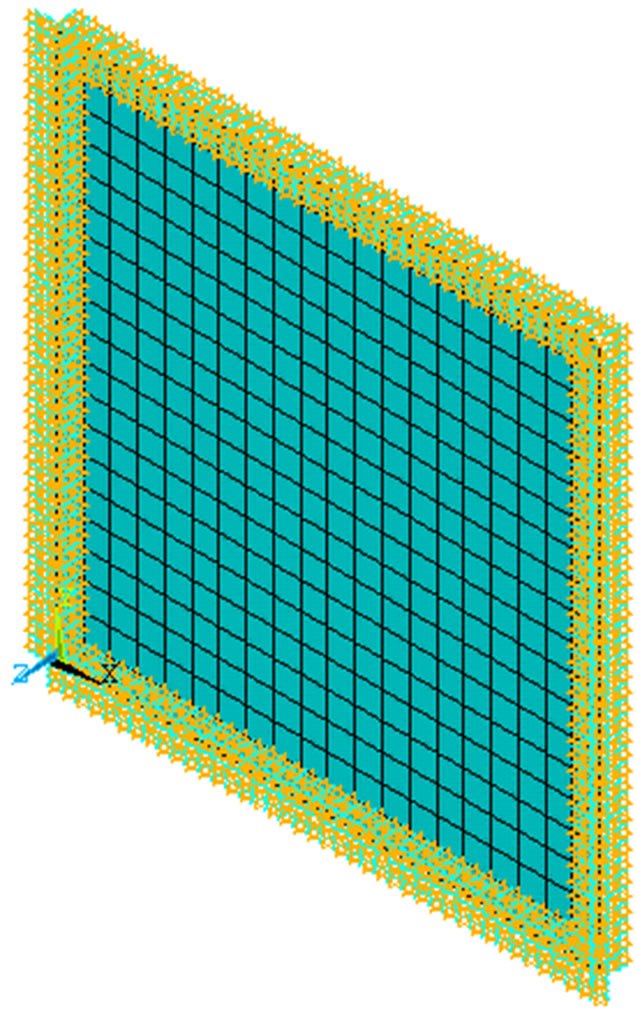
Figure 2. Plate model with clamped boundary condition.
Example 1: Free vibration analysis of simply supported [0˚/90˚/0˚/90˚/0˚]s laminated composite square plate.
Consider a ten-layer simply supported laminated square plate with the following stacking sequences [0˚/90˚/0˚/ 90˚/0˚]s and a side length of 0.2 m with a thickness of 0.00269 m. The material is considered to be T300/934 CFRP with the mechanical properties as:
E1 = 120 GPa, E2 =7.9 GPa, G12 = 5.5 GPa, ρ = 1580 kg/m3, .
.
The natural frequency obtained by ANSYS is compared with the available literature [24-26] and presented in Table 1. The convergence study is also presented in Table 1. The results using a free mesh show an excellent correlation to the results available in literature [24-26].
Example 2: free vibration analysis of rectangular laminated composite plate with clamped all edges.
To verify the applicability of software for free vibration analysis, finite element results are compared with the reference solution taken from literature [27]. The properties of the material are listed in Table 3. The plate parameters are as follows:
a = 250 mm; b = 500 mm; t = 1.04 mm;
The layer stacking sequence of the plate is [0/±45/ 90]s.
The play thickness considered as 0.13 mm. The plate is clamped with at all edges. Numerical results which are obtained by finite element simulation for the first five natural frequencies are presented in Table 2. The results in Table 2 indicate good agreement with the present method.
4.4. Experimental Details
In the present study, the D-optimal design has been implemented to select a feasible set of laminates from among all feasible laminates. Let us consider the case of a 16- ply laminate. The total number of entire feasible laminates
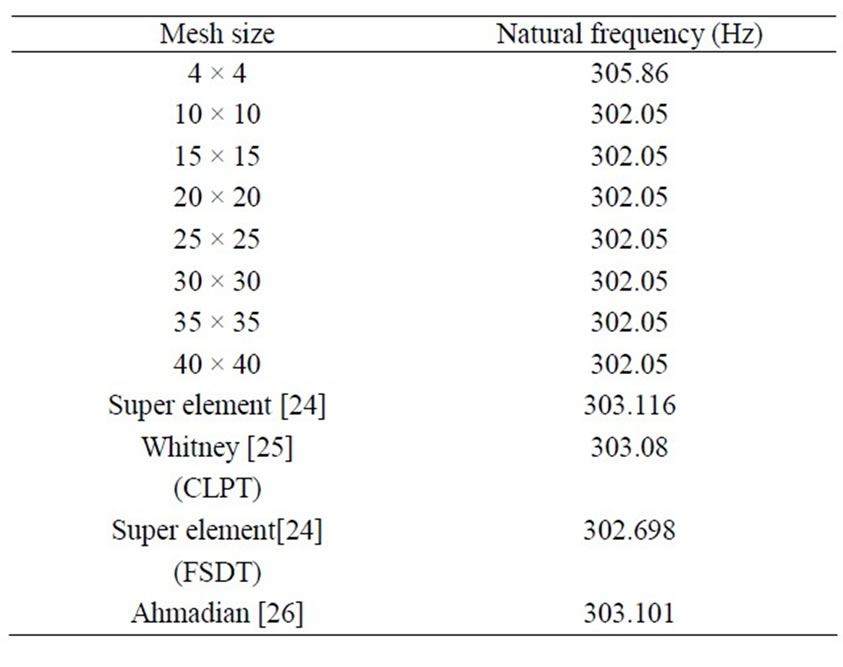
Table 1. Natural frequency of simply supported [0˚/90˚/0˚/ 90˚/0˚]s laminated composite square plate.
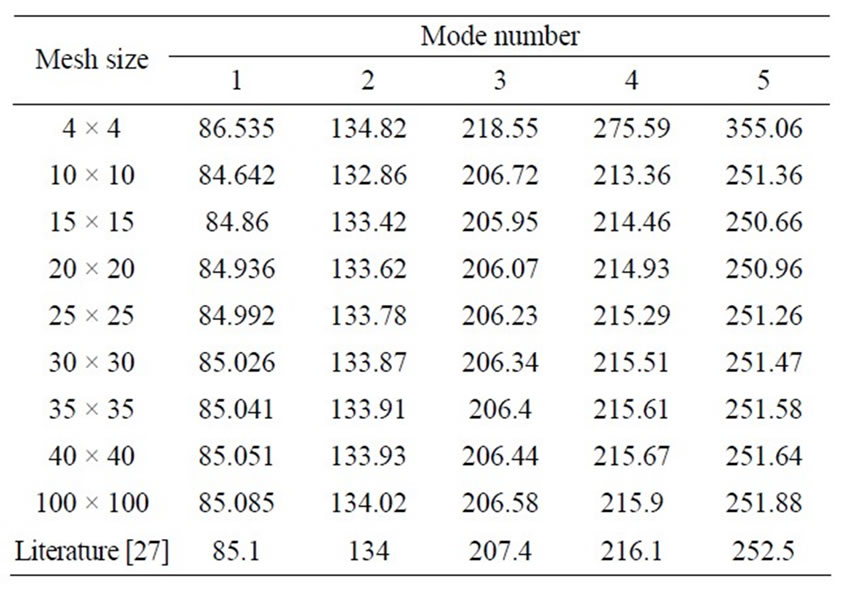
Table 2. Natural frequency of clamped (all edges) [0/±45/ 90]s laminated composite rectangular plate.

Table 3. Material properties (carbon/epoxy).
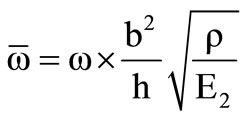
is 3 × 3 × 3 × 3 × 3 × 3 × 3 × 3 = 6561 because we consider only a symmetric laminate and we adopt 3 levels (0˚, 45˚ and 90˚) for each ply. The “odd” occurrences i.e., first (outermost), third, fifth, etc. of 45˚ plies corresponds to 45˚ plies, whereas “even” occurrences corresponds to –45˚. For example, a laminate of [0/45/45/90/45/90/90] is coded as [0/45/–45/90/45/90/90]. There is one unbalanced 45˚ ply when the number of occurrences of 45˚ plies is odd. This is repaired by replacing the 45˚-ply with a 90˚-ply or a 0˚-ply. The 45˚-ply position replaced by a 90˚-ply or a 0˚-ply is the innermost 45˚-ply that can be replaced without violating the four contiguous ply rule: the same fibre angle plies must not stacked more than four plies [1]. We can select feasible laminates from the set of feasible laminates using D-optimal. In this study, the total 164 feasible laminates were selected for training (134 laminates) and testing (30 laminates) of the artificial neural network model. Because, fourty five unknown coefficients exist in the quadratic polynomial function of eight variables (eight layers). Hence the number of experiments required for regression is approximately more twice the number of coefficients. The selected D-optimal set of laminates design was performed using Design Expert 8.0.2 software and the results are shown in Figure 3. The material properties used throughout this study are shown in Table 3. The natural frequencies are presented here in non-dimensional form using the following:
5. Development of ANN Model
One of the key issues when designing a particular neural
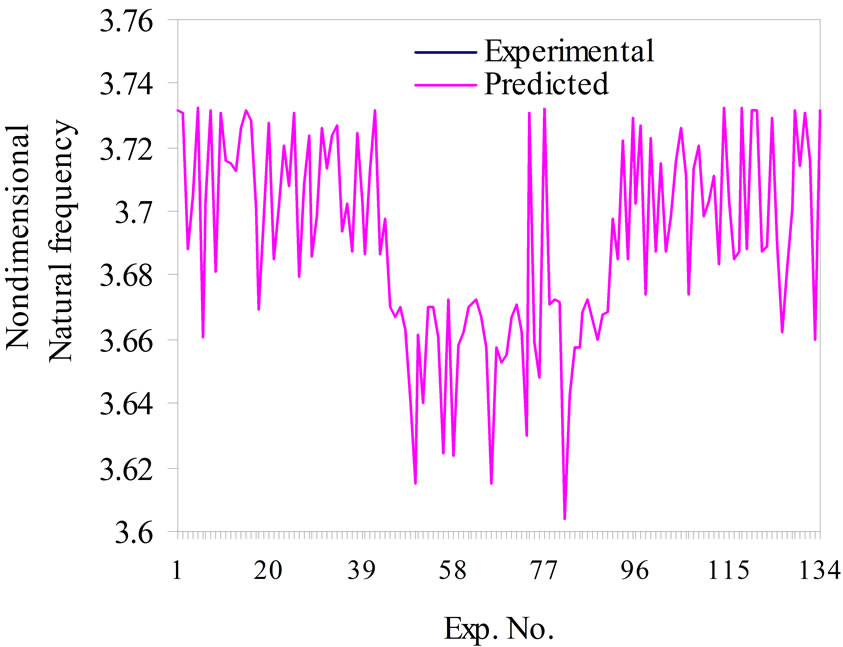
Figure 3. Comparison of results between experimental and predicted natural frequency for train data set.
network is to calculate proper weights for neuronal activities. These are obtained from the training process applied to the given neural network. To that end, a training sample is provided, i.e. a sample of observations consisting of inputs and their respective outputs. The observations are fed to the network. In the training process the algorithm is used to calculate neuronal weights, so that the squared error between the calculated outputs and observed outputs from the training set is minimized [23].
5.1. Designing of the Neural Network Architecture
The optimal neural network architecture 8-30-1 was used in this study. It was designed using NeuroSolutions 4.0 software. The network consists of one input, one hidden and one output layer. The input layer has 8 neurons, hidden layer has thirty neurons and output layer has one neuron respectively. Since natural frequency prediction in terms of ply orientation was the main interest in this research, neurons in the input layer corresponding to the number of plies and the output layer corresponds to natural frequency.
5.2. Generation of Train and Test Data
To calculate the connection weights, a set of desired network output values are needed. Desired output values are called the training data set. The training data set in this study was selected based on D-optimal design in the design of experiments. In this study, 134 data set were used for training and 30 data set were used for testing the network respectively.
5.3. Neural Network Training
For calculation of weight variables, often referred to as network training, the weights are given quasi-randomintelligently chosen initial values. They are then iteratively updated until convergence to the certain values using the gradient descent method. Gradient descent method updates weights so as to minimize the mean square error (MSE) between the network prediction and training data set as in Equations (4) and (5).
 (4)
(4)
 (5)
(5)
where E is the MSE and outj is the jth neuron output. η is the learning rate [step size, momentum] parameter controlling the stability and rate of convergence of the network. The learning rate [step size 1.0, momentum 0.7] selected and the training process takes place on a Intel(R) Atom™ processor PC for 65,000 training iterations. The minimum mean square error is obtained for training data is 1.20434e–11 for 64,965 training iterations. Figure 4 depicts the convergence of minimum MSE with epochs. Figure 5 shows the variation of MSE with number of neurons. The comparison between ANN model output and experimental output for training data sets are shown in Figure 3. Figure 3 showing that, the predicted values using ANN is very good correlation and representation with the experimental results. The size of the mean square error (MSE) can be used to determine how well the network output fits the desired output, but it doesn’t necessarily reflect whether the two sets of data move in the same direction. For instance, by simply scaling the network output, we can change the MSE without changing the directionality of the data. The correlation coefficient (r) solves this problem [23]. The correlation coefficient (r) training data set is 1 that shows there is a perfect positive linear correlation between inputs and outputs, that is, they covary, which means that they vary by the same amount. The correlation coefficient is calculated using the following Equation (6).
 (6)
(6)
where xi= network output for exemplar i;
di = desired output for exemplar i;
x = mean network output for all exemplars;
d = mean desired output for all exemplars;
N = number of exemplars in the data set.
Figure 6 shows the variation of correlation coefficient with the number of neurons. In order to judge the ability and efficiency of the model to predict the natural frequentcies percentage deviation (Ø) and the average percentage

Figure 4. Training MSE vs number of iterations.
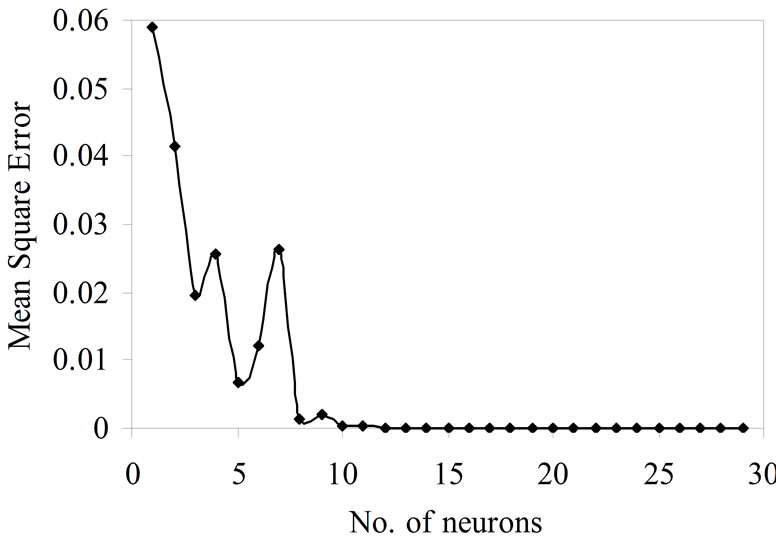
Figure 5. Mean square error vs number of neurons.

Figure 6. Correlation coefficient vs number of neurons.
deviation (φ) were used and calculated as in Equations (7) and (8)
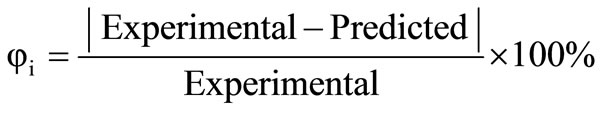 (7)
(7)
where  = percentage deviation of single sample data
 (8)
(8)
where  = average percentage deviation of all sample data and n = size of the sample data. The average percentage deviation for natural frequency of training data calculated as 0.00000454%.
5.4. Neural Network Testing
The ANN predicted results are in very good agreement with experimental results and the network can be used for testing. Hence the testing data sets are applied for the network, which were never used in the training process. The results predicted by the network were compared with the measured values and shown in Figure 7. The test data set is presented in Table 4. The average percentage deviation for natural frequency of test data was found to be 0.05613%.
5.5. Regression Analysis
To have more precise investigation into the model, a regression analysis of ANN predicted and experimental measured values were performed and are shown in Figures 8 and 9. The adequacy of the developed model is verified by using coefficient of determination (R2) . The R2 is the variability in the data accounted for by the model in percentage [28]. The regression coefficients are calculated to estimate the correlation between the ANN predicted values by the ANN model and the experimental measured values resulted from finite element tests. The regression coefficients are calculated by using Equation (9).
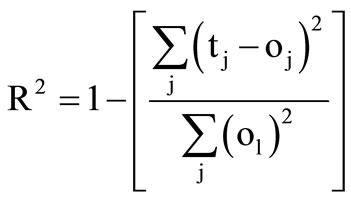 (9)
(9)
where tj = targets or experimental values or measured values.

Figure 7. Comparison of results between experimental and predicted natural frequency for test data set.
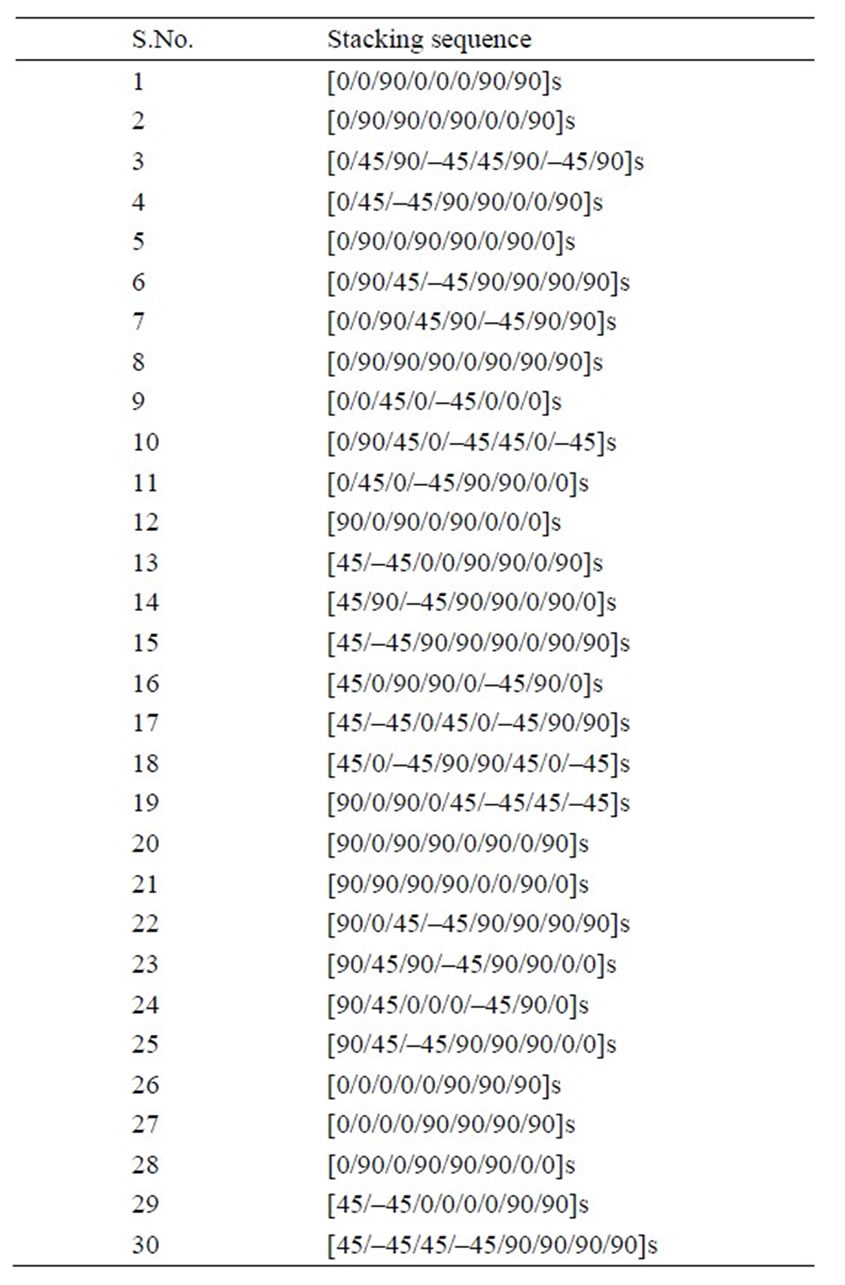
Table 4. Test data set.
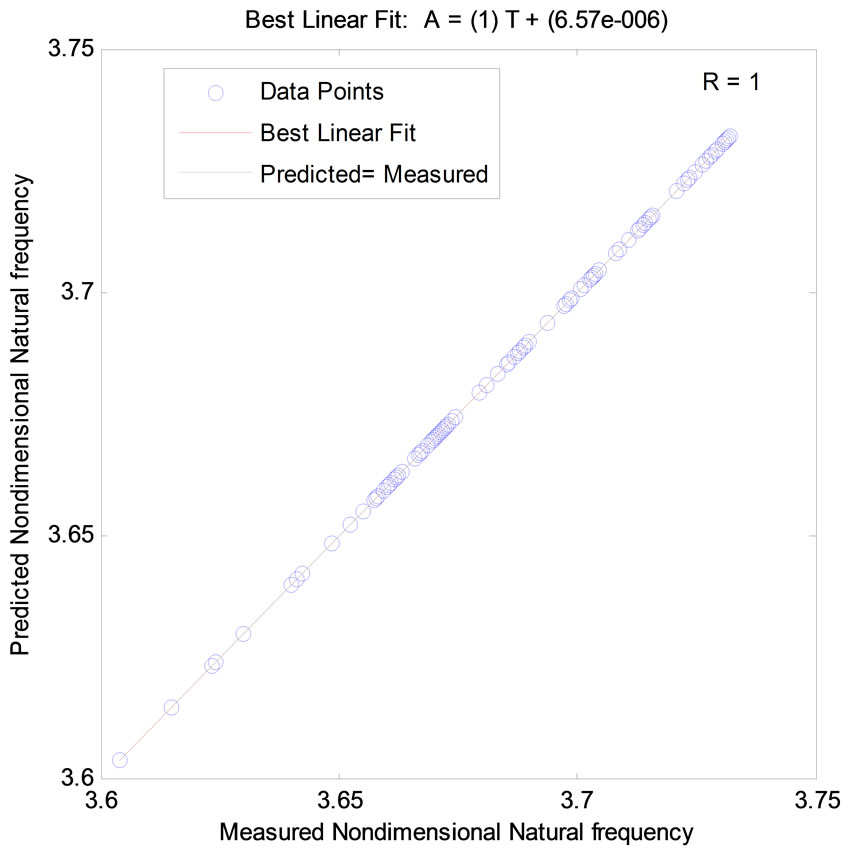
Figure 8. Regression analysis between predicted and measured natural frequency for training data set.
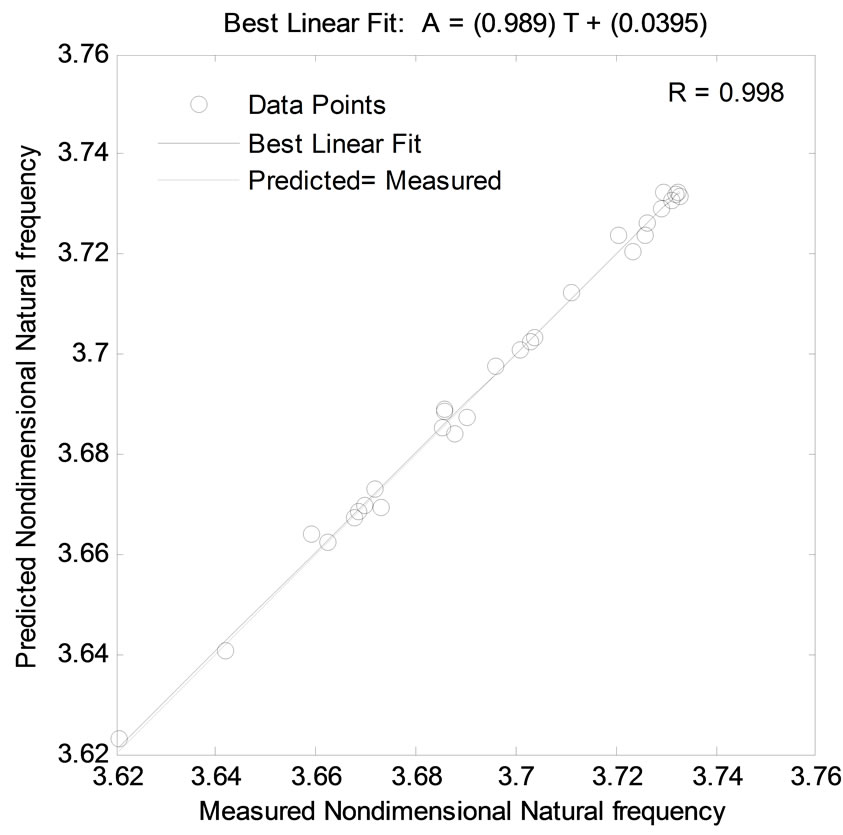
Figure 9. Regression analysis between predicted and measured natural frequency for test data set.
oj = outputs or ANN predicted values.
There is a high correlation between the ANN predicted values by the ANN model and the experimental measured values resulted from finite element analyses. The correlation coefficients for train and test data are 1 and 0.998 respectively, which shows there is a strong correlation in modeling natural frequencies. From Figures 8 and 9, it is very difficult to distinguish the best linear fit line from the perfect line, because the fit is so good.
6. Conclusions
The natural frequency values were found by analyzes which were done by a finite element software ANSYS10.0 using D-optimal design in the design of experiments. Based on the finite element results and the results predicted by artificial neural networks, the following conclusions are drawn for laminated composite material plates.
• The artificial neural network model has been developed by considering the ply angle as the input for predicting the natural frequency. The developed ANN model could predict the natural frequency with an average percentage deviation of 0.00000454% from training data set.
• The ANN model could predict the natural frequency with an average percentage deviation of 0.05613% from test data set.
• The ANN predicted results are in very good agreement with the finite element results.
7. Extensions and Future Studies
The proposed D-optimal designs can be applied in structural analysis in predicting the natural frequencies of laminated composite plates. The proposed D-optimal design is not limited to 16-ply laminates. It is applicable to laminates of any number of plies by changing the ply thickness. The prediction of natural frequency can also be done using fuzzy logic, Hybrid algorithms (neural networks and fuzzy logic, neural networks and genetic algorithms etc). The proposed design of experiments technique can also be applied to study the thermal behavior of laminated composite plates and shells.
REFERENCES
- A. Todoroki and T. Ishikawa, “Design of Experiments for Stacking Sequence Optimizations with Genetic Algorithm Using Response Surface Approximation,” International Journal of Composite Structures, Vol. 64, No. 3-4, 2004, pp. 349-357. doi:10.1016/j.compstruct.2003.09.004
- K. M. Dutt and H. K. Shivanand, “An Experimental Approach to Free Vibration Response of Carbon Composite Laminates,” International Journal of Advanced Engineering & Application, No. 66, 2011, pp. e66-68.
- B. R. Reddy, K. Ramji and B. Satyanarayana, “Free Vibration Analysis of Carbon Nanotube Reinforced Laminated Composite Panels,” World Academy of Science, Engineering and Technology, Vol. 80, 2011, pp. 768-772.
- H.-Y. Lin, J.-H. Huang and C.-C. Ma, “Vibration Analysis of Angle-Ply Laminated Composite Plates with an Embedded Piezoceramic Layer,” IEEE Transactions on Ultrasonics, Ferroelectrics, and Frequency Control, Vol. 50, No. 9, 2003, pp. 1084-1099. doi:10.1109/TUFFC.2003.1235320
- T. Kant and J. R. Kommineni. “Large Amplitude Free Vibration Analysis of Cross-ply Composite and Sandwich Laminates with a Refined Theory and Co Finite Elements,” Computers and Structures, Vol. 50, No. 1, 1994, pp. 123-134. doi:10.1016/0045-7949(94)90443-X
- S. Latheswary, K. V. Valsarajan, et al., “Free Vibration Analysis of Laminated Plates Using Higher-Order Shear Deformation Theory,” IE(I) Journal-AS, Vol. 85, 2004, pp. 18-24.
- M. Prabhakaran and C. Sivakandhan, “Analysis of Mechanical Properties and Free Vibration Response of Composite Laminates,” International Journal of Mechanical & Industrial Engineering, Vol. 1, No. 1, 2011, pp. 84-88.
- T. Kant and K. Swaminathan “Analytical Solutions for Free Vibration of Composite and Sandwich Plates Based on Higher-Order Refined Theory,” Composite Structures, Vol. 53, No. 1, 2001, pp. 73-85. doi:10.1016/S0263-8223(00)00180-X
- I. Küçükrendeci1 and Ö. K. Morgül, “The Effects of Elastic Boundary Conditions on the Linear Free Vibrations,” Scientific Research and Essays, Vol. 6, No. 19, 2011, pp. 3949-3958.
- X. Zhao, K. M. Liew and T. Y. Ng, “Vibration Analysis of Laminated Composite Cylindrical Panels via a Meshfree Approach,” International Journal of Solids and Structures, Vol. 40, No. 1, 2003, pp. 161-180. doi:10.1016/S0020-7683(02)00475-4
- M. Aydo˘gdu and T. Timarci, “Free Vibrations of Antisymmetric Angle-Ply Laminated Thin Square Composite Plates,” Turkish Journal of Engineering and Environmental Science, Vol. 31, No. 4, 2007, pp. 243-249.
- G. R. Liu, X. Zhao, K. Y. Dai, Z. H. Zhong, G. Y. Li and X. Han, “Static and Free Vibration Analysis of Laminated Composite Plates Using the Conforming Radial Point Interpolation Method,” Composites Science and Technology, Vol. 68, No. 2, 2008, pp. 354-366. doi:10.1016/j.compscitech.2007.07.014
- R. K. Khare, T. Kant and A. K. Garg, “Free Vibration of Composite and Sandwich Laminates with a Higher-Order Facet Shell Element,” Journal of Composite Structures, Vol. 65, No. 3-4, 2004, pp. 405-418. doi:10.1016/j.compstruct.2003.12.003
- M. K. Rao and Y. M. Desai, “Analytical Solutions for Vibrations of Laminated and Sandwich Plates Using Mixed Theory,” Composite Structures, Vol. 63, No. 3-4, 2004, pp. 361-373. doi:10.1016/S0263-8223(03)00185-5
- B. P. Patel, M. Ganapathi and S. Kamat, “Free Vibration Characteristics of Laminated Composite Joined ConicalCylindrical Shells,” Journal of Sound and Vibration, Vol. 237, No. 5, 2000, pp. 920-930. doi:10.1006/jsvi.2000.3018
- C. A. Shankara and N. G. R. Iyengar, “AC0 Element for the Free Vibration Analysis of Laminated Composite Plates,” Journal of Sound and Vibration, Vol. 191, No. 5, 1996, pp. 721-738. doi:10.1006/jsvi.1996.0152
- P. Afshari, “Free Vibration Analysis of Composite Plates,” Journal of Pressure Vessel Technology, Vol. 122, No. 3, 2000, pp. 390-399. doi:10.1115/1.556198
- M. H. Sadr, H. G. Bargh, M. K. Nejadi and H. Pourzand, “Free Vibration Analysis of Rotating Laminated Composite Panels Using Finite Strip Method with Modified Shape Functions,” Proceedings of the ASME 2011 International Mechanical Engineering Congress & Exposition, Denver, 11-17 November 2011, pp. 1-7.
- T. Kant and Mallikarjuna, “A Higher-Order Theory for Free Vibration of Asymmetrically Laminated Composite and Sandwich Plate-Finite Element Evaluations,” Computers and Structure, Vol. 32, No. 5, 1989, pp. 1125- 1132.
- A. R. Reddy, B. S. Reddy and K. V. K. Reddy, “Application of Design of Experiments and Artificial Neural Networks for Stacking Sequence Optimizations of Laminated Composite Plates,” International Journal of Engineering, Science and Technology, Vol. 3, No. 6, 2011, pp. 295- 310.
- ANSYS, “Theory Manual,” 2010.
- R. H. Meyers and D. C. Montgomery, “Response Surface Methodology: Process and Product Optimization Using Designed Experiments,” John Wiley & Sons, New York, 1995.
- J. Principe, C. Lefebvre, G. Lynn, C. Fancourt and D. Wooten, “Neurosolutions Documentation.” http://www.neurosolutions.com/downloads/documentation.html
- R. Vaziri, X. Quan and M. D. Olson, “Impact Analysis of Laminated Composite Plates and Shells by Super Finite Element,” International Journal of Impact Engineering, Vol. 18, No. 7-8, 1996, pp. 765-782. doi:10.1016/S0734-743X(96)00030-9
- J. M. Whitney, “Structural Analysis of laminated Anisotropic Plates,” Technomic Publishing Co., Inc., Lancaster, 1987.
- M. T. Ahamadian and M. S. Zangeneh, “Forced Vibration Analysis of Laminated Rectangular Plates Using Super Elements,” Journal of Scientia Iranica, Vol. 10, No. 2, 2003, pp. 260-265.
- R. Rikards, A. Chate and O. Ozolinsh, “Analysis for Buckling and Vibrations of Composite Stiffened Shells and Plates,” Composite Structures, Vol. 51, No. 4, 2001, pp. 361-370. doi:10.1016/S0263-8223(00)00151-3
- D. C. Montgomery, “Design and Analysis of Experiments,” 5th Edition, Wiley, New York, 2001.