Intelligent Control and Automation
Vol.4 No.2(2013), Article ID:31741,11 pages DOI:10.4236/ica.2013.42022
Dynamic Friction Behaviors of Pneumatic Cylinders
1Department of Fluid Machine and Automation, School of Transportation Engineering, Hanoi University of Science and Technology, Hanoi, Vietnam
2Department of Mechanical Engineering, Toyohashi University of Technology, Toyohashi, Japan
Email: bo.tranxuan@hust.edu.vn, yanada@me.tut.ac.jp
Copyright © 2013 Xuan Bo Tran, Hideki Yanada. This is an open access article distributed under the Creative Commons Attribution License, which permits unrestricted use, distribution, and reproduction in any medium, provided the original work is properly cited.
Received December 6, 2012; revised February 17, 2013; accepted February 25, 2013
Keywords: Friction; Dynamic Behavior; Pneumatic Cylinder; Mathematical Model
ABSTRACT
This paper deals with experimental investigation and modeling of dynamic friction behaviors in the sliding regime of pneumatic cylinders. Using three pneumatic cylinders, friction characteristics are investigated and modeled under various conditions of velocity variation and pressures. It is shown that a hysteretic behavior can be seen at low velocities in the friction force-velocity relation and the friction force varies nearly linearly with the velocity at high velocities. The hysteretic loop is expanded to higher velocities when the frequency of the velocity variation is increased, and its size is increased with increasing driving pressure and is decreased with increasing resistance pressure. It is shown that such behaviors can be relatively accurately simulated by the new modified LuGre model in which a few static parameters are varied with the frequency of velocity variation.
1. Introduction
Friction is always present in a pneumatic cylinder system and makes the dynamics of the system rather complex and precise position/velocity control is usually difficult. It is, therefore, necessary to investigate the friction behaviors of a pneumatic cylinder and develop a suitable friction model in order to predict the behaviors of the pneumatic cylinder system or improve its control performance. However, to the best of the authors’ knowledge, the friction characteristics of pneumatic cylinders under dynamic conditions have not been investigated. This is partly because of difficulty in controlling the velocity of the pneumatic cylinders.
Several experimental methods have been proposed to investigate the friction characteristics in the sliding regime of pneumatic cylinders. Schoroeder and Singh [1] proposed an experimental test setup in which the friction force was calculated by detecting the force exchanged by the rods of the tested pneumatic cylinder and of a load pneumatic cylinder assembled with a reversed working direction. Belforte et al. [2] proposed an experimental test setup in which the velocity of the test pneumatic cylinder was controlled by a driving hydraulic cylinder and the pressures of the chambers were controlled by proportional pressure control valves in order to measure the friction force under a broad range of operating conditions of velocity and pressures. Nouri [3] proposed an experimental test setup to identify the friction force in both the pre-sliding and sliding regimes of a rodless cylinder. However, all these experimental methods focused mainly on investigating the steady-state friction characteristics.
Several mathematical models that describe the dynamic behaviors of friction have been proposed so far [4-9] and among them, the LuGre model [6] is most widely utilized. However, all these models cannot simulate well the dynamic friction behaviors of a hydraulic cylinder in the sliding regime as shown in [10]. Yanada and Sekikawa [10] have made a modification to the LuGre model by incorporating lubricant film dynamics into the model and it has been shown that the proposed model, called the modified LuGre model, can simulate the dynamic behaviors of friction observed in hydraulic cylinders with a relatively good accuracy [10-12].
Tran et al. [13] have shown that the modified LuGre model is valid only in the negative resistance regime and cannot simulate the hysteretic behaviors observed in hydraulic cylinders in the fluid lubrication regime. In addition, they have revised the modified LuGre model by replacing the usual fluid friction term with a first-order lead dynamics and have shown the usefulness of the new modified LuGre model in the entire sliding regime. Although the new model can simulate almost all the dynamic friction behaviors of hydraulic cylinders, the validity of the new model in simulating the dynamic friction behaviors of pneumatic cylinders has not been investigated.
In this paper, dynamic friction behaviors of pneumatic cylinders are examined in the sliding regime under various operating conditions of velocity variation and pressures. In addition, the new modified LuGre model is validated using measured dynamic friction characteristics. A parameter investigation is also conducted to identify the influence of the pressures in the cylinder chambers on the parameters of the new modified LuGre model.
This paper is organized as follows: Section 2 describes the test setup and experiments and Section 3 describes the new modified LuGre model. Experimental and simulation results are presented and discussed in Section 4. Finally, conclusion is given in Section 5.
2. Test Setup and Experiments
The test setup used in this investigation is shown in Figure 1. It consists of a pneumatic cylinder under test and an electrohydraulic servo cylinder system. The pneumatic piston was driven by the hydraulic piston in order to accurately control the velocity of the pneumatic piston. The pressures in two chambers of the pneumatic cylinder were independently controlled by using two proportional pressure control valves. The valves provide air flow up to 0.025 m3/s and allow controlling the pressures up to 0.65 MPa. The motion of the hydraulic piston was controlled by a computer through an amplifier and a servovalve. The supply pressure of the servovalve was set at 2 MPa, providing enough force to drive the pneumatic piston.
A load cell with a rated output of 500 N and with an accuracy less than 0.15% R.O. was set between the rod of the pneumatic cylinder and the rod of the hydraulic cylinder and was used to measure the force acting on the

Figure 1. Schema of experimental test setup.
pneumatic piston. Two pressure sensors with an accuracy less than 2% F.S. were used to measure the pressures, p1 and p2, in the cylinder chambers, and the piston velocity, v, was measured using a tachogenerator with a ripple of less than 2% by converting linear motion of the piston to rotational motion through a pulley and belt system.
The signals of velocity, pressures, and force from the sensors were read into the computer through an A/D converter and the computer provided the control signals to the proportional valves and the servovalve though a D/A converter. Experimental data, i.e., velocity, v, pressures, p1 and p2, and force acting on the load cell, FL, were recorded at the interval of 0.5 ms (2 kHz). The acceleration, a, of the piston was calculated by an approximate differentiation of the piston velocity accompanied by an acausal first-order low pass filter with 50 Hz cutoff frequency. The velocity of the pneumatic piston, v, and the pressures, p1 and p2, were controlled by using PID control laws.
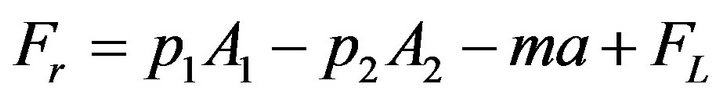
The friction force, Fr, is obtained from the equation of motion of the pneumatic piston using the measured values of the pressures in the cylinder chambers, the inertia force and the force acting on the load cell as follows:
 (1)
(1)
where m is the mass of the pneumatic piston and A1, A2 are the piston areas.
Three different pneumatic cylinders, i.e., standard, smooth, and low speed cylinders were used for the experiments. They are of the same size but have different operating conditions of the velocity and pressure as shown in Table 1. In the experiment, dynamic friction characteristic was measured under different conditions of the velocity variation and pressures. The input velocity of the pneumatic piston was varied sinusoidally in both the extending and retracting strokes of the cylinders at different frequencies. The pressures, p1 and p2, in the cylinder chambers were varied between 0 and 0.6 MPa. The pressure, p1 or p2, is defined as the driving pressure when the direction of the force acting on the piston caused by the pressure is similar to that of the piston motion, and the other one is defined as the resistance pressure. Every
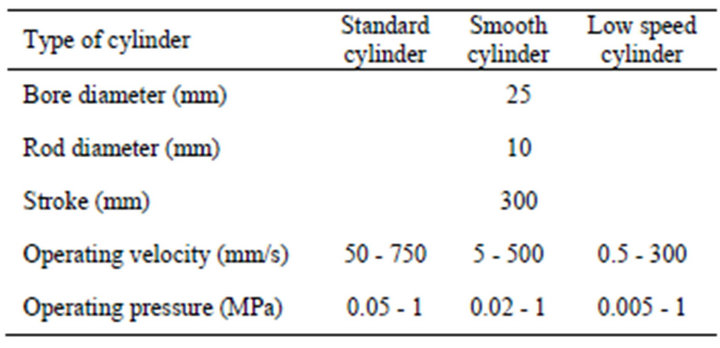
Table 1. Specifications of pneumatic cylinders tested (catalogue data).
experiment was conducted three times to verify the repeatability of the experimental result.
3. Friction Models
Tran et al. [13] have extended the modified LuGre model [10] for simulating the dynamic behaviors of friction of hydraulic cylinders in the fluid lubrication regime by replacing the usual fluid friction term with a first-order lead dynamics. The model is called the new modified LuGre model and is described by
 (2)
(2)
 (3)
(3)
where z is the mean deflection of surface asperities, v is the relative velocity between the two surfaces in contact, Fr is the friction force, σ0 is the stiffness of the surface asperities, σ1 is the micro-viscous friction coefficient, σ2 is the viscous friction coefficient, and T is the time constant for fluid friction dynamics. g(v,h) is a Stribeck function that expresses the Coulomb friction and the Stribeck effect, i.e., friction decreases with increasing velocity in certain low velocity regime [4], and is given by
 (4)
(4)
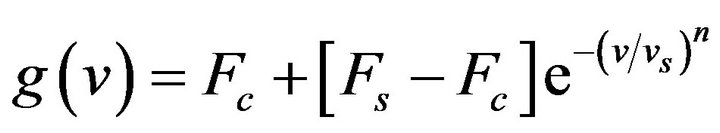
where Fc is the Coulomb friction force, Fs stands for the maximum static friction force, vs is the Stribeck velocity, and n is an appropriate exponent. g(v,h) in Equation (4) is obtained by incorperating lubricant film dynamics into the Stribeck function g(v) of the LuGre model [10]:
 (5)
(5)
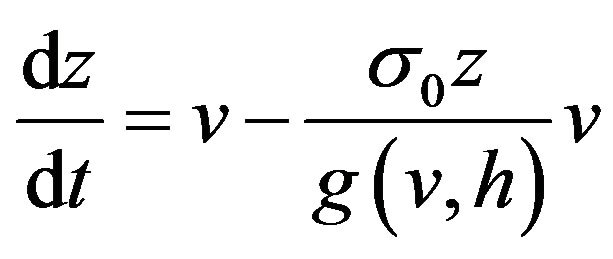
The lubricant film dynamics can be given by
 (6)
(6)
 (7)
(7)
 (8)
(8)
 (9)
(9)
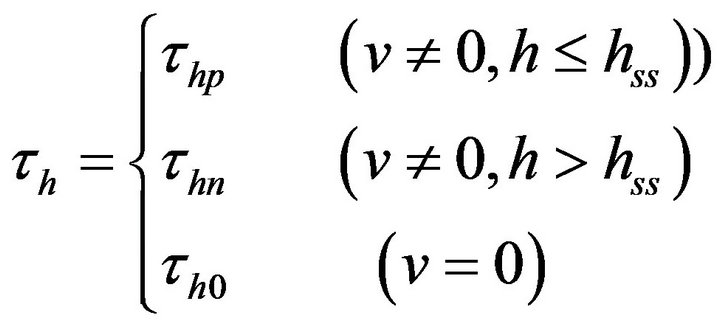
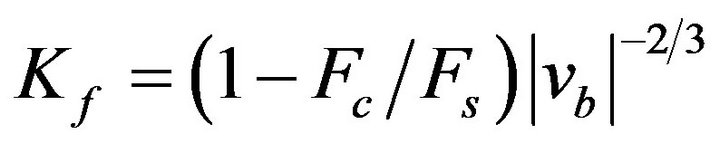
where hss is the dimensionless steady-state lubricant film thickness parameter, Kf is the proportional constant for lubricant film thickness, vb is the velocity within which the lubricant film thickness is varied, and τhp, τhn, τh0 are the time constants for acceleration, deceleration, and dwell periods, respectively. In Equation (7), h < hss corresponds to the acceleration period, h > hss to the decaleration period.
The lubricant used for the packing of pneumatic cylinders is grease and is not oil. Regarding the behavior of film formation of grease between contact surfaces, it has been shown that the film thickness becomes thinner during acceleration and thicker during deceleration than the steady-state film thickness [14]. This behavior of grease film is the same as that of oil film [15]. Therefore, it is believed that the lubricant film dynamics described by Equations (6) to (9) hold also for grease.
For steady-state, friction force is given by
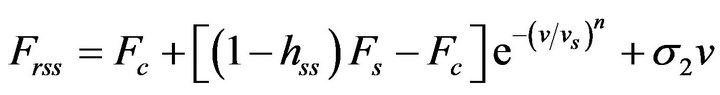 (10)
(10)
In this paper, the new modified LuGre model was validated by comparing the measured results with the ones simulated by the model. Simulation was done using MATLAB/Simulink. Measured velocity wave forms were used as the input to the model. The static parameters of the model, Fs, Fc, vs, vb, n, and σ2, were identified experimentally from the steady-state friction characteristics using the least-squares method and the dynamic parameters, σ0, σ1, σh, and T were identified experimentally by the method proposed in [11,13].
4. Results and Discussion
4.1. Steady-State Friction Characteristics
Figure 2 shows the steady-state friction characteristics measured for the three pneumatic cylinders in both the extending and retracting strokes. The pressures p1 and p2 in the cylinder chambers were kept constant at 0.3 and 0 MPa, respectively, in the extending stroke (Figure 2(a)), and were kept constant at 0 and 0.3 MPa, respectively, in the retracting stroke (Figure 2(b)). As can be seen from Figure 2, the standard cylinder shows a typical Stribeck curve and the negative resistance regime is clearly seen in both the extending and retracting strokes. However, the smooth and low speed cylinders do not show the negative resistance characteristic and the friction force is increased almost linearly with the velocity in the whole velocity range. The grease and packing material used for the smooth and low speed cylinders, which are industrial secrets, are different from those used for the standard cylinder. It is considered that those differences yield the difference in the friction characteristic.
Figure 3 shows the steady-state friction characteristics measured under different pressures of p1 and p2 for the standard cylinder in the extending stroke. In this case, p1 is the driving pressure and p2 is the resistance pressure.
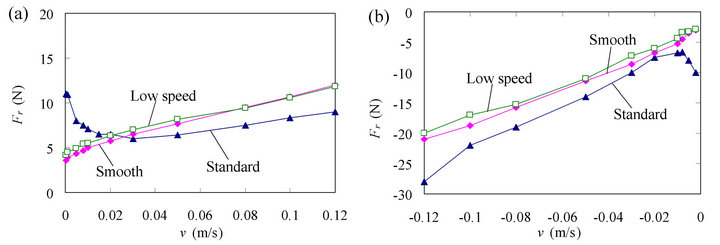
Figure 2. Measured steady-state friction characteristics of three pneumatic cylinders: (a) Extending stroke (p1 = 0.3 MPa, p2 = 0 MPa); (b) Retracting stroke (p1 = 0 MPa, p2 = 0.3 MPa).
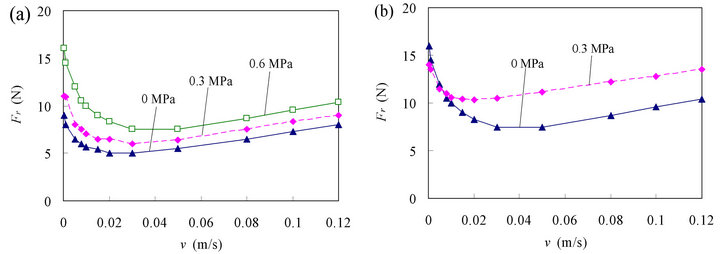
Figure 3. Measured steady-state friction characteristics at different pressures in extending stroke for standard cylinder: (a) Effect of p1 (p2 = 0 MPa); (b) Effect of p2 (p1 = 0.6 MPa).
Figure 3(a) shows the friction characteristics measured under different values of the pressure p1 when the pressure p2 is kept constant at 0 MPa, and Figure 3(b) shows the friction characteristics measured under different values of the pressure p2 when the pressure p1 is kept constant at 0.6 MPa. It is shown in Figure 3(a) that the friction force increases with the driving pressure p1 in the whole range of the velocity. In Figure 3(b), the friction force increases with the resistance pressure p2 in the velocity range of  but slightly decreases with the resistance pressure p2 at small velocities.
Figure 4 shows the steady-state friction characteristics measured under different pressures of p1 and p2 for the standard cylinder in the retracting stroke. In this case, p2 is the driving pressure and p1 is the resistance pressure. Figure 4(a) shows the friction characteristics measured under different values of the pressure p2 when the pressure p1 is kept constant at 0 MPa, and Figure 4(b) shows the friction characteristics measured under different values of the pressure p1 when the pressure p2 is kept constant at 0.6 MPa. It is shown in Figure 4 that the friction force decreases with the driving pressure p2 and increases with the resistance pressure p1 at velocities larger than 0.01 m/s. However, at low velocities, the friction forces increases with the driving pressure p2 and slightly decreases with the resistance pressure p1. The results obtained in Figures 3 and 4 are in agreement with those obtained by Belforte et al. [2]. The effects of the pressures on the steady-state friction characteristics for the smooth and low speed cylinders were similar to those for the standard cylinder.
Based on the measured steady-state friction characteristics and the least-squares method, the static parameters of the new modified LuGre model were identified for the three pneumatic cylinders at different conditions of pressures p1 and p2. Table 2 shows the identification results of the static parameters for the three pneumatic cylinders in the extending stroke at an operating condition of p1 = 0.3 MPa and p2 = 0 MPa. For different operating conditions of pressures, the identification results showed that the values of the maximum static friction force Fs, the Coulomb friction force Fc, and the Stribeck velocity vs, of the new modified LuGre model are changed with the pressures while the other static parameters are unchanged with pressures.
Figure 5 shows the relations between the values of the parameters, Fs, Fc, vs, and the pressures, p1, p2, for the standard cylinder in extending stroke. As can be seen from Figure 5, the value of Fc increases linearly with both p1 and p2, while the values of Fs and vs increase linearly with p1 and decrease linearly with p2. Based on this result, the relations between the parameters, Fs, Fc, vs,
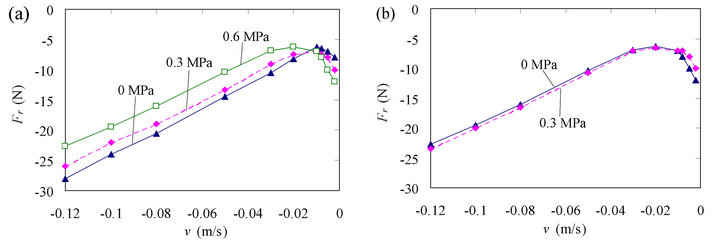
Figure 4. Measured steady-state friction characteristics at different pressures in retracting stroke for standard cylinder: (a) Effect of p2 (p1 = 0 MPa); (b) Effect of p1 (p2 = 0.6 MPa).

Table 2. Values of static parameters of the new modified LuGre model for three pneumatic cylinders identified in extending stroke at p1 = 0.3 MPa, p2 = 0 Mpa.
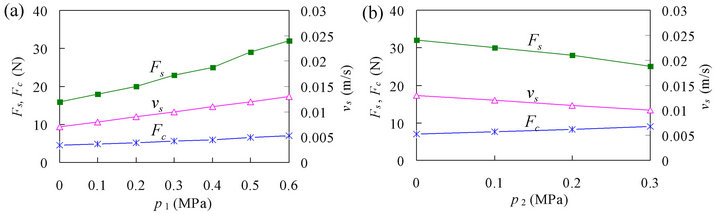
Figure 5. Relations between pressures and model parameters in extending stroke of standard cylinder: (a) Effect of p1 (p2 = 0 MPa); (b) Effect of p2 (p1 = 0.6 MPa).
and the pressures, p1, p2, can be approximated by
 (11)
(11)
where Fs0, Fc0 and vs0 are the parameters that are identified from the steady-state friction characteristic measured at p1 = 0 MPa and p2 = 0 MPa, and  are coefficients. For the case of standard cylinder shown in Figure 5, the suitable values of the coefficients are x1 = 0.25 × 10⁻⁴ m2, x2 = –0.2 × 10⁻⁴ m2, x3 = 0.035 × 10⁻⁴ m2, x4 = 0.064 × 10⁻⁴ m2, x5 = 0.01 m3/N·s, and x6 = –0.01 m3/N·s.
4.2. Dynamic Friction Characteristics
Figure 6 shows an example of the dynamic friction characteristics measured in the extending stroke of the three pneumatic cylinders. Figure 6(a) shows a sinusoiddal velocity variation of the pneumatic piston and Figure 6(b) shows the friction force-velocity curves. The pressures p1 and p2 in the cylinder chambers were kept constant at 0.3 and 0 MPa, respectively. It is shown in Figure 6(b) that a hysteretic behavior can be observed in the friction force-velocity curves at small velocities  for all the three pneumatic cylinders. For the hysteretic loops, the friction force observed during acceleration is larger than that observed during deceleration and the direction of hysteretic loops is clockwise. At higher velocities
 , the friction forces are increased nearly linearly with the velocity.
Figure 7 shows the dynamic friction characteristics measured in the retracting stroke of the three pneumatic
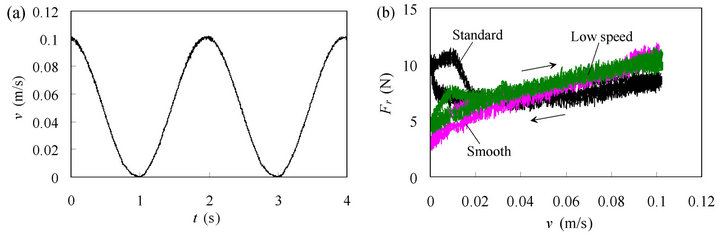
Figure 6. Dynamic friction characteristics for three pneumatic cylinders in extending stroke (p1 = 0.3 MPa, p2 = 0 MPa, f = 0.5 Hz): (a) Velocity variation; (b) Friction force vs. velocity curve.

Figure 7. Dynamic friction characteristics for three pneumatic cylinders in retracting stroke (p1 = 0 MPa, p2 = 0.3 MPa, f = 0.5 Hz): (a) Velocity variation; (b) Friction force vs. velocity curve.
cylinders. In this case, the pressures p1 and p2 in the cylinder chambers were kept constant at 0 and 0.3 MPa, respectively. As can be seen from Figure 7(b), the hysteretic behavior can be observed only for the standard cylinder at small velocities . For the smooth and low speed cylinders, the friction force increases almost linearly with the velocity in the whole velocity range. The dynamic friction behaviors shown in Figures 6 and 7 are different from those of hydraulic cylinders; the hysteretic behavior is observed in the whole varying velocity range for hydraulic cylinders [13]. Such difference may be caused by the difference in types of lubricant fluid used in pneumatic cylinders (grease) and hydraulic cylinders (oil).
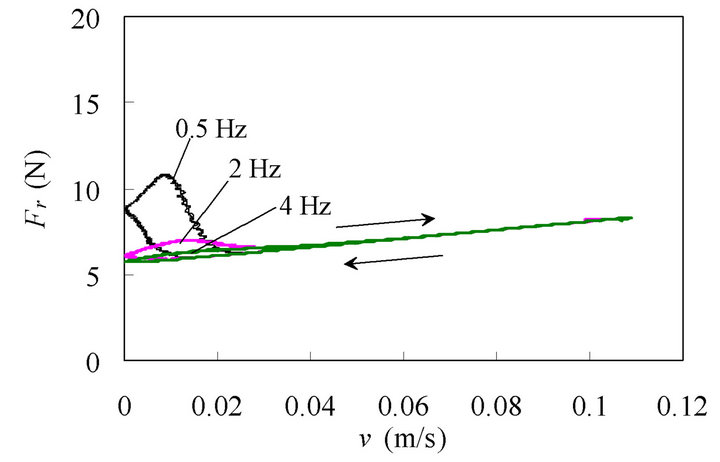
Figure 8 shows the dynamic friction characteristics of the standard cylinder measured at three different frequencies of velocity variation, 0.5, 2, and 4 Hz, for both the extending and retracting strokes. It is shown in Figure 8(a) for the case of extending stroke that when the frequency is increased, the hysteretic loop is expanded to higher velocities and becomes larger. In addition, a reduction of the friction force at small velocities can be seen when the frequency is increased. Similar results are also seen for the case of retracting stroke in Figure 8(b). The smooth and low speed cylinders showed the dynamic friction characteristics similar to those of the standard cylinder as illustrated in Figure 9 for the low speed cylinder.
Figure 10 shows the effects of the pressures p1 and p2 on the dynamic friction characteristic for the standard cylinder in the extending stroke. In this case, p1 is the driving pressure and p2 is the resistance pressure. Figure 10(a) shows the effect of p1 when p2 is kept constant at 0 MPa, and Figure 10(b) shows the effect of p2 when p1 is kept constant at 0.6 MPa. As can be seen from Figure 10, the hysteretic loop becomes larger with increasing driving pressure p1 and becomes smaller with increasing resistance pressure p2.
Figure 11 shows the effects of the pressures p1 and p2 on the dynamic friction characteristic for the standard cylinder in the retracing stroke. In this case, p2 is the driving pressure and p1 is the resistance pressure. Figure 11(a) shows the effect of p2 when p1 is kept constant at 0 MPa, and Figure 11(b) shows the effect of p1 when p2 is kept constant at 0.6 MPa. As can be seen from Figure 11, the hysteretic loop becomes larger with increasing driving pressure p2 and becomes smaller with increasing resistance pressure p1. From the results obtained in Figures 10 and 11, it can be concluded that the size of the hysteretic loop is increased with increasing driving pressure and is decreased with increasing resistance pressure. It seems that these results are closely related to the deformation of the seals caused by the pressures acting on them. The effects of the pressures on the dynamic friction characteristics for the smooth and low speed cylinders were similar to those for the standard cylinder.
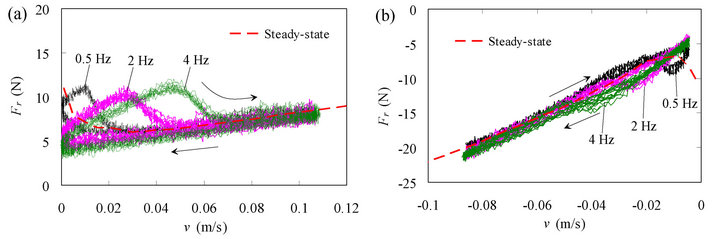
Figure 8. Dynamic friction characteristics under different frequencies (standard cylinder): (a) Extending stroke (p1 = 0.3 MPa, p2 = 0 MPa); (b) Retracting stroke (p1 = 0 MPa, p2 = 0.3 MPa).
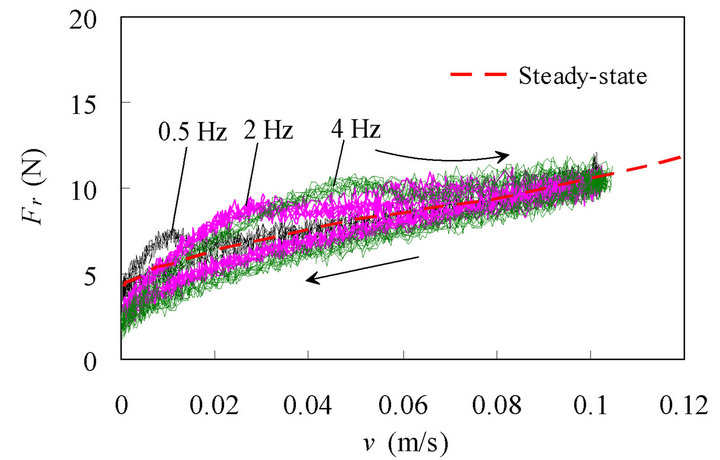
Figure 9. Dynamic friction characteristics under different frequencies for low speed cylinder in extending stroke (p1 = 0.3 MPa, p2 = 0 MPa).

Figure 10. Dynamic friction characteristics under different pressures in extending stroke of standard cylinder: (a) Effect of p1 (p2 = 0 MPa, f = 0.5 Hz); (b) Effect of p2 (p1 = 0.6 MPa, f = 0.5 Hz).
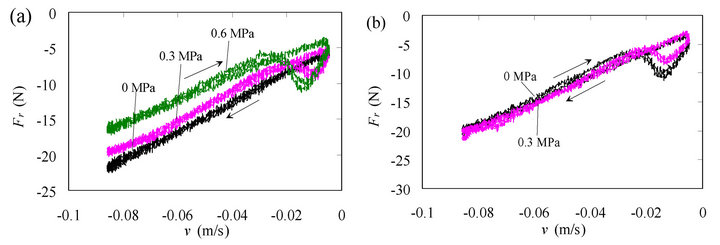
Figure 11. Dynamic friction characteristics under different pressures in retracting stroke of standard cylinder: (a) Effect of p2 (p1 = 0 MPa, f = 0.5 Hz); (b) Effect of p1 (p2 = 0.6 MPa, f = 0.5 Hz).
Using the identification method proposed in [11,13], the dynamic parameters of the new modified LuGre model were identified at various conditions of velocity variation and pressures. Table 3 shows the identification results of the dynamic parameters for the three pneumatic cylinders in the extending stroke at an operating conditions of p1 = 0.3 MPa, p2 = 0 MPa and f = 0.5 Hz. The values of the time constant, T, was identified as T = 0 s for the three pneumatic cylinders. This result means that the fluid friction dynamics is negligible. Therefore, the new modified LuGre model is reduced to the modified LuGre model for the pneumatic cylinders except for the difference in the definition of vb. In addition, it was shown that the pressures and the frequency of velocity variation have no influence on the dynamic parameters of the new modified LuGre model.
4.3. Comparison between Experiment and Simulation
Figure 12 shows comparisons between the dynamic friction characteristics measured and the ones simulated by the new modified LuGre model for the standard, smooth and low speed cylinders. As can be seen from Figure 12, all the simulated results are in good overall agreement with the measured results. However, the hysteretic behaviors of the smooth and low speed cylinders at small velocities are hardly simulated by the new modified LuGre model.
Figure 13 shows the simulation results at different frequencies obtained by the new modified LuGre model and needs to be compared with the experimental results shown in Figure 8(a). The comparison shows that the new modified LuGre model can predict the reduction of the friction force at small velocities with increasing frequency. However, the new modified LuGre model cannot predict the expansion of the hysteretic loop to higher velocities at increased frequencies. The hysteretic loop predicted by the new modified LuGre model remains in the velocity range of and its size becomes smaller with

Table 3. Values of dynamic parameters of the new modified LuGre model for three cylinders identified at p1 = 0.3 MPa, p2 = 0 MPa.
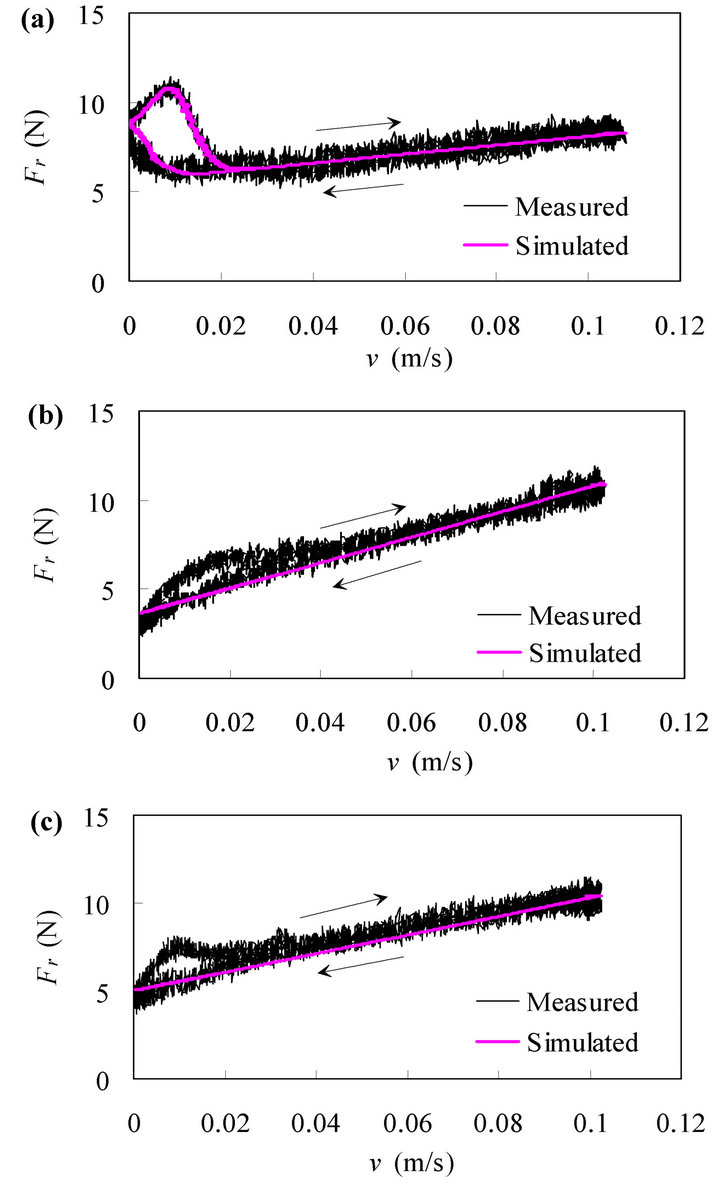
Figure 12. Comparison between measured and simulated results for three pneumatic cylinders (p1 = 0.3 MPa, p2 = 0 MPa, f = 0.5 Hz): (a) Standard cylinder; (b) Smooth cylinder; (c) Low speed cylinder.
increasing frequency.
By varying the parameters vb, vs, Fc, and σ2 with the frequency as shown in Equation (12), the new modified LuGre model can predict accurately the expansion of the hysteretic loop to high velocities as well as the reduction of the friction force at small velocities with increasing frequency as shown in Figure 14. It is noted in Equation (12) that f is the frequency of velocity variation, f0 is a standard frequency and takes a value 1 Hz, and vb, vs, Fc, and σ2 are the parameters that are identified from the steady-state friction characteristic at each condition of pressures. The increase of vb and vs with increasing frequency mainly determines the expansion of the hysteresis loop to high velocities, while the decrease of Fc and the increase of σ2 with increasing frequency mainly determine the reduction of the friction force at low velocities. However, a decrease of Fc with increasing frequency also leads to a decrease of the maximum value of the friction force as can be seen in Figure 14. This result differs from the experimental result shown in Figure 8(a).
 (12)
(12)
The reason for the dependence of these parameters on the frequency may be due to the effect of some other mechanisms that are not incorporated in the friction model. The lubricant used for the packing of pneumatic cylinders is grease and is not oil. Grease possesses rheological characteristics different from those of oil. Grease shows behaviors similar to solid at very low shear rates and those very similar to the base oil of the grease at high shear rates. In addition, some dynamic mechanism may exist in the rheological characteristic of grease under a varying shear rate condition, i.e., under a varying velocity condition. The increase in the magnitudes of vs and vb with the frequency of velocity variation means the extension of the negative resistance regime. These characteristics need to be incorporated into the friction model, though not clear at present.
Figure 15 shows the simulation results at different pressures obtained by the new modified LuGre model and needs to be compared with the experimental results shown in Figure 10. The comparison shows that the new modified LuGre model can predict accurately the increase in size of hysteretic loop with the driving pressure p1, and the decrease in size of hysteretic loop with the resistance pressure p2. The results can be explained by the fact that the pressures affect the parameters Fs and vs of the new modified LuGre model as shown in Equation (11).
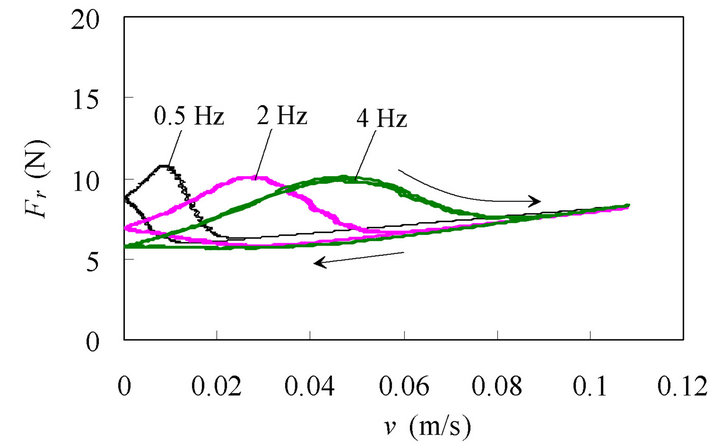
Figure 14. Simulation results obtained using parameters varied with frequency (corresponding to Figure 8(a)).
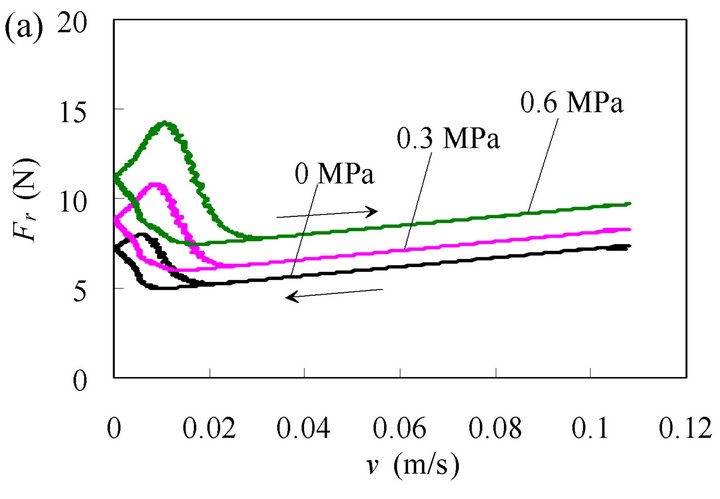

Figure 15. Simulation results corresponding to Figure 10: (a) Effect of p1 (p2 = 0 MPa, f = 0.5 Hz); (b) Effect of p2 (p1 = 0.6 MPa, f = 0.5 Hz).
5. Conclusion
In this paper, dynamic behaviors of friction in the sliding regime of pneumatic cylinders are investigated experimentally and simulated using the new modified LuGre model at various conditions of velocity variation and pressures. The experimental results show that a hysteretic behavior can be obtained at low velocities in the dynamic friction force-velocity relation and the friction force varies nearly linearly with the velocity at high velocities. The hysteretic loop is expanded to higher velocities when the frequency of the velocity variation is increased, and its size increases with the driving pressure and decreases with the resistance pressure. The simulation results show that the new modified LuGre model can simulate accurately almost all the dynamic friction behaviors of pneumatic cylinders by varying a few parameters, especially vs and vb, with the frequency of velocity variation. However, the physical meaning of the frequency dependence of the parameters is not clear. The elucidation of the physical meaning, the improvement of the friction model, and the application of the new friction model to the simulation of the dynamic behaviors of pneumatic cylinder systems will be the subjects for future research.
6. Acknowledgements
The authors would like to express their gratitude to Prof. Y. Wakasawa for his help in part of the experiments and to SMC Corporation for donating the majority of the pneumatic components used in the investigation.
REFERENCES
- L. E. Schroeder and R. Sigh, “Experimental Study of Friction in a Pneumatic Actuator at Constant Velocity,” Journal of Dynamic Systems, Measurement, and Control, Vol. 115, No. 3, 1993, pp. 575-577. doi:10.1115/1.2899143
- G. Sc Belforte, G. Mattiazzo and S. Mauro, “Measurement of Friction Force in Pneumatic Cylinders,” Tribotest Journal, Vol. 10, No. 1, 2003, pp. 33-48. doi:10.1002/tt.3020100104
- B. M. Y. Nouri, “Friction Identification in Mechatronic Systems,” ISA Transactions, Vol. 43, No. 2, 2004, pp. 205- 216. doi:10.1016/S0019-0578(07)60031-7
- B. Armstrong-Helouvry, P. Dupont and C. Canudas de Wit, “A Survey of Models, Analysis Tools and Compensation Methods for the Control of Machines with Friction,” Automatica, Vol. 30, No. 7, 1994, pp. 1083-1138. doi:10.1016/0005-1098(94)90209-7
- D. A. Haessig Jr. and B. Friedland, “On the Modeling of Friction and Simulation,” Journal of Dynamic Systems, Measurement, and Control, Vol. 113, No. 3, 1991, pp. 354- 362. doi:10.1115/1.2896418
- C. Canudas de Wit, H. Olsson, K. J. Åström and P. Linschinsky, “A New Model for Control of Systems with Friction,” IEEE Transactions on Automatic Control, Vol. 40, No. 3, 1995, pp. 419-425. doi:10.1109/9.376053
- P. E. Dupont and E. P. Dunlop, “Friction Modeling and PD Compensation at Very Low Velocities,” Journal of Dynamic Systems, Measurement, and Control, Vol. 117, No. 1, 1995, pp. 8-14. doi:10.1115/1.2798527
- J. Swevers, F. Al-Bencer, C. G. Ganseman and T. Prajogo, “An Integrated Friction Model Structure with Improved Presliding Behavior for Accurate Friction Compensation,” IEEE Transactions on Automatic Control, Vol. 45, No. 4, 2000, pp. 675-686. doi:10.1109/9.847103
- P. Dupont, V. Hayward, B. Armstrong and F. Altpeter, “Single State Elastoplastic Friction Models,” IEEE Transactions on Automatic Control, Vol. 47, No. 5, 2002, pp. 787-792. doi:10.1109/TAC.2002.1000274
- H. Yanada and Y. Sekikawa, “Modeling of Dynamic Behaviors of Friction,” Mechatronics, Vol. 18, No. 7, 2008, pp. 330-339. doi:10.1016/j.mechatronics.2008.02.002
- H. Yanada, K. Takahashi and A. Matsui, “Identification of Dynamic Parameters of Modified LuGre Model and Application to Hydraulic Actuator,” Transactions of the Japan Fluid Power System Society, Vol. 40, No. 4, 2009, pp. 57-64. doi:10.5739/jfps.40.57
- X. B. Tran, A. Matsui and H. Yanada, “Effects of Viscosity and Type of Oil on Dynamic Behaviors of Friction of Hydraulic Cylinder,” Transactions of the Japan Fluid Power System Society, Vol. 41, No. 2, 2010, pp. 28-35.
- X. B. Tran, N. Hafizah and H. Yanada, “Modeling of Dynamic Friction Behaviors of Hydraulic Cylinders,” Mechatronics, Vol. 22, No. 1, 2012, pp. 65-75. doi:10.1016/j.mechatronics.2011.11.009
- G. Li, C. Zhang, J. Luo, S. Liu, G. Xie and X. Lu, “FilmForming Characteristics of Grease in Point Contact under Swaying Motions,” Tribology Letters, Vol. 35, No. 1, 2009, pp. 57-65. doi:10.1007/s11249-009-9433-7
- J. Sugimura, W. R. Jones, Jr. and H. A. Spikes, “EHD Film Thickness in Non-Steady State Contacts,” Journal of Tribology, Vol. 120, No. 3, 1998, pp. 442-453. doi:10.1115/1.2834569
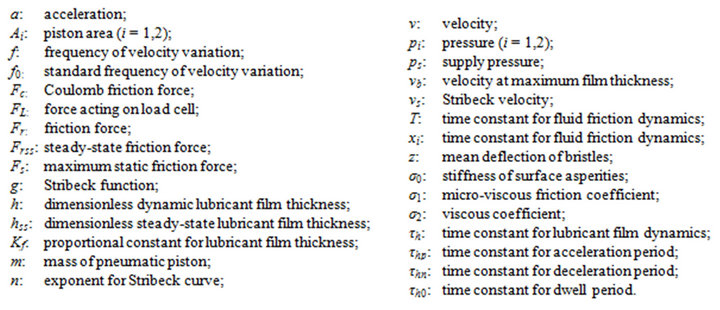
Nomenclature