Materials Sciences and Applications
Vol.3 No.7(2012), Article ID:21165,7 pages DOI:10.4236/msa.2012.37067
Study of a Model Humic Acid-Type Polymer by Fluorescence Spectroscopy and Atomic Force Microscopy
![]()
1Universidade Tecnológica Federal do Paraná, Campo Mourão, Brazil; 2Universidade Federal de São Carlos, Sorocaba, Brazil; 3Universidade Estadual de Ponta Grossa, Ponta Grossa, Brazil; 4Embrapa Instrumentação Agropecuária, São Carlos, Brazil.
Email: *fabioleite@ufscar.br
Received April 21st, 2012, revised May 22nd, 2012; accepted June 17th; 2012
Keywords: Humic Substances; Synthetic Humic Acids; Metal Complexes; AFM; Fluorescence Spectroscopy
ABSTRACT
A model HA-type polymer of para-benzoquinone synthetic humic acid (SHA) and its complexes with copper, iron and manganese metal ions were studied using atomic force microscopy (AFM). Natural humic acids (HA) and synthetic humic acids (SHA) were examined by fluorescence spectroscopy, which indicated similarity of SHA and HA spectra. The AFM images of SHA and its complexes revealed variable morphologies, such as small spheres, aggregates and a sponge-like structure. The SHA complexes displayed morphologies similar to those of natural HA. The presence of copper, iron and manganese ions led to the formation of aggregate-type structures in an apparent arrangement of smaller SHA particles.
1. Introduction
Humic substances (HS) have been the object of numerous studies. Because of their ability to interact with various components of the environment, HS play an important role in soil and aquatic chemistry. In humic substances, humic acid (HA, insoluble at acidic pH) and fulvic acid (FA, water soluble at acidic to alkaline pH) are the major fractions in the presence of various chemically reactive functional groups, including carboxyls, phenolic and alcoholic hydroxyls, with pH-dependent properties [1,2]. However their chemical nature and reactivity are still little understood. Several researchers [3-5] have suggested a new model for the polymeric structure of HS developed through size-exclusion chromatography, in which small and heterogeneous humic molecules are self-assembled in supramolecular conformations stabilized only by weak forces, such as dispersive interactions (van der Waals, π-π, and CH-π bonding) and hydrogen bonding. Recognition studies of the pathway of humic acids formation compare the chemical properties of natural humic acids with those of synthetic humic acidtype polymers. These studies have been an important tool to elucidate the overall molecular structure of soil organic matter.
Characterization of the size, shape, conformation, structure and composition of HS is crucial to understand the physicochemical reactions and to evaluate their role in the natural environment. HS can be characterized by X-ray fluorescence spectroscopy (XRF) and AFM. Fluorescence spectroscopy has become widely recognized as a relatively simple, sensitive, and powerful tool for the evaluation of humification [6-11] and the molecular size of humic substances [12,13]. Its use is supported by the established presence of various fluorescent structures intrinsic to the humic molecule [14]. MacCarthy [15] postulated that humic substances are unique in nature and have qualities unlike any other natural substances. The first principle postulates that humic substances represent a super mixture of an extremely wide array of chemical structures. In all likelihood, the probability of finding two identical structures is exceedingly remote [16].
Atomic force microscopy (AFM) can provide information on the structure of interfaces and on interparticle forces. Ksenija Namjesnik-Dejanovic and Patricia A. Maurice [17] recorded AFM images of FA from river water and reported the presence of four main structures. At low concentrations, sponge-like structures consisting of rings (~15 nm in diameter) appeared, along with small spheres (10 - 50 nm). At higher concentrations, aggregates of spheres formed branches and chain-like assemblies. Chen [18] investigated macromolecular structures of humic substances by combining AFM with SEM. The author reported that, depending on the pH and ionic strength of the initial solutions, humic substances deposited on mica and silica adopted different spherical and large-area island conformations.
To determine the structural similarity of natural humic acid (HA) and synthetic humic acid (SHA), we used fluorescence spectroscopy and atomic force microscopy to study the influence of the aforementioned metallic ions on the structure of a polymer model.
2. Experimental
2.1. Sample Preparations
Humic acid (HA) was extracted from Paleudult soil, following the methodology recommended by the International Humic Substances Society (IHSS) (http://ihss.gatech.edu/ihss2/soilhafa.html).
The polymer (SHA) was prepared with 5.4 g of parabenzoquinone dissolved in 60 mL of water containing 2.8 g of KOH. The solutions were placed in bottles and a stream of purified air was bubbled into them at a rate of 1 L·min–1. Air was purified by first passing it through solid NaOH pellets and then bubbling it in a solution of 0.8 mol·L–1 NaOH. After 22 h of air bubbling, the resulting black viscous solutions were treated with 6 mL of concentrated hydrochloric acid under mechanical stirring until blackish brown mass was precipitated. The polymer products were collected by vacuum filtration, washed repeatedly with deionized water and dried for one day in air and then for one day at 60˚C.
Complexes of the SHA polymer substance with Cu2+, Fe3+ and Mn2+ ions were prepared by adding 0.1 g of each polymer to 40 mL of a 0.10 mol·L–1 solution of each metal sulfate. The suspensions were shaken for 16 h. The samples were then centrifuged at 2200 rpm for 20 min and the supernatant discarded. Deionized water (10 mL) was added, the solids were shaken for 2 min and again centrifuged at 2200 rpm for 20 min, and the supernatant was discarded. This washing procedure was repeated twice and the purified products were collected, freezedried and lyophilized.
AH suspensions were prepared in an aqueous solution and shaken for three days away from light. These suspensions were prepared with a concentration of 100 mg·L and their pH were adjusted to 3.5. Suspensions were prepared of natural humic acid (HA), synthetic humic acid (SHA) and SHA with complexed metals (SHA-Cu, SHAFe, SHA-Mn).
The samples were fixed on untreated mica slides as substrate. The HA samples were fixed on newly cleaved mica slides in a diluted aqueous suspension of HA (100 mg·L–1), which was shaken for one day. The pH of the HA solution was adjusted to 3.5 using HCl 0.01 mol·L–1. After shaking, the slides were washed with Milli-Q water and allowed to dry on Petri dishes in a desiccator for approximately 12 hours, after which they were analyzed by AFM.
2.2. Elemental Analysis
The samples’ elemental composition of nitrogen, carbon, hydrogen and sulfur content was determined using a CHNS-O analyzer (CE-Instruments EAGER 200). The oxygen level was determined based on the difference from 100%, discounting ash levels in the lyophilized samples. The ash content was determined by gravimetry, weighing and calcining approximately 10 mg of humic acid (HA and SHA) in a platinum crucible at a temperature of 600˚C until it reached a constant mass.
2.3. Fluorescence Spectroscopy Measurements
Fluorescence spectra were recorded from 0.050 mol·L–1 NaHCO3 solutions of SHA samples at a concentration of 10 mg·L–1 and adjusted to pH 8 by adding of small amounts of diluted HCl. Fluorescence spectra in excitation and emission modes were recorded on a Perkin Elmer LS-50B luminescence spectrophotometer. In all the experiments, the emission slits were set at a 10 nm band, and a scan speed of 120 nm/min was selected for both monochromators. Excitation spectra were recorded in the range of 200 - 480 nm at a constant emission wavelength of 510 nm, while emission spectra were recorded in the range of 350 - 600 nm at a constant excitation wavelength of 330 nm.
2.4. Atomic Force Microscopy Measurements
AFM images were recorded with a Topometrix Discoverer TMX 2010 atomic force microscope using cantilevers of silicon nitride (V shaped) with a spring constant of (0.05 ± 0.01) N/m and tip curvature radius of (28 ± 4) nm (experimental values). Measurements of the length, width and thickness of the cantilever and tip radius were taken using a Philips XL30-FEG Scanning Electron Microscope (SEM), as described by Leite et al. [19]. All the images were recorded in the contact mode at a scan rate of 2 Hz. The root-mean-square roughness, Rrm, was calculated using Nanotec Electronica S.L. WSxM 4.0 software (Copyright© November 2003) [20]. The images were recorded in ambient conditions at 25˚C and a relative humidity of 25% ± 2%.
3. Results and Discussion
3.1. Obtaining Natural and Synthetic Humic Acids
The natural humic acid was extracted from Paleudult soil and 710.5 mg of humic acid per 0.08 kilogram of soil were obtained.
It is known that polyhydroxy phenols, as well as hydroquinones and quinones such as para-benzoquinone, are highly sensitive to the action of aqueous alkali solution, yielding polymeric products known as synthetic humic acids (SHA) [21]. The reason for synthesizing these polymers was that the information obtained from these synthetic precursors can be used to shed light on the complex structure of natural humic acids.
The SHA polymer formed from the para-benzoquinone reaction provides a compound composed mostly of polyhydroxy phenols, in which the main adsorbing groups are -OH and -COOH. This structure can be described by a sequence of phenyl rings having three hydroxyl groups per ring intercalated by monohydroxylated quinone units (Figure 1). The presence of the carboxylic group is derived from the degradation of the aromatic ring during polymerization. This structure is similar to lignin, one of the major constituents of the organic matter of soil [21].
The SHA synthesis presented an excellent performance, yielding 76.36% in weight of polymerized parabenzoquinone.
3.2. Elemental Analysis
The results of the elementary analysis and ash content are shown in Table 1. The SHA showed a high amount of oxygen exceeding 40% (values calculated by difference), similar to the amount found in HA, whose oxygen content also exceeded 40%. According to Schnitzer & Khan [22], humic acids have an average elemental composition of 53.8% - 58.7% carbon, 3.2% - 6.2% hydrogen, 32.8% - 38.3% oxygen, 0.8% - 4.3% nitrogen and 0.1% - 1.5% sulfur. These values are similar to those found by HA extraction. The synthesized polymers differ only in the values described by Schnitzer & Khan [22] for SHA sulfur and nitrogen content, which was expected due to the precursor compounds.
3.3. Fluorescence Study
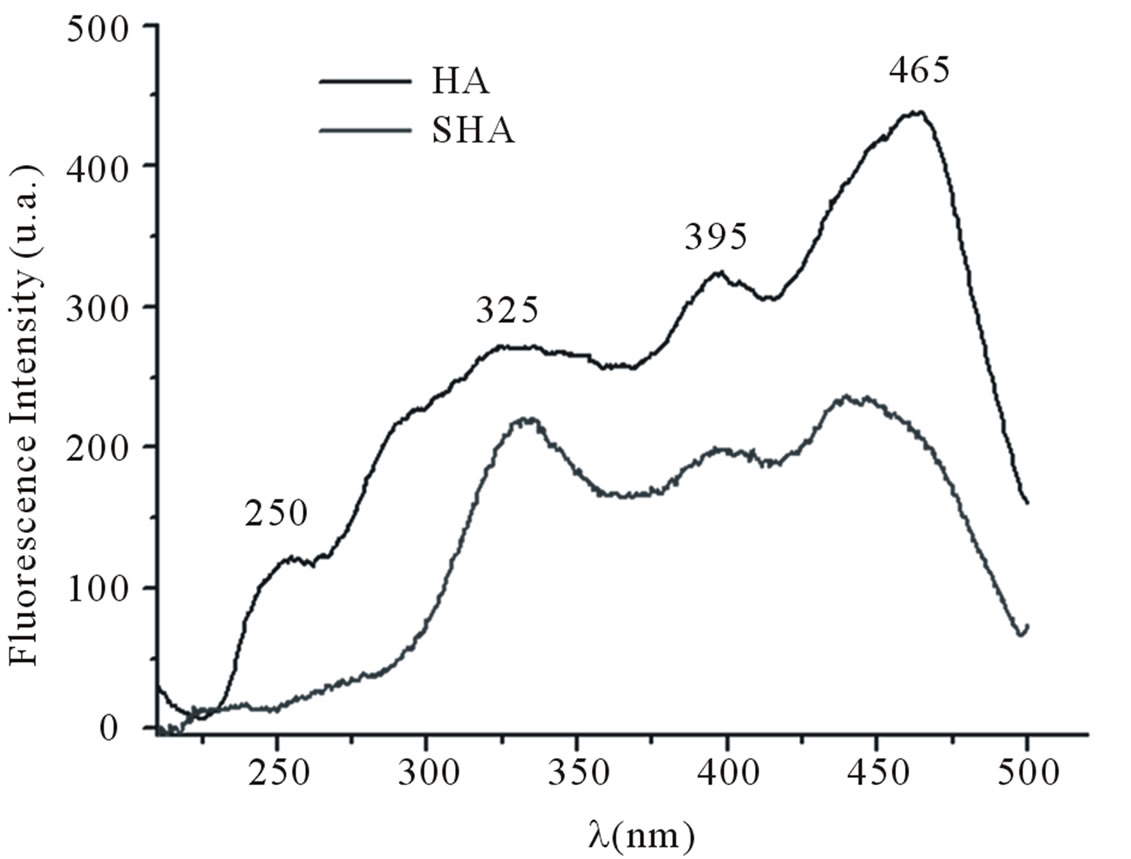
The spectra in Figure 2(a) show four bands at 250, 325, 395 and 465 nm corresponding to the samples of humic acid (HA) isolated from soil and synthetic humic acid (SHA). Figure 2(b) shows the fluorescence emission spectra. The spectra present a band at 370 nm and a broad band at 429 nm. The fluorescence of HA at wavelengths shifted toward the red end of the visible spectrum,
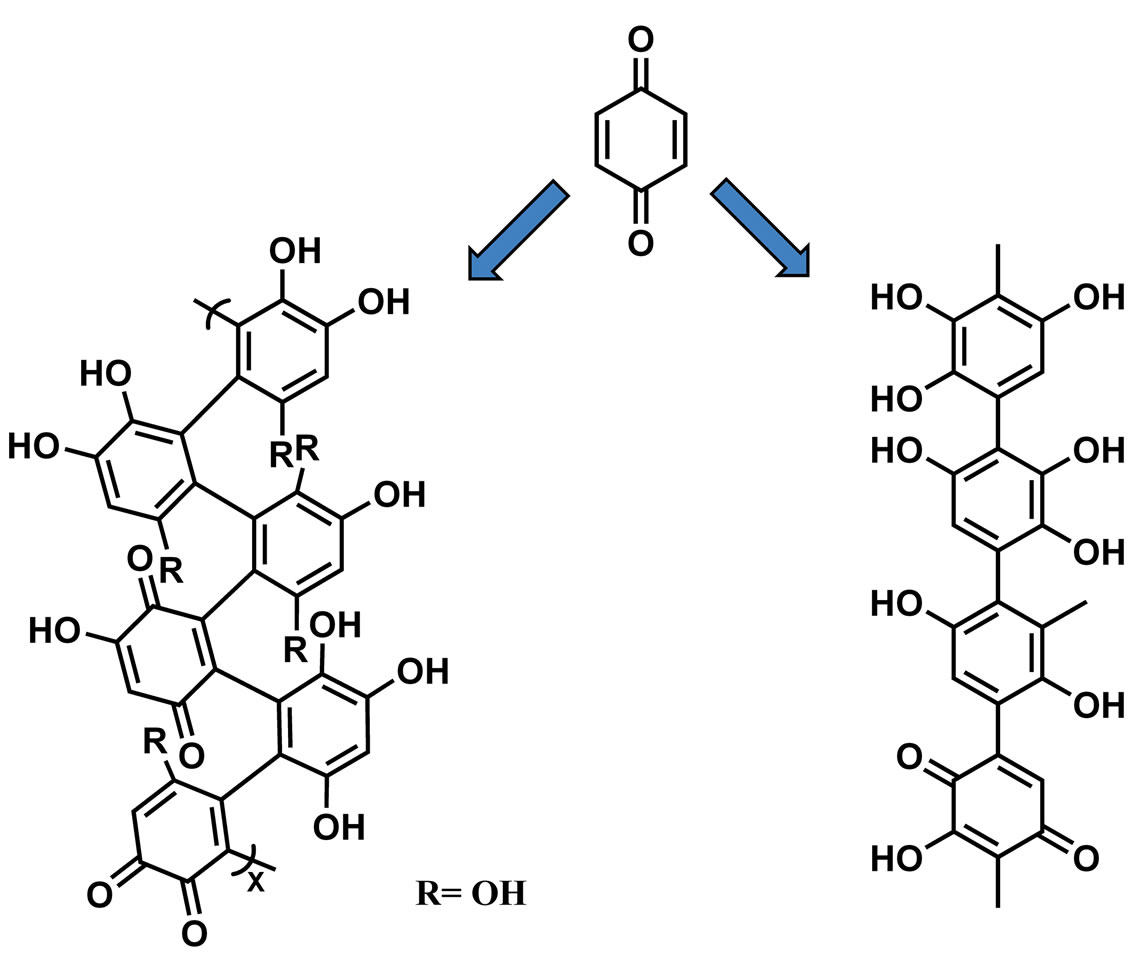
Figure 1. SHA obtained by oxidative polymerization in alkali. Adapted from ref [21].
as in this case, is associated with conjugated unsaturated systems (tetracene-type linear or perylene-type cyclic condensed aromatic hydrocarbons) and/or with aromatic nuclei highly substituted by C=O and COOH groups. The fluorescence of SHA at wavelengths shifted toward the red end of the visible spectrum revealed the compound’s structural similarity to HA. This similarity may be related to the existence of a conjugated unsaturated system, in this case the carbonyl group (C=O) conjugated with an ethylene group (C=C). Senesi et al. [14] examined excitation spectra of humic and fulvic acids from numerous sources and concluded that, despite spectral differences, the regular occurrence of some peaks suggested that there were three common spectral regions in which fluorescence was likely to occur, at long wavelengths (480 - 440 nm), intermediate wavelengths (400 - 380 nm) and short wavelengths (360 - 300 nm). According to Senesi et al. [14,23], the peaks at longer wavelengths can be attributed to the presence of substituents such as carbonyl and carboxyl groups.
The spectra indicate that there are structural similarities between the HA sample and the sample of humic acid synthesized from para-benzoquinone (SHA). These similarities are due to the fact that the SHA sample has bands associated with aromatic carbons in phenolic rings (CH, COOH and phenolic compounds) resulting from the precursor used in its synthesis.
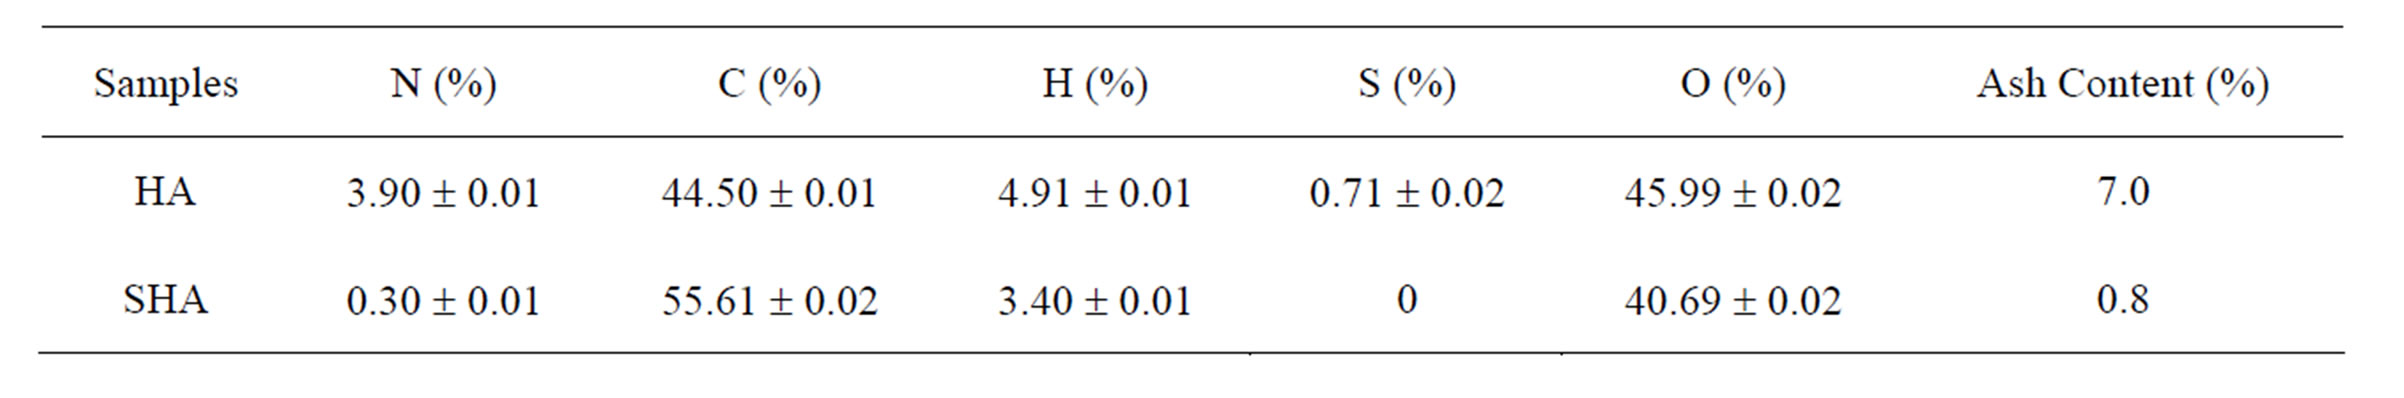
Table 1. Elemental composition of humic acid (HA) isolated from soil and synthetic humic acid (SHA).
 (a)
(a)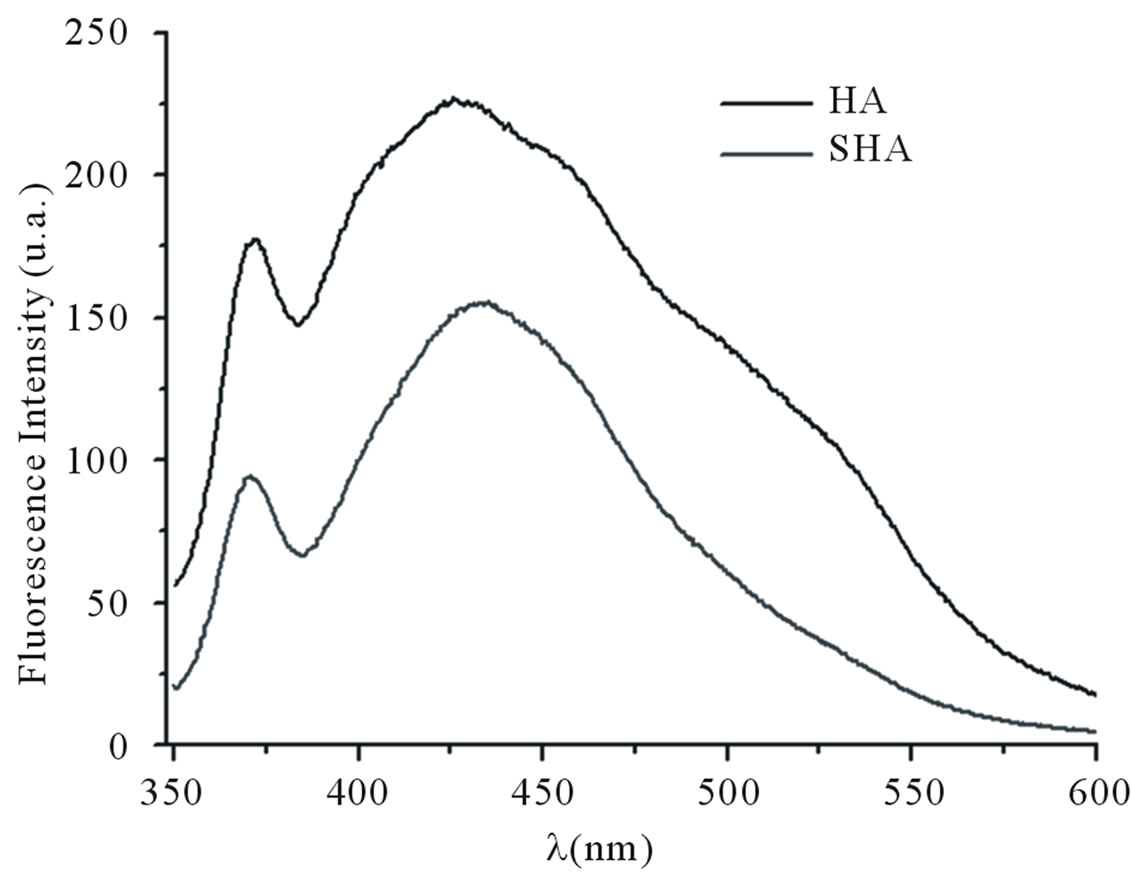 (b)
(b)
Figure 2. (a) Fluorescence excitation spectra recorded at a fixed wavelength for emission (λem = 510) of humic acid and synthetic humic acids; (b) Fluorescence emission spectra recorded at a fixed wavelength for excitation (λexc = 330) of humic acid and synthetic humic acids.
3.4. Atomic Force Microscopy Study
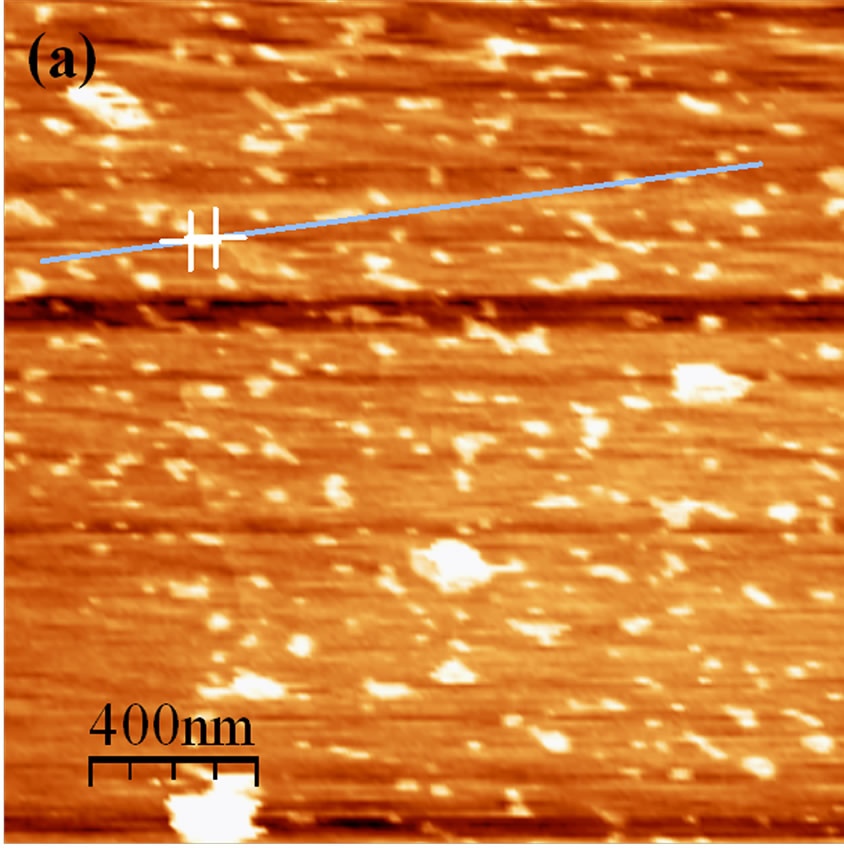
The image in Figure 3 shows HA adsorbed on mica at pH 3.5, recorded in the contact mode. Note the small particles distributed over the surface of the mica, as well as some aggregates. There is a visible tendency for interaction among the adsorbed particles, indicating intermolecular associations between the HA molecules at low values of pH. The adsorbed HA particles have a diameter of ~60 - 80 nm. The size and shapes of spherical colloids are in agreement with those observed by AFM [18,24]. The aggregates appearing in the image vary in size from 100 to 216 nm. Working with lyophilized soil HA samples, Liu et al. [25] demonstrated that 90% of HA formed islands with a height of 4.2 - 5.7 nm, while airdried samples showed heights of 3.1 to 3.7 nm. Based on these results, the authors proposed that HA molecules
 (a)
(a)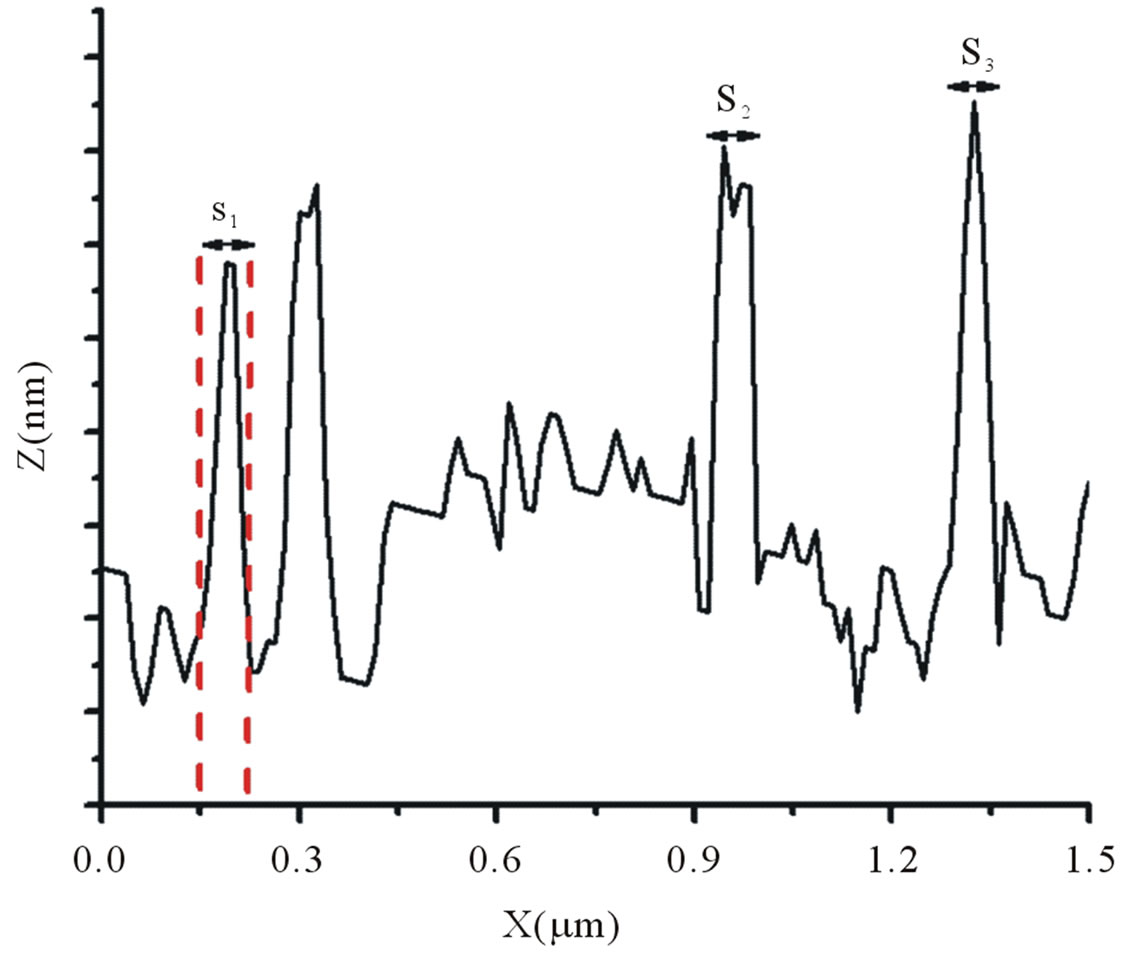 (b)
(b)
Figure 3. AFM image of HA adsorbed on mica at pH 3.5 recorded in the contact mode (2 × 2 µm) with cross-section analysis of the particles in the HA image.
form monolayer islands on the mica surface. Using HA at pH 4.0 with 0.01 M NaNO3, Chen et al. [18] found colloid diameters of <100 nm and heights in the interval of 0.5 to 7 nm.
The synthetic humic acid was investigated in the same experimental conditions as the humic acid extracted from soil. Figure 4 shows an image of the SHA. This image shows irregular rod and oval shapes, and again, a tendency to aggregation. The particles in this image present lengths of 100 to 150 nm and diameters of 20 to 50 nm.
The electrostatic repulsion of the ionizable COOH and OH groups favors an elongated conformation of the HA molecules at higher values of pH and low ionic strength. On the other hand, an increase in ionic strength or a derease in pH favor a more globular conformation of the HA molecules due to charge shielding. Under these conditions, intermolecular interactions among the molecules
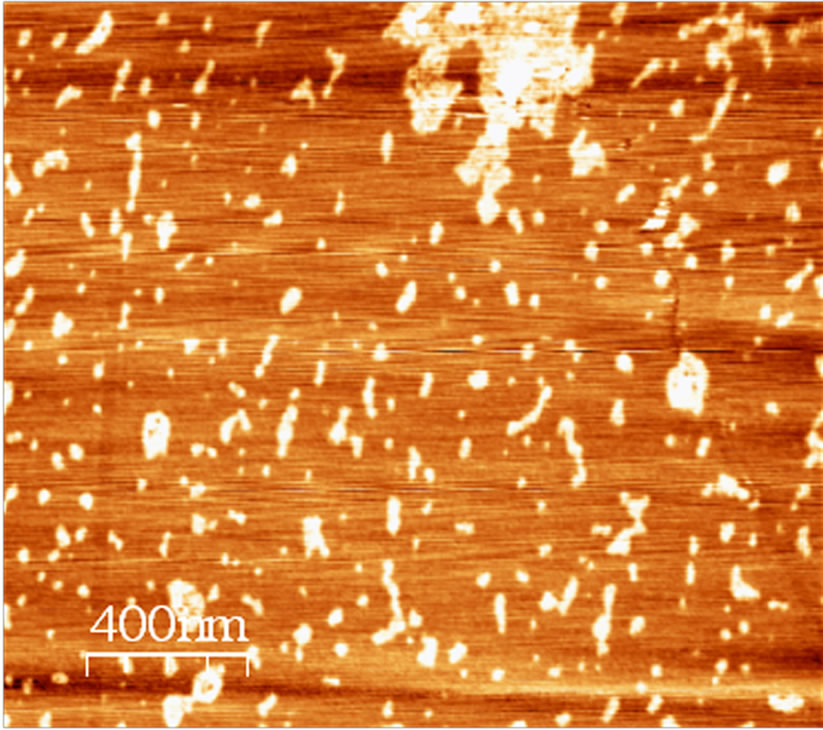
Figure 4. AFM image of SHA adsorbed on mica at pH 3.5, recorded in contact mode (2 × 2 µm).
e favored, leading to the formation of humic acid aggregates [26]. AFM images of the aquatic fulvic acid [27] from a Brazilian river showed that aggregates were identified at pH 3.0 and exhibited an open structure at pH 9.0. With increasing pH, the AFA particles expanded and repelled each other electrostatically [28].
Figure 5 depicts the morphological changes of SHA in the presence of the metal ions Cu2+, Fe3+ and Mn2+. In the presence of Cu2+ ions, the material formed only a few scattered aggregates with globular-shaped structures. Some particles with diameters in the range of 140 - 150 nm dispersed over the mica surface are also visible (Figure 5(a)). The complex with iron ions exhibited the same behavior (Figure 5(b)), with agglomerates displaying lateral diameters of 107 nm. The complex with manganese (Figure 5(c)) also showed the formation of aggregates, but exhibited a larger number of particles widely dispersed over the mica surface, with particle diameters of about 70 - 80 nm. The images of the complex with manganese show not only spherical particles but also cone-shaped particles, which were not observed in the complexes with copper and iron.
The variable morphologies of SHA and SHA complexes observed by AFM are consistent with data reported in the literature, such as small spheres, aggregates of spheres, and sponge-like structures [24,29]. The SHA complexes display a similar morphology to that of HA. The presence of copper, iron and manganese metal ions led to the formation of aggregate-type structures in an arrangement of smaller particles in the case of SHA. Baalousha et al. [30] also reported that there was initial decrease in Leonardite humic acid (a brown coal) aggregate size when a small amount of metal ions (Na+, Mg2+, Sm3+) was added. However, further additions of metal ions resulted in an increase in aggregate size. They reported a decrease in the size of humic substances in response to the compaction of individual humic acid molecules due to intramolecular contraction through surface charge neutralization and cross-linking of humic acid. Furthermore, they suggested that the addition of more metal ions leads to intermolecular associations, and thus, to an increase in aggregate size.
Ghosh et al. [31] studied the colloidal behavior of aluminum oxide nanoparticles (NPs) as a function of pH and in the presence of two structurally different humic acids (HAs), Aldrich HA (AHA) and the seventh HA fraction extracted from Amherst peat soil (HA7). AFM imaging revealed the presence of long-chain fractions in HA7, which entangled with the NPs to form large aggregates. The association of HA with the NP surface can be assumed to follow a two-step process, possibly the polar fractions of the HA7 adsorbed on the NP surface, followed by entanglement with the long-chain fractions. Thus, the authors demonstrated that the hydrophobic nature of HA molecules strongly influenced the aggregation of colloidal NPs, possibly through their conformational behavior in a particular solution condition.
The morphological differences in the images of the SHA complex indicate a difference in the chemical functionalities of the species. This may affect the physicochemical behavior of humic colloids, e.g., binding forces at the surface of minerals, complexation with metal ions, or aggregation behavior.
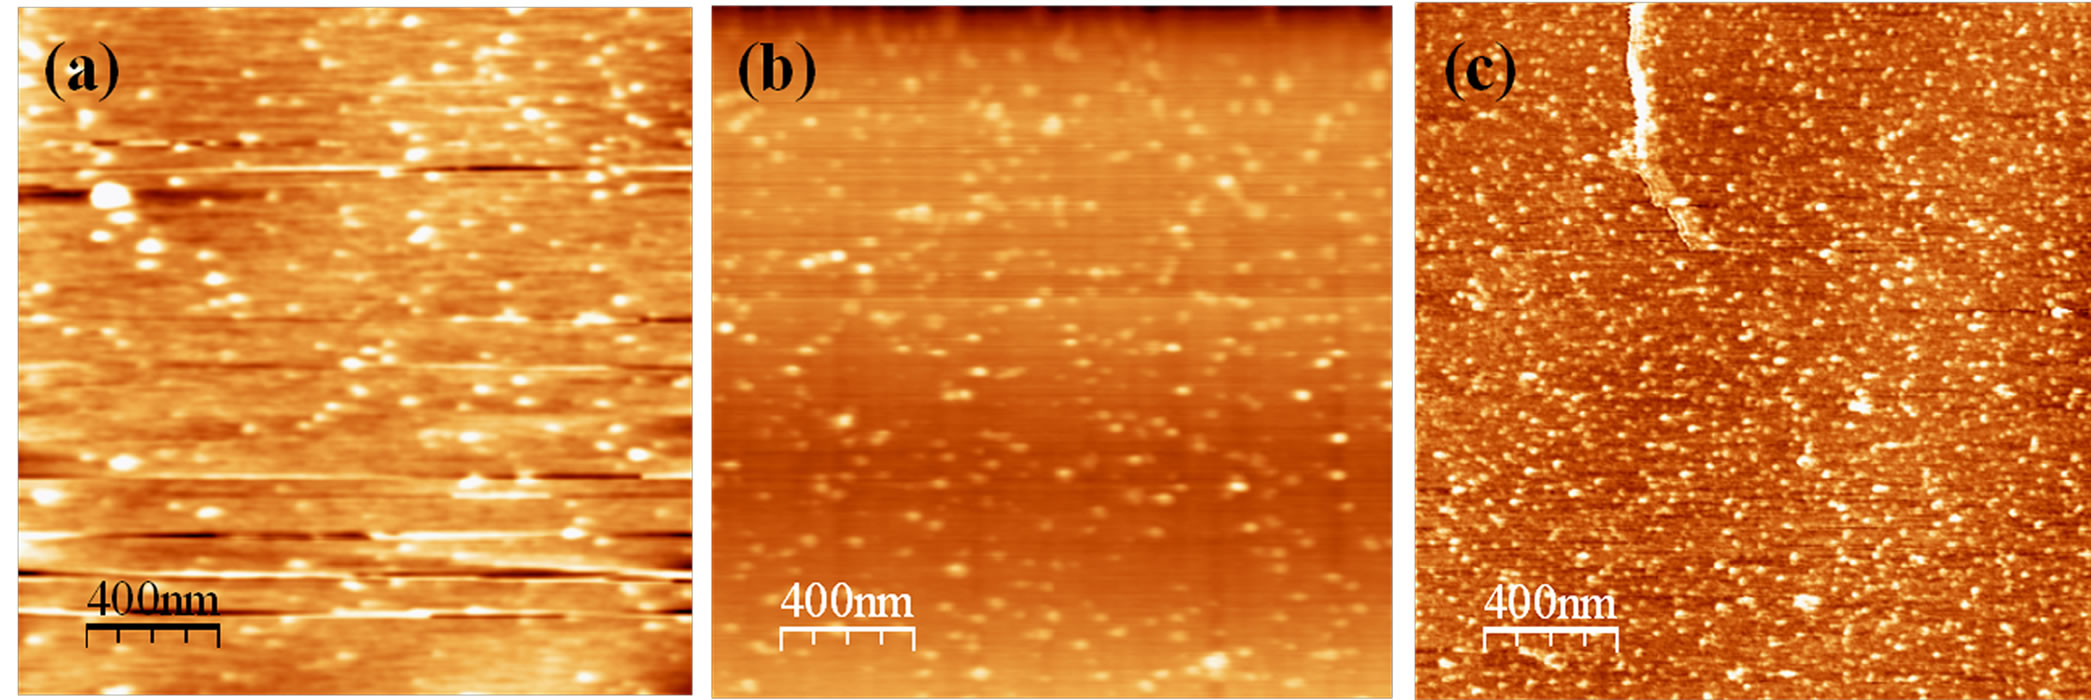
Figure 5. AFM images of SHA with complexed metals: (a) copper (SHA-Cu); (b) iron (SHA-Fe); and (c) manganese (SHAMn), adsorbed on mica at pH 3.5, recorded in contact mode.
One aspect is the formation of aggregates adsorbed on the substrate in the presence of metal ions, suggesting their influence on the phenomenon of HA adsorption and aggregation. A general notion to explain the aggregation of HA is based on the neutralization of surface charges. A reduction in pH, an increase in ionic strength or the addition of polyvalent cations neutralizes the natural negative surface charge of HA responsible for interparticle repulsion, enabling the particles to aggregate. In the case of polyvalent cations, bridging between the cations and negatively charged HA colloids can be suggested as a plausible mechanism of aggregation (AH···Me+···AH) [24].
4. Conclusions
Fluorescence spectroscopy of SHA revealed its structural similarity to HA. This resemblance is probably due to the presence of abundant OH groups, and these bands are likely associated to phenolic type structures.
In this study, AFM was employed to analyze the macromolecular structures and shapes of soil humic acid and synthetic humic acids at low pH. The AFM images of the HA and synthetic humic acid (SHA) molecules adsorbed on the mica substrate exhibited globular structures. Interaction among the SHA particles was also observed after complexation of the metal ions (Fe3+, Cu2+ e Mn2+), which led to the formation of aggregate-type structures. However, additional studies are needed to determine the changes in the structures of humic acid.
5. Acknowledgements
The authors acknowledge CAPES (Coordenação de Aperfeiçoamento de Pessoal de Nível Superior) and CNPq (Conselho Nacional de Desenvolvimento Científico e Tecnológico) process 302756/2009-4 for their financial support, and EMBRAPA (Empresa Brasileira de Pesquisa Agropecuária) for its structural support of this work.
REFERENCES
- F. F. J. Stevenson, “Humus Chemistry: Genesis, Composition, Reactions,” John Wiley and Sons, New York, 1994.
- K. Ramus, F. D. Kopinke and A. Georgi, “Influence of Dissolved Humic Substances on the Mass Transfer of Organic Compounds across the Air-Water Interface,” Chemosphere, Vol. 86, No. 2, 2012, pp. 138-143. doi:10.1016/j.chemosphere.2011.09.055
- A. Piccolo and P. Conte, “Molecular size of Humic Substances. Supramolecular associations versus Macromolecular Polymers,” Advances in Environmental Research, Vol. 3, No. 4, 2000, pp. 508-521.
- A. Piccolo, S. Nardi and G. Concheri, “Micelle-Like Conformation of Humic Substances as revealed by Size Exclusion Chromatography,” Chemosphere, Vol. 33, No. 4, 1996, pp. 595-602. doi:10.1016/0045-6535(96)00210-X
- A. Piccolo, S. Nardi and G. Concheri, “Macromolecular changes of Humic Substances Induced by Interaction with Organic Acids,” European Journal of Soil Science, Vol. 47, No. 3, 1996, pp. 319-328. doi:10.1111/j.1365-2389.1996.tb01405.x
- C. M. Favoretto, D. Goncalves, D. Milori, J. A. Rosa, W. C. Leite, A. M. Brinatti and S. D. Saab, “Determination of Humification Degree of Organic Matter of an oxisol and of Its Organo-Mineral Fractions,” Quimica Nova, Vol. 31, No. 8, 2008, pp. 1994-1996. doi:10.1590/S0100-40422008000800015
- K. Kalbitz, W. Geyer and S. Geyer, “Spectroscopic properties of Dissolved Humic Substances—A Reflection of land Use History in a Fen Area,” Biogeochemistry, Vol. 47, No. 2, 1999, pp. 219-238. doi:10.1007/BF00994924
- D. Milori, L. Martin-Neto, C. Bayer, J. Mielniczuk and V. S. Bagnato, “Humification degree of Soil Humic Acids Determined by Fluorescence Spectroscopy,” Soil Science, Vol. 167, No. 11, 2002, pp. 739-749. doi:10.1097/00010694-200211000-00004
- A. Zsolnay, E. Baigar, M. Jimenez, B. Steinweg and F. Saccomandi, “Differentiating with Fluorescence Spectroscopy the sources of Dissolved Organic Matter in soils subjected to drying,” Chemosphere, Vol. 38, No. 1, 1999, pp. 45-50. doi:10.1016/S0045-6535(98)00166-0
- H. B. Yu, B. D. Xi, W. C. Ma, D. L. Li and X. S. He, “Fluorescence Spectroscopic Properties of Dissolved Fulvic Acids from Salined Flavo-aquic Soils around Wuliangsuhai in Hetao Irrigation District, China,” Soil Science Society of America Journal, Vol. 75, No. 4, 2011, pp. 1385-1393. doi:10.2136/sssaj2010.0373
- L. T. Shirshova, A. L. Kholodov, B. N. Zolotareva, L. A. Fominykh and A. M. Yermolayev, “Fluorescence Spectroscopy Studies of Humic Substance Fractions Isolated from Permanently Frozen Sediments of Yakutian Coastal Lowlands,” Geoderma, Vol. 149, No. 1-2, 2009, pp. 116- 123. doi:10.1016/j.geoderma.2008.11.026
- J. J. Alberts and M. Takacs, “Comparison of the Natural Fluorescence Distribution among Size Fractions of terrestrial fulvic and Humic Acids and Aquatic Natural Organic Matter,” Organic Geochemistry, Vol. 35, No. 10, 2004, pp. 1141-1149. doi:10.1016/j.orggeochem.2004.06.010
- J. J. Alberts and M. Takacs, “Total Luminescence Spectra of IHSS standard and Reference Fulvic Acids, Humic Acids and Natural Organic Matter: Comparison of aquatic and Terrestrial Source Terms,” Organic Geochemistry, Vol. 35, No. 3, 2004, pp. 243-256. doi:10.1016/j.orggeochem.2003.11.007
- N. Senesi, T. M. Miano, M. R. Provenzano and G. Brunetti, “Characterization, differentiation, and classification of Humic Substances by Fluorescence Spectroscopy,” Soil Science, Vol. 152, No. 4, 1991, pp. 259-271. doi:10.1097/00010694-199110000-00004
- P. MacCarthy, “Soil Sampling and Methods of Analisys,” CRC Press, Boca Raton, 2008.
- D. W. Anderson and J. J. Schoenau, “Soil Humus Fractions,” In: M. R. Carter and E. G. Gregorich. Eds., Soil Sampling and Methods of Analisys, CRC Press, Boca Raton, 2007, pp. 675-680.
- P. A. Maurice and K. Namjesnik-Dejanovic, “Aggregate structures of Sorbed Humic Substances Observed in Aqueous Solution,” Environmental Science & Technology, Vol. 33, No. 9, 1999, pp. 1538-1541. doi:10.1021/es981113+
- C. L. Chen, X. K. Wang, H. Jiang and W. P. Hu, “Direct observation of Macromolecular Structures of Hurnic Acid by AFM and SEM,” Colloids and Surfaces a-Physicochemical and Engineering Aspects, Vol. 302, No. 1-3, 2007, pp. 121-125.
- F. L. Leite, A. Riul and P. S. P. Herrmann, “Mapping of Adhesion Forces on Soil Minerals in air and water by Atomic Force Spectroscopy (AFS),” Journal of Adhesion Science and Technology, Vol. 17, No. 16, 2003, pp. 2141- 2156. doi:10.1163/156856103772150751
- I. Horcas, R. Fernandez, J. M. Gomez-Rodriguez, J. Colchero, J. Gomez-Herrero and A. M. Baro, “WSXM: A software for Scanning Probe Microscopy and a tool for nanotechnology,” Review of Scientific Instruments, Vol. 78, No. 1, 2007, Article ID: 013705. doi:10.1063/1.2432410
- F. Cataldo, “On the structure of Macromolecules Obtained by Oxidative Polymerization of polyhydroxyphenols and quinones,” Polymer International, vol. 46, No. 4, 1998, pp. 263-268. doi:10.1002/(sici)1097-0126(199808)46:4<263::aid-pi983>3.0.co;2-0
- M. Schnitzer and S. U. Khan, “Soil Organic Matter,” Elsevier Scientific, Amsterdam, 1978.
- N. Senesi, V. D’Orazio and G. Ricca, “Humic acids in the First Generation of EUROSOILS,” Geoderma, Vol. 116, No. 3-4, 2003, pp. 325-344. doi:10.1016/S0016-7061(03)00107-1
- M. Plaschke, J. Romer, R. Klenze and J. I. Kim, “Influence of europium(III) on the adsorption of Humic Acid onto Mica Studied by AFM,” Surface and Interface Analysis, Vol. 30, No. 1, 2000, pp. 297-300. doi:10.1002/1096-9918(200008)30:1<297::AID-SIA789>3.0.CO;2-K
- A. G. Liu, R. C. Wu, E. Eschenazi and K. Papadopoulos, “AFM on Humic Acid Adsorption on mica,” Colloids and Surfaces a-Physicochemical and Engineering Aspects, Vol. 174, No. 1-2, 2000, pp. 245-252.
- E. Balnois, K. J. Wilkinson, J. r. Lead, and J. Buffle, “Atomic Force Microscopy of Humic Substances: Effects of pH and Ionic Strength,” Environmental Science & Technology, Vol. 33, No. 21, 1999, pp. 3911-3917. doi:10.1021/es990365n
- N. Pernodet, X. H. Fang, Y. Sun, A. Bakhtina, A. Ramakrishnan, J. Sokolov, A. Ulman and M. Rafailovich, “Adverse effects of Citrate/Gold Nanoparticles on human Dermal Fibroblasts,” Small, Vol. 2, No. 6, 2006, pp. 766-773. doi:10.1002/smll.200500492
- S. D. Saab, E. R. Carvalho, R. Bernardes, M. R. de Moura, L. Martin-Neto and L. H. C. Mattoso, “pH Effect in Aquatic Fulvic Acid from a Brazilian River,” Journal of the Brazilian Chemical Society, Vol. 21, No. 8, 2010, pp. 1490-1496. doi:10.1590/S0103-50532010000800012
- M. Plaschke, J. Romer, R. Klenze and J. I. Kim, “In situ AFM study of Sorbed Humic Acid Colloids at different pH,” Colloids and Surfaces a-Physicochemical and Engineering Aspects, Vol. 160, No. 3, 1999, pp. 269-279.
- M. Baalousha, M. Motelica-Heino and P. Le Coustumer, “Conformation and size of Humic Substances: Effects of Major Cation Concentration and type, pH, salinity, and residence time,” Colloids and Surfaces a-Physicochemical and Engineering Aspects, Vol. 272, No. 1-2, 2006, pp. 48-55.
- S. Ghosh, H. Mashayekhi, B. Pan, P. Bhowmik and B. Xing, “Colloidal Behavior of Aluminum Oxide Nanoparticles as Affected by pH and Natural Organic Matter,” Langmuir, Vol. 24, No. 21, 2008, pp. 12385-12391. doi:10.1021/la802015f
NOTES
*Corresponding author.