Materials Sciences and Applications
Vol. 4 No. 5 (2013) , Article ID: 31474 , 5 pages DOI:10.4236/msa.2013.45041
Effects of Thermal Conditions in the Phase Formation of Undoped and Doped Pb(Zr1−xTix)O3 Solid Solutions
![]()
1Laboratory of Applied Chemistry, Department of Science Matter, University of Biskra, Biskra, Algeria; 2University of Ouargla, Ouargla, Algeria.
Email: *aboutarfaia@yahoo.fr
Copyright © 2013 Zelikha Necira et al. This is an open access article distributed under the Creative Commons Attribution License, which permits unrestricted use, distribution, and reproduction in any medium, provided the original work is properly cited.
Received March 16th, 2012; revised April 19th, 2012; accepted April 30th, 2013
Keywords: Pb(Zr1−xTix)O3; Morphotropic Phase Boundary; Conventional Ceramic Method; Perovskite Phase
ABSTRACT
The purpose of this research is to study the effect of thermal conditions such as temperature ramp rate and isothermal times in the phase formation of Pb(Zr1−xTix)O3 solid solutions with composition near the morphotropic phase boundary (MPB) by using the conventional ceramic method. The perovskite phase formation and morphology of undoped Pb(Zr0.52Ti0.48)O3 (abbreviated PZT) and doped new material Pb0.98Gd0.02[(Zr0.52Ti0.48)0.98(Mg1/3Nb2/3)0.01(Ni1/3Sb2/3)0.01]O3 (abbreviated PZT-PGMNNS) specimens calcined between 700˚C and 900˚C have been examined by powder X-ray diffraction (XRD), scanning electron microscopy (SEM) and Fourier Transform Infrared (FTIR) while the thermal evolution of the initial precursor was followed by TG-DTA. So the results of these studies have been discussed.
1. Introduction
The solid solution of Pb(Zr1−x,Tix)O3, known as lead zirconate titanate (PZT), is one of the most studied ferroelectric materials in the past 40 years, especially because of its excellent dielectric, ferroelectric and piezoelectric properties [1-4]. The highest piezoelectric coefficients of PZT are found for compositions near the morphotropic phase boundary (MPB) between the tetragonal and rhombohedral regions of the compositiontemperature phase diagram [5,6]. Generally, the material of PZT is fabricated by a solid-state reaction among PbO, TiO2 and ZrO2 (ordinary dry method) by which the sequences of this reaction are today well known and several studies describe them very well [7-13]. Most authors agree that the solid state reaction usually begins by the formation of a highly tetragonal lead titanate solid solution, which the remaining PbO and ZrO2 react to form Pb(Zr1−xTix)O3. One version of the course of reaction is shown in Figure 1. [14], which shows the different phases present depending on the temperature.
The transformations undergone by the initial mixture oxides during its heat treatment can be simple or complex depending on the nature and the reactivity of the
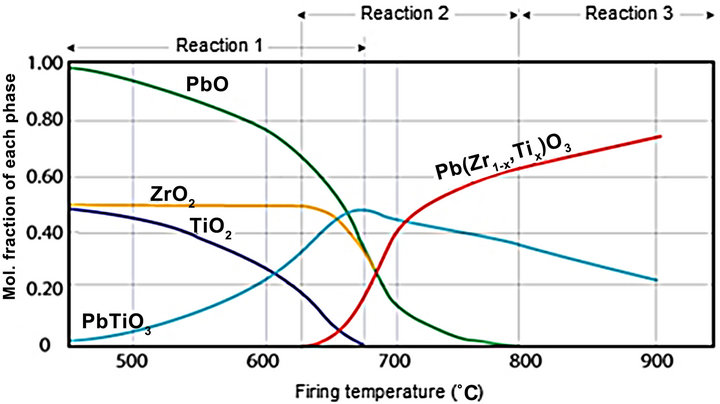
Figure 1. Phases in the system PbO:TiO2-PbO:ZrO2 as a function of firing temperature [14].
starting oxides (purity, structure, grain size, etc…) which choice of the composition of the reaction mixture, the addition of various dopants and the thermal conditions (heating/cooling rates and isothermal times) [15-18] that seem to have a great effect on the progress of the reaction including the formation of the desired final phase (PZT).
To define the thermal conditions that govern the reaction mechanism, it is necessary to use several techniques to determine unambiguously the final product formed. Therefore, the study is attempted to describe and to explain the thermal conditions which govern the phase formation of undoped and doped Pb(Zr1−xTix)O3 solutions, prepared by a conventional mixed-oxide method at various processing conditions like; calcination temperature; temperature ramp rates and isothermal times using different analysis techniques such as X-ray diffraction and thermal analysis techniques that are very often complete each other.
2. Experimental Procedure
The compositions that used in this study are Pb(Zr0.52Ti0.48)O3 (undoped PZT) and Pb0.98Gd0.02[(Zr0.52Ti0.48)0.98(Mg1/3Nb2/3)0.01(Ni1/3Sb2/3)0.01]O3 (doped PZT-PGMNNS) close to the morphotropic phase boundary (MPB). These systems were prepared by the conventional ceramic method. The starting raw materials in oxide form of high purity used were PbO (massicot, 99.0% purity, Biochem), ZrO2 (baddeleyute, 99.0% purity, Biochem), TiO2 (60.2% rutile and 39.8% anatase, 99.0% purity, Biochem), Gd2O3 (99.99% purity, Alfa Aesar) MgO (99.6% purity, Alfa Aesar), Nb2O5 (99.95% purity, Alfa Aesar) NiO (99.6% purity, Alfa Aesar) and Sb2O3 (>99.0% purity, Biochem).
For the preparation of PZT and PZT-PGMNNS precursors, the starting powders were weighted in the required stoichiometric ratio and then mixed in acetone medium for 24 h through a magnetic stirrer to achieve homogenization. After drying process, the mixed powders were crushed for 6 h in a mortar with a pestle. To ease the reactions in solid, the powders were pressed into13 mm in diameter and 2 mm thick pellets under uni-axial pressure of 750 MPa. The resultant specimens were calcined on alumina plates at temperatures between 700 and 900˚C. The chosen conditions of temperature ramp rates and duration (isothermal time) were varied from 2 to 10˚C min−1 and from 2 to 6 h, respectively.
After calcinations, the fired product was analyzed by X-ray diffraction (XRD: BRUKER-AXE, D8) using CuKα radiation. The results, i.e. peak positions; were compared with the information from the JCPDS database to identify the presence of the perovskite structure and phases present. The general morphology of the calcined specimens were observed by scanning electron microscopy (SEM: JEOL JSM-6390LV) at room temperature. Complementary analysis which confirm the formation temperature of the perovskite phase, such as thermal analyses (TG/DTA: L70/2171 Thyristor-Power Supply) from 25˚C to 900˚C at a heating rate of 10˚C min−1 and infrared analysis (FTIR: FTR-8400S SHIMADZU) in the 4000 - 400 rang using the KBr pellet technique (about 1 mg of sample and 200 mg of KBr were used for the preparation of the pellets) were performed.
3. Results and Discussion
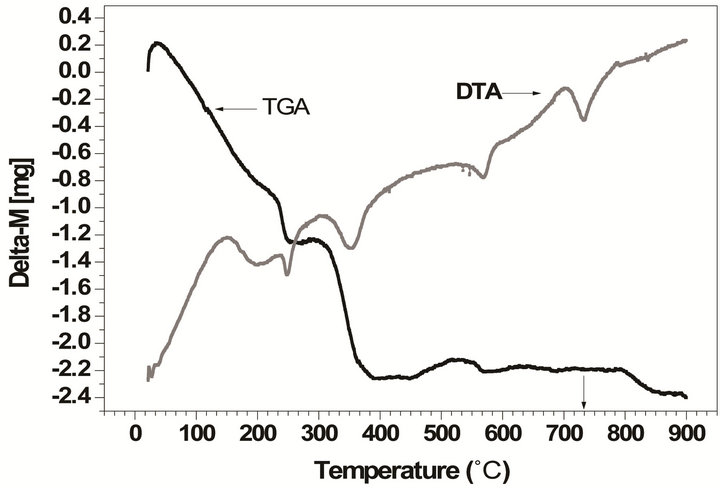
The thermal analyses (TG/DTA) provides additional information on the synthesis and the thermal conditions of the phase formation. Figure 2 displays the TG/DTA curves performed over the undoped and doped powder mixture compositions selected for this study.
These results confirm our good choice of the temperature range (between 700˚C and 900˚C) for samples calcinations. From these figures we deduce observe that the temperature of the perovskite phase formation is estimated between 700˚C and 750˚C, in correlation with an endothermic peak centered at ca. 730˚C (Figure 2(a)) which corresponds mainly to an oxygen loss resulting from the formation of the final perovskite phase for the undoped powder. While it is estimated at a higher temperature (750˚C to 850˚C (Figure 2(b)) in correlation with an endothermic peak centered at ca. 800˚C) for the doped powder which indicates that doping affects the temperature of the phase formation. These results are in agreement with FTIR and XRD results discussed below.
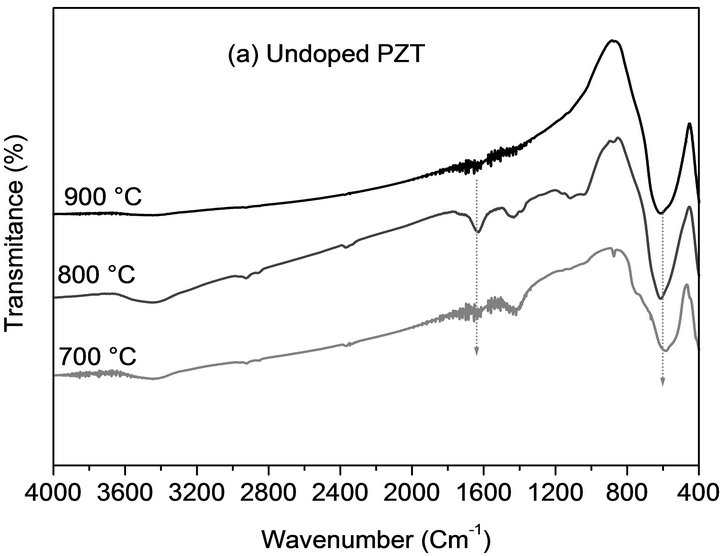
With FTIR analysis, it was possible to track the formation, as a function of calcination temperatures, of PZT’s ABO3 structure. Figure 3 presents the IR spectra, in the zone between 4000 and 400 cm−1 for all phases of undoped PZT and doped PZT-PGMNNS samples.
 (a)
(a)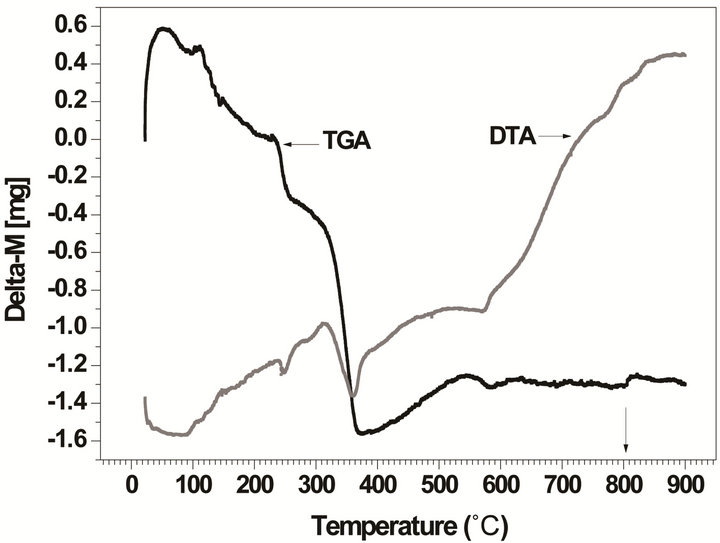 (b)
(b)
Figure 2. TG/DTA curves for the powder mixture compositions: (a) undoped powder; (b) doped powder.
 (a)
(a)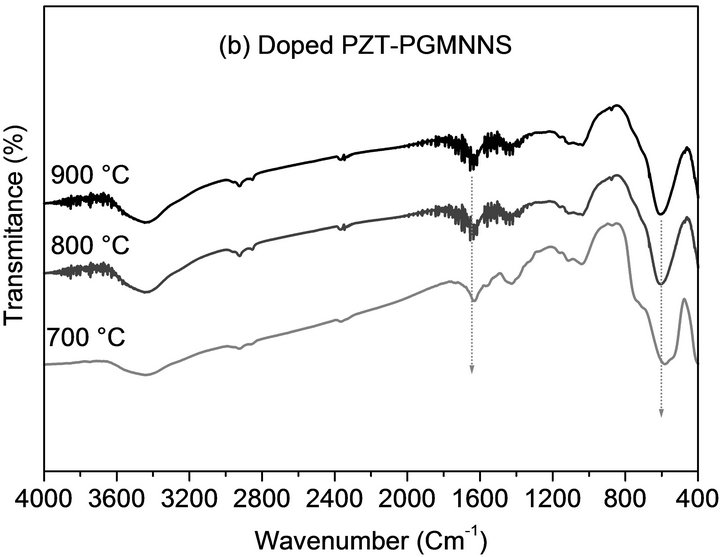 (b)
(b)
Figure 3. FTIR spectra of the samples calcined at the indicated temperatures using a temperature ramp rate of 2˚C/ min for 2 h: (a) undoped PZT; (b) doped PZT-PGMNNS.
In Figures 3(a) and b, the most important band, that extends from 800 to 400 cm−1, of the perovskites structure, is observed with a maximum absorption at ~600 cm−1, which is the characteristic band of oxides with perovskite-type structure [19,20]. This bands exhibit a significant increase for the samples calcined at a higher temperature (800˚C and 900˚C). Noting that a small band at about ~1600 cm−1 which is probably typical of the presence of some water in the KBr employed to dilute the samples into the pellets and chemisorbed from the atmosphere onto the samples is also observed in some of the spectra.
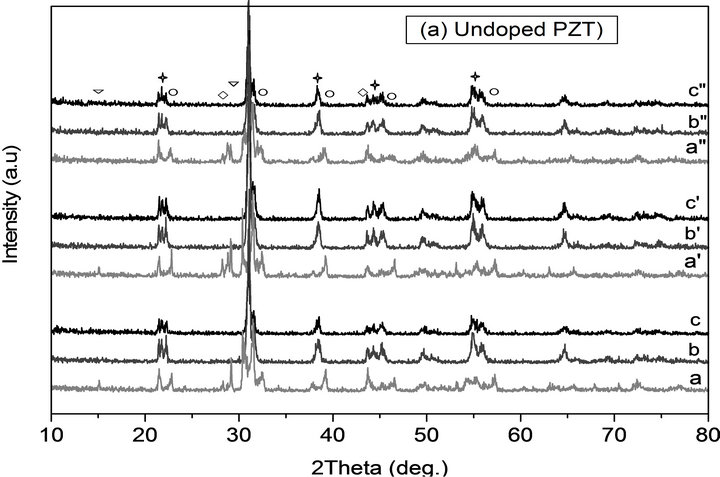
With DRX analysis it was possible to ensure of the phase purity and identify the crystalline phases of the calcined powders at different thermal conditions. Figure 4 shows the XRD patterns of undoped PZT and doped PZT-PGMNNS powders at various calcination temperatures (750˚C, 800˚C and 900˚C), temperature ramp rates (2˚C/min and 10˚C/min) and periods of time (2 and 6 h). Similar trends were also observed for PZT produced by using other thermal conditions [21].
From these figures it was found that PZT perovskite phase with co-existence of both tetragonal and rhombohedral phases matching with the JCPDS file no. 33-0784
 (a)
(a)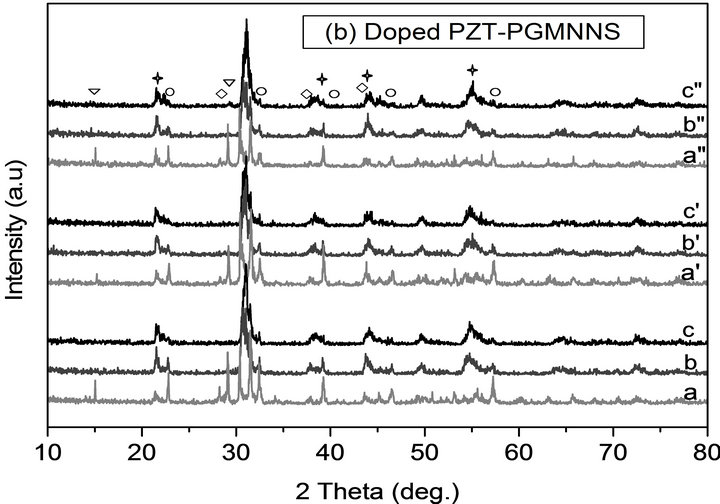 (b)
(b)
Figure 4. XRD patterns of powders calcinted at different temperatures and for different isothermal times and temperature ramp rats for undoped PZT and doped PZTPGMNNS: a, b, c) 10˚C/min until 700˚C, 800˚C, 900˚C for 2 h, a’, b’, c’ and a”, b”, c”) 2˚C/min until 700˚C, 800˚C, 900˚C for 2 h and 6 h respectively. In this figure, (P) stands for PbO (▽); (PT) for PbTiO3 (◯); (PZ) for PbZrO3; (⃟) for PZT(☆).
and 73-2022, respectively and without any trace of pyrocholre phase normally forms was observed in all the samples. In the XRD patterns of the undoped and doped powders that were reacted at 700˚C using a ramp rate of 2 and 10˚C/min for 2 and 6 h (Figures 4(a) and b) additional peaks at approximately 15˚, 29˚ 2θ and were detected. These can be attributed to the presence of unreacted PbO. Peaks of PT (JCPDS no. 06-0452), and PZ (JCPDS no. 035-0739) were also observed in the XRD patterns which is believed to the originate from the uncompleted reaction during powder calcination at these thermal conditions.
When the reaction temperature was increased to 800˚C with changing the heating profile (2 to 6 h and 10 to 2˚C/min), no PT and PZ peaks were observed in the XRD patterns. This means that a reaction had occurred. All the samples calcined at 900˚C exhibit almost the same XRD spectrum. The stoichiometric composition diffraction patterns calcination between 700˚C and 900˚C using a ramp rate of 2˚C/min for 6 h ,which are considering as optimal thermal parameters for this study is shown in Figure 5 and compared with doped simple composition.
It is possible to observe that the number of PbO peaks is less compared with doped sample calcined under the same conditions.This result could well indicate that the perovskite phase formation is not complete for doped compositions. When the calcination temperature is increased, the reaction is observed to be almost complete and the perovskite structure is dominated in XRD for all compositions. Notice that a heating profile also influences the final particle size and size distribution of phase formation.
In Figure 6, the particle morphology of the powders is compared. It can be noted that the increasing of reaction temperature (top to bottom) or time (left to right) led to increase in the particle size. This is more evident for powders synthesized with isothermal time of 6 h. The shape gradually became more regular with the increasing of isothermal time (left to right). Both the phenomena were also observed at lower heating ramp rates (Figures 6(a) and (b)).
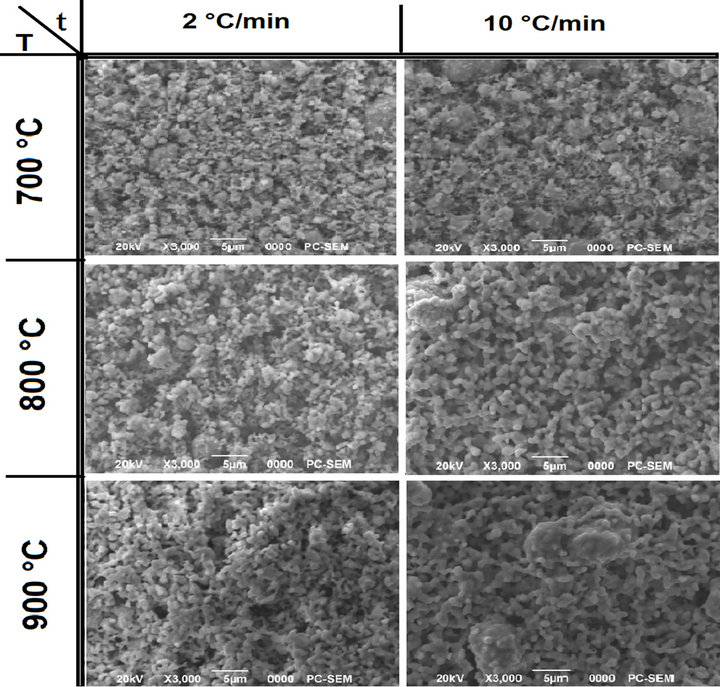
At the lowest processing temperature and time (700˚C, 2 h) the synthesized PZT powder had a distinctive spherical shape (Figure 7(a)) which became less pronoun ced with the increasing process parameters the final particle size and size distribution of it was instead observed that a change in the particle shape occurred with particles becoming more regular with decreasing ramp rates (at constant isothermal time and temperature).
Moreover an increment in the heating rate led to a larger particle size distribution with the presence of big particles in the final PZT powder. This correlates with the observed results by others [22].
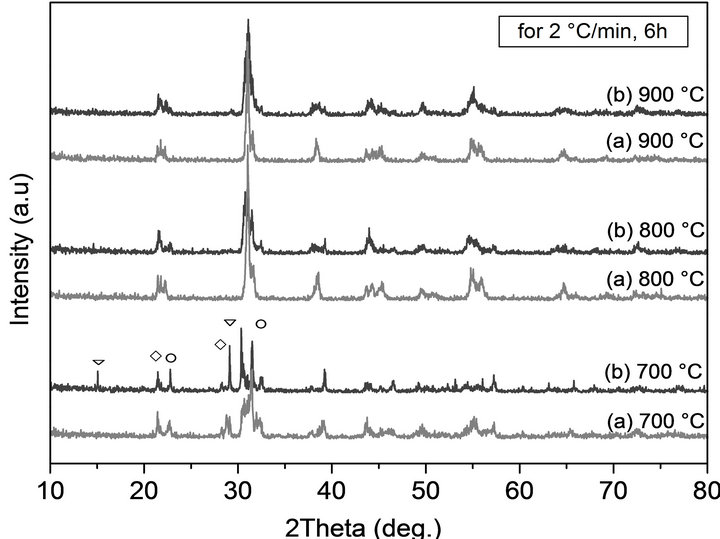
Figure 5. XRD patterns of PZT and PZT-PGMNNS powders at different temperatures with a temperature ramp rate of 2˚C/min for 6 h.
 (a)
(a)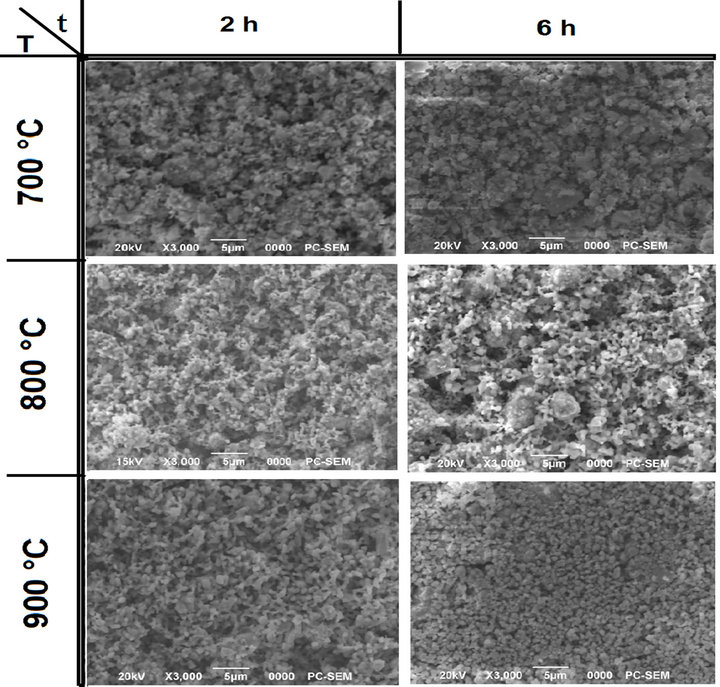 (b)
(b)
Figure 6. SEM micrographs of powders calcinted at different temperatures and for 2 and 6 h of isothermal times (a) undoped PZT; (b) doped PZT-PGMNNS.
 (a)
(a)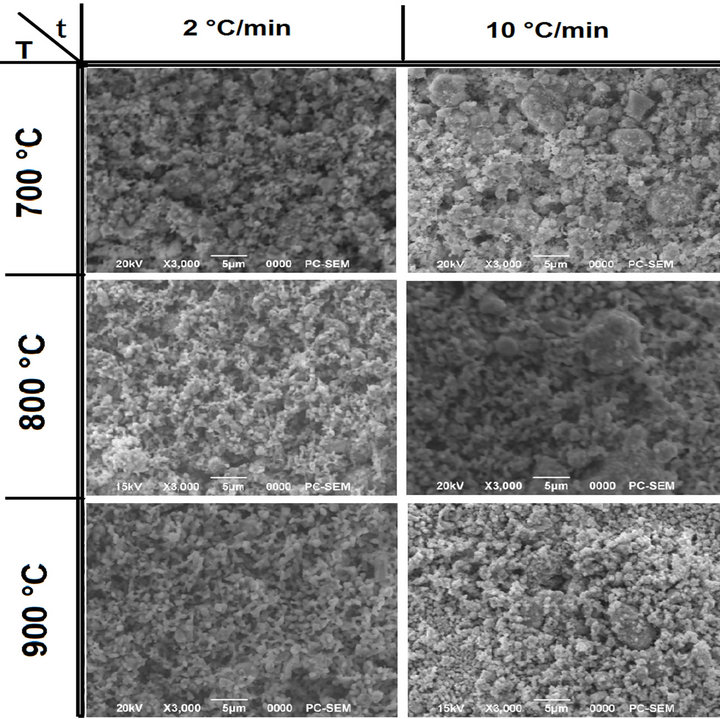 (b)
(b)
Figure 7. SEM micrographs of powders calcinted at different temperatures and with temperature ramp rats of 2 and 10˚C/min for: (a) undoped PZT; (b) doped PZT-PGMNNS.
4. Conclusion
The effect of thermal process parameters such as calcination temperature, reaction time and temperature ramp rate on the perovskite phase formation and general particle size morphology of undoped and doped PZT compositions was investigated by solid-state route. Thus, the results obtained in this study allowed us to suggest a standardized thermal profile that can be used to synthesize new materials using the same state route. For samples calcined at 700˚C whith higher temperature ramp rate (10˚C/min), the reaction between the starting materials was not complete. Residual PbO and intermediate solide solutions (PT and PZ) were found within the product. A single perovskite phase type was observed as calcination temperature increased at 800˚C. At temperature higher 900˚C there is no notable change which allows us to consider that 800˚C as the optimum temperature of calcination samples using the ramp rate of 2˚/min and 6 h of during time. The particles obtained at 700˚C and at fast heating rates were less spherical than the same powder treated at higher temperatures for the same isothermal time. At high temperatures and long reaction times an excessive particle growth was observed. The regular particles were obtained by heating the raw materials at 800˚C for 2 h using a slow temperature ramp rate (2˚C/min−1).
REFERENCES
- B. Jaffe, W. R. Cook Jr. and H. Jaffe, “Piezoelectric Ceramics,” Academic Press, London and New York, 1971.
- Y. Matsuo and H asaki, “Formation of Lead ZirconateLead Titanate Solid Solutions,” Journal of American Ceramic Society, Vol. 48, No. 6, 1965, pp. 289-290. doi:10.1111/j.1151-2916.1965.tb14743.x
- E. Quandt and A. Ludwig, “Magnetostrictive Actuation in Microsystems Sensors and Actuators,” Sensors and Actuators A: Physical, Vol. 81, No. 1-3, 2000, pp. 275-280.
- R. Zuo, L. Li, X. Hu and Z. Gui, “Effect of Silver Dopant on Electrical Properties of PMN-PNN-PZT Piezoelectric Ceramics by Complex Impedance Spectroscopy,” Materials Letters, Vol. 54, No. 2, 2002, pp. 185-190 doi:10.1016/S0167-577X(01)00561-4
- K. Nagata and J. Thongrueng, “Effect of Temperature, Hu- midity and Load on Degradation of Multilayer Ceramic Actuator,” Journal of the Korean Physical Society, Vol. 32, 1998, pp. 1278-1281.
- A. Pinczuk, Solid State Communications, “‘Soft’ Optical Phonons and the Morphotropic Phase Transition of the Pb(Ti1−x,Zrx)O3 System,” Solid State Communications, Vol. 12, 1973, p. 1035.
- A. Boutarfaia and S. E. Bouaoud, “Tetragonal and Rhombohedral Phase Co-Existence in the System: PbZrO3-PbTiO3Pb(Fe1/5,Ni1/5Sb3/5)O3,” Ceramics International, Vol. 22, No. 4, 1996, pp. 281-286. doi:10.1016/0272-8842(95)00102-6
- L’. Medvecký, M. Kmecová and K. Saksl, “Study of Pb(Zr0.53Ti0.47)O3 Solid Solution Formation by Interaction of Perovskite Phases,” Journal of the European Ceramic Society, Vol. 27, No. 4, 2007, pp. 2031-2037. doi:10.1016/j.jeurceramsoc.2006.05.100
- T. R. Shrout, P. Papet, S. Kim and G. S. Lee, “Conventionally Prepared Submicrometer Lead-Based Perovskite Powders by Reactive Calcination,” Journal of the American Ceramic Society, Vol. 73, No. 7, 1990, pp. 1862- 1867. doi:10.1111/j.1151-2916.1990.tb05236.x
- C. A. Randall, N. Kim, J. P. Kucera, W. Cao and T. R. Shrout, “Intrinsic and Extrinsic Size Effects in FineGrained Morphotropic-Phase-Boundary Lead Zirconate Titanate Ceramics,” Journal of the American Ceramic Society, Vol. 81, No. 3, 1998, pp. 677-688. doi:10.1111/j.1151-2916.1998.tb02389.x
- T. Yamamoto, “Optimum Preparation Methods for Piezoelectric Ceramics and Their Evaluation,” American Ceramic Society Bulletin, Vol. 71, No. 6, 1992, pp. 978-984.
- F. Jona and G. Shirane, “Ferroelectric Crystals,” Dover, New York, 1995.
- N. Chakrabarti and H. S. Maiti, “Chemical Synthesis of PZT Powder by Auto-Combustion of Citrate-Nitrate Gel,” Materials Letters, Vol. 30, No. 2, 1997, pp. 169-173. doi:10.1016/S0167-577X(96)00191-7
- Y. Matsuo and H. Sasakhi, “Formation of lead ZirconateLead Titanate Solid Solutions,” Journal of American Ceramic Society, Vol. 48, No. 6, 1965, pp. 289-291. doi:10.1111/j.1151-2916.1965.tb14743.x
- B. V. Hiremath, A. I. Kingon and J. V. Biggers, “Reaction Sequence in the Formation of Lead Zirconate-Lead Titanate Solid Solution: Role of Raw Materials,” Journal of the American Ceramic Society, Vol. 66, No. 11, 1983, pp. 790-793.
- A. I. Kingon, P. J. Terblanche and J. B. Clark, “Effect of Reactant Dispersion on Formation of PZT Solid Solutions,” Ceramic International, Vol. 8, No. 3, 1982, pp. 108-114. doi:10.1016/0272-8842(82)90027-X
- A. I. Kingon, P. J. Terblanche and J. B. Clark, “Effect of Reactant Dispersion on Formation of PZT Solid Solutions,” Ceramic international, Vol. 11, No. 4, 1985, p. 150. doi:10.1016/0272-8842(85)90241-X
- B. V. Hiremath, A. I. Kingon and J. V. Biggers, “Reaction Sequence in the Formation of Lead Zirconate-Lead Titanate Solid Solution: Role of Raw Materials,” Journal of American Ceramic Society, Vol. 66, No. 11, 1983 pp. 790-792. doi:10.1111/j.1151-2916.1983.tb10564.x
- J. T. Last, “Infrared-Absorption Studies on Barium Titanate and Related Materials,” Physical Review, Vol. 105, No. 6, 1957, pp. 1740-1750. doi:10.1103/PhysRev.105.1740
- C. A. Guarany, L. H. Z. Pelaio, E. B. Araújo, K. Yukimitu, J. C. S. Moraes and J. A. Eiras, “Infrared Studies of the Monoclinic-Tetragonal Phase Transition in Pb(Zr,Ti)O3 Ceramics,” Journal of Physics Condensed Matter, Vol. 15, No. 27, 2003, pp. 4851-4857. doi:10.1088/0953-8984/15/27/316
- F. Bortolani and R. A. Dorey, “Molten Salt Synthesis of PZT Powder for Direct Write Inks” Journal of the European Ce- ramic Society, Vol. 30, No. 10, 2010, pp. 2073-2079.
NOTES
*Corresponding author.