Applied Mathematics
Vol.4 No.8A(2013), Article ID:35149,6 pages DOI:10.4236/am.2013.48A007
Eigenvalues of Jacobian Matrices Report on Steps of Metabolic Reprogramming in a Complex Plant-Environment Interaction
Department of Molecular Systems Biology, University of Vienna, Vienna, Austria
Email: *Thomas.Naegele@univie.ac.at
Copyright © 2013 Thomas Nägele, Wolfram Weckwerth. This is an open access article distributed under the Creative Commons Attribution License, which permits unrestricted use, distribution, and reproduction in any medium, provided the original work is properly cited.
Received May 7, 2013; revised June 7, 2013; accepted June 14, 2013
Keywords: Inverse Problems; Jacobian Matrix; Eigenvalue; Plant Systems Biology; Metabolomics
ABSTRACT
Mathematical modeling of biochemical systems aims at improving the knowledge about complex regulatory networks. The experimental high-throughput measurement of levels of biochemical components, like metabolites and proteins, has become an integral part for characterization of biological systems. Yet, strategies of mathematical modeling to functionally integrate resulting data sets is still challenging. In plant biology, regulatory strategies that determine the metabolic output of metabolism as a response to changes in environmental conditions are hardly traceable by intuition. Mathematical modeling has been shown to be a promising approach to address such problems of plant-environment interaction promoting the comprehensive understanding of plant biochemistry and physiology. In this context, we recently published an inversely calculated solution for first-order partial derivatives, i.e. the Jacobian matrix, from experimental high-throughput data of a plant biochemical model system. Here, we present a biomathematical strategy, comprising 1) the inverse calculation of a biochemical Jacobian; 2) the characterization of the associated eigenvalues and 3) the interpretation of the results with respect to biochemical regulation. Deriving the real parts of eigenvalues provides information about the stability of solutions of inverse calculations. We found that shifts of the eigenvalue real part distributions occur together with metabolic shifts induced by short-term and long-term exposure to low temperature. This indicates the suitability of mathematical Jacobian characterization for recognizing perturbations in the metabolic homeostasis of plant metabolism. Together with our previously published results on inverse Jacobian calculation this represents a comprehensive strategy of mathematical modeling for the analysis of complex biochemical systems and plant-environment interactions from the molecular to the ecosystems level.
1. Introduction
The molecular organization of plant metabolism is of high complexity. This complexity arises from a sophisticated level of subcellular organization and of highly interlaced regulatory circuits interconnecting different levels of biochemical organisation. Mathematical modeling is a powerful way to improve the current understanding of plant cells on a molecular level [1]. It is of particular interest to understand how plant metabolism is affected by changes in environmental conditions due to the central position of plants in our ecosystems [2]. A prominent example of how mathematical modeling can promote the understanding of plant-environment interaction is given by the modeling approach of photosynthesis which was developed decades ago [3,4] and is central to current model approaches on global net primary production (NPP) on earth [5,6]. Focusing the question how mathematical modeling can be applied to functionally integrate highthroughput experiments on the metabolome of plant cells, we recently published a strategy of inversely calculating the Jacobian matrix of a biochemical network from experimental high-throughput data [7,8]. When a system of ordinary differential equations (ODEs) is applied to describe a biochemcial system of interest, the Jacobian matrix represents the first-order partial derivative of functions fi of metabolite concentrations Mi with respect to metabolite concentrations (Equation (1)):
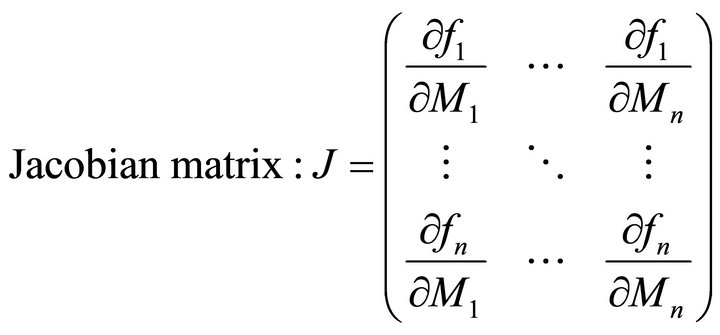 (1)
(1)
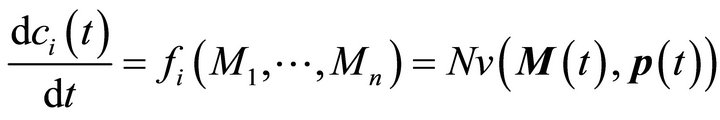
The metabolite functions fi are defined by the system of ODEs describing time-dependent changes of metabolite concentrations (Equation (2)):
 (2)
(2)
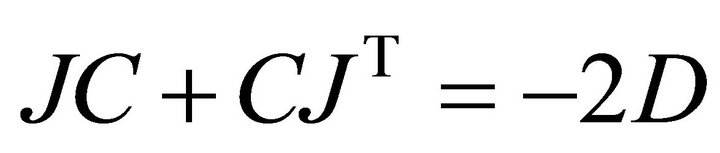
Here, M(t) is the n-dimensional vector of metabolite concentrations, v is an r-dimensional vector of metabolic fluxes and N describes the m x r stoichiometrix matrix of the biochemical reaction network. If the full stoichiometry of a large biochemical network cannot be resolved experimentally, a metabolic interaction matrix, NI, can be derived by interconnecting the experimentally accessible components. The term  indicates that the metabolic flux depends on time-variant metabolite concentrations, i.e. the substrates, products and effectors of the enzymatic reaction, and also on time-variant parameters, e.g. enzyme kinetic parameters or thermodynamic constraints. Hence, to determine the Jacobian matrix of a metabolic system the stoichiometry as well as the timevariant parameters or fluxes must be known. While the method of metabolic reconstruction allows the computational assisted construction of genome-scale stoichiometric matrices [9], the experimental analysis of kinetic parameters is highly laborious and becomes almost impossible for huge reaction networks with several thousand metabolites and reactions [10]. To overcome this limitation and to derive the Jacobian matrix directly from experimental data an inverse problem can be formulated [8, 10,11] (Equation (3)):
 (3)
(3)
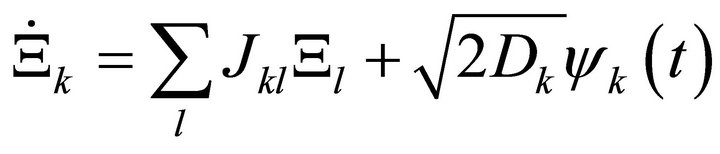
Here, J represents the Jacobian matrix, C is the covariance matrix derived from the experimental data and D is the so-called fluctuation matrix integrating metabolite fluctuations which can be modelled by a Langevintype equation (Equation (4)):
 (4)
(4)
Time-dependent changes in the matrix of metabolite concentrations Ξ are directly linked to the Gaussian noise function ψ(t). Stationary solutions of the Langevin-type equation are linked to the covariance matrix by a corresponding Fokker-Planck equation and finally result in (Equation (3)) [11,12]. Applying this inverse approach to experimental metabolomics data of leaf material from the genetic model plant Arabidopsis thaliana, we could unravel regulatory instances in plant primary metabolism contributing to the establishment of a new metabolic homeostasis induced by changes in light intensity and temperature [7]. Based on these findings, we now present an approach for characterization of the solution set of the inverse problem by deriving the eigenvalues of the Jacobian matrix. The real part of an eigenvalue provides information about the stability properties of the solution set [13]. We show that these stability properties can report on shifts in plant metabolism which are due to a perturbation of environmental conditions.
2. Model Generation and Inverse Calculation
Model construction and experimental analysis of metabolite content was described previously [7]. Here, we provide the model structure in a hierarchical layout (Figure 1) designed with the open source software package CellDesignerTM (V4.3; http://celldesigner.org). The model file is provided on request in Systems Biology Markup Language (SBML). We used this model structure to derive the metabolic interaction matrix, NI, allowing for the calculation of the Jacobian matrix (Equations (1) and (2)).
Singular value decomposition (SVD) was applied for the inverse calculation of the Jacobian matrix [8]. We repeated inverse calculations 100 times until the variance of resulting Jacobian entries did not differ signficiantly (p < 0.05) from the previous calculation. We normalised the medians of each Jacobian entry to the square of its fluctuation which was expressed by the interquartile distance comprising 50% of all data points. As described in our previous publication, we build the differential Jacobian matrix dJ representing the log2-ratio of two different conditions a and b (Equation (5)):
 (5)
(5)
In this way we compared the ratio of Jacobian matrices derived from leaf samples of plants which were not exposed (non-acc), 2 days exposed (2d), 8 days exposed (8d), 14 days expose (14d) and 18 days exposed (18d) to 4˚C and increased light intensity. We found a major impact of cold exposure on primary metabolism after 2 days and 14 days at 4˚C pointing to a short-term and longterm effect of cold on plant primary metabolism [7]. The data indicated that the short-term response represents a fast protection against rapid cell damage while the longterm response is due to an increasing regulatory interaction with secondary metabolism resulting in an increase of flavonoids and other energyand oxidative stress dissipating molecules.
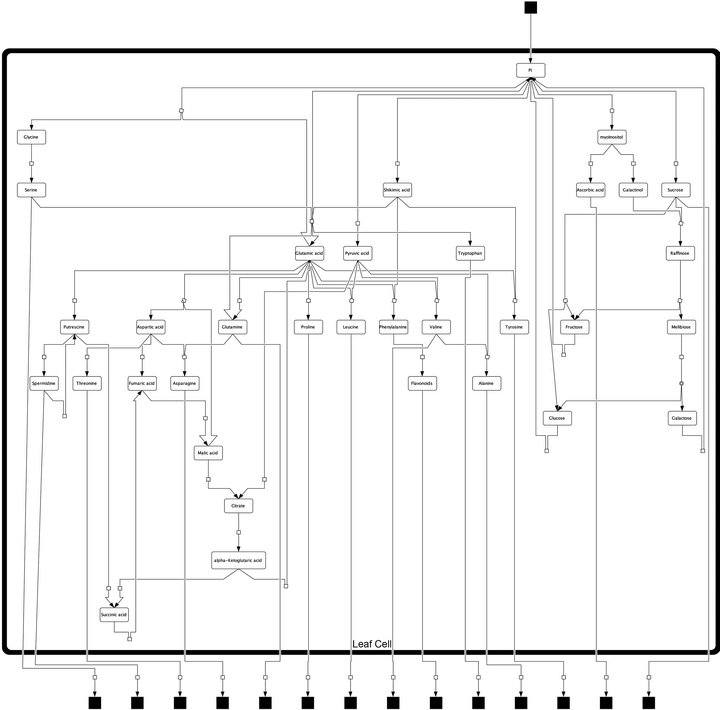
Figure 1. Model structure of primary metabolism in Arabidopsis thaliana leaf cells. Black squares represent dead ends of the model, i.e. imported and exported pools of metabolites which have not been analysed experimentally. Arrows represent steps of metabolic interconversion defining the metabolic interaction matrix, NI, for inverse Jacobian calculation.
Deriving Eigenvalues of Jacobian Entries
Based on our results of inverse calculations, we derived the eigenvalues of the Jacobian entries as described in the following steps. All of the compared Jacobian matrices represent solutions for a certain steady state, i.e. an infintesimal time unit for which all changes in the systems equations can be assumed to equal zero (Equation (6)):
 (6)
(6)
Metabolite concentration at this steady state,  , is related to the metabolite concentration Mi in (Equation (2)) by a perturbation term θi(t) yielding (Equation (7)):
 (7)
(7)
Linearization around this steady state by Taylor expansion discarding all but the first element results in (Equation (8)):
 (8)
(8)
Here, jik are the elements of the Jacobian matrix J at the considered steady state. Solutions of (Equation (8)) are described by
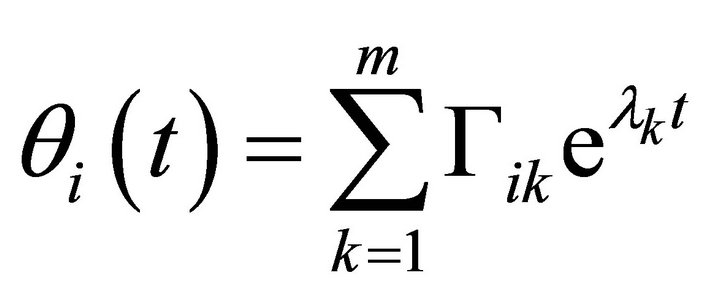 (9)
(9)
 are constants depending on the initial values of the perturbations. The constants
  represent the eigenvalues of the Jacobian matrix J describing the behaviour of the system. Solutions for
  can be derived from the characteristic equation:
 (10)
(10)
Here, I is the m ´ m unit matrix. In general, eigenvalues are complex numbers,  composed of a real part and an imaginary part. From (Equation (9)) it becomes obvious that real parts < 0 result in an exponential decay of the perturbation matrix
  while real parts > 0 induce exponential increase indicating instable system behaviour. The imaginary part of the eigenvalues determine the sinusoidal oscillation which becomes clear when rewriting
  in polar coordinates instead of Cartesian coordinates
 .
.
To analyse whether solutions of inverse calculations may indicate a difference of system stability properties in leaf metabolism when exposed to perturbed environmental conditions, we compared the real parts of eigenvalues. All calculations and graphical representations were performed in MATLAB® (V7.12.0 R2011a). Histograms and scatterplots indicate the presence of positive real parts in all samples following the environmental perturbation (Figure 2). This points to instabilities in solution sets. In the histograms which are arranged diagonally in the scatterplots (Figure 2), the distribution of real parts of eigenvalues are shown for each environmental condition. Only for the samples from not cold exposed plants (“na”) all real parts of eigenvalues were found to be negative. When comparing results for samples of 2 days and 8 days of cold exposure (“2d” and “8d”), the number of positive real parts of eigenvalues indicates a destabilization of the system after 2 days, followed by a restabilization after 8 days. The solution set for samples after 14 days of cold exposure (“14d”) shows an increase of instabilities, i.e. positive real parts of eigenvalues. The number and extend of positive real parts declines again after 18 days indicating an increase of stable solution sets.
3. Discussion
Inverse problems may often be characterized as ill-conditioned because either solutions do not exist, or solutions are not unique, or solutions are not data-dependent in a uniformly continuous way [14]. Hence, solution sets gained by an inverse approach have to be carefully evaluated and tested by further experiments. This is necessary particularly to prevent any misinterpretation of subsequent analysis which is based on the results of the inverse calculation. In the present study, we assume the realistic output of inverse calculation of the Jacobian matrix due to good agreement with a multitude of former experimental studies on plant-environment interaction [7]. It is desirable to be able to derive the Jacobian matrix directly from experimental data because of its central importance in the field of mathematical modeling of com-

Figure 2. Histogram and scatterplot of real parts of eigenvalues. Histograms show the distribution of eigenvalues for each of the sampling conditions. In the scatterplots, eigenvalue distribution is compared between two conditions. na: non-acclimated samples (0 days at 4˚C); 2d: samples after 2 days at 4˚C; 8d: samples after 8 days at 4˚C; 14d: samples after 14 days at 4˚C; 18d: samples after 18 days at 4˚C. “+” and “−” indicate the positive and negative real parts of the eigenvalues.
plex natural systems. Even more, characterizing a biochemical system of interest by the Jacobian matrix enables the application of methods from systems theory which is inevitable for the comprehensive and systematic analysis of large metabolic networks [10]. Motivated by our previous findings based on numerical approximation of eigenvalues of Jacobian matrices in a small metabolic network [15] we now extended this approach to analyse plant-environment interactions in a larger network. The finding of changing distributions of real parts of eigenvalues allows for speculation on different metabolic constitutions. It is known from former studies that there are shortand long-term acclimatory responses in primary metabolism of Arabidopsis thaliana [16] which were also indicated by our eigenvalue calculations. The appearance of positive real parts after 2 days at changed environmental conditions may indicate the shift of the metabolic constitution towards the more stable homeostasis after 8 days. In agreement with the finding that interaction between primary and secondary metabolism is permanently induced from 14 days on [7], instable system behaviour was again observed at this time point declining until day 18 (Figure 2). Although the inverse calculations of the Jacobians comprise data variance which is an artefact from the Gaussian noise in the fluctuation matrix (Equations (3) and (4)), we do not assume that our findings about eigenvalues are related artefacts. First, this is due to the fact that for “na” samples only negative real parts of eigenvalues were determined. Secondly, we have normalised the medians of calculated Jacobian entries by the fluctuation of the inverse calculation. Finally, our results agree with previous findings of independent studies. However, because our experimental measurements only provide qualitative information about a metabolic homeostasis, no realistic information about the absolute values of both our Jacobian entries as well as the eigenvalues can be expected. Instead, only comparative analysis, here exemplified in scatterplots, should be applied. This problem can be circumvented by integrating metabolomics approaches which are able to measure absolute and not relative concentrations of metabolites. Like the approach of modeling photosynthesis [5,6], here we present the applicability of our approach not only to model on a molecular but also on an ecosystem level involving environmental stochastic perturbation [17]. Future studies will have to evaluate if an absolute quantification of metabolic intermediates allows for the calculation of absolute Jacobian entries and associated eigenvalues. This would be a further important step in dissecting the complexity of biological systems and their interaction with the environment by strategies of mathematical modeling.
4. Acknowledgements
We would like to thank the members of the Department of Molecular Systems Biology for many fruitful discussions. We thank the EU-Marie-Curie ITN MERIT (GA 2010-264474) for financial support of TN.
REFERENCES
- J. A. Morgan and D. Rhodes, “Mathematical Modeling of Plant Metabolic Pathways,” Metabolic Engineering, Vol. 4, No. 1, 2002, pp. 80-89. doi:10.1006/mben.2001.0211
- W. Weckwerth, “Green Systems Biology—From Single Genomes, Proteomes and Metabolomes to Ecosystems Research and Biotechnology,” Journal of Proteomics, Vol. 75, No. 1, 2011, pp. 284-305. doi:10.1016/j.jprot.2011.07.010
- G. D. Farquhar, S. V. Caemmerer and J. A. Berry, “A Biochemical Model of Photosynthetic CO2 Assimilation in Leaves of C3 Species,” Planta, Vol. 149, No. 1, 1980, pp. 78-90. doi:10.1007/BF00386231
- G. D. Farquhar, “Models Describing the Kinetics of Ribulose Biphosphate Carboxylase-Oxygenase,” Archives of Biochemistry and Biophysics, Vol. 193, No. 2, 1979, pp. 456-468. doi:10.1016/0003-9861(79)90052-3
- C. J. Bernacchi, J. E. Bagley, S. P. Serbin, U. M. RuizVera, D. M. Rosenthal and A. Vanloocke, “Modeling C3 Photosynthesis from the Chloroplast to the Ecosystem,” Plant, Cell and Environment, 2013. doi:10.1111/pce.12118
- W. Cramer, D. W. Kicklighter, A. Bondeau, B. Moore, G. Churkina, B. Nemry, A. Ruimy, A. L. Schloss and P. P. N. M. Intercompariso, “Comparing Global Models of Terrestrial Net Primary Productivity (NPP): Overview and Key Results,” Global Change Biology, Vol. 5, 1999, pp. 1-15. doi:10.1046/j.1365-2486.1999.00009.x
- H. Doerfler, D. Lyon, T. Nägele, X. Sun, L. Fragner, F. Hadacek, V. Egelhofer and W. Weckwerth, “Granger Causality in Integrated GC-MS and LC-MS Metabolomics Data Reveals the Interface of Primary and Secondary Metabolism,” Metabolomics, Vol. 9, No. 3, 2013, pp. 564- 574.
- X. Sun and W. Weckwerth, “COVAIN: A Toolbox for Uniand Multivariate Statistics, Time-Series and Correlation Network Analysis and Inverse Estimation of the Differential Jacobian from Metabolomics Covariance Data,” Metabolomics, Vol. 8, No. 1, 2012, pp. 81-93. doi:10.1007/s11306-012-0399-3
- I. Thiele and B. Ø. Palsson, “A Protocol for Generating a High-Quality Genome-Scale Metabolic Reconstruction,” Nature Protocols, Vol. 5, 2010, pp. 93-121. doi:10.1038/nprot.2009.203
- W. Weckwerth, “Unpredictability of Metabolism—The Key Role of Metabolomics Science in Combination with Next-Generation Genome Sequencing,” Analytical and Bioanalytical Chemistry, Vol. 400, No. 7, 2011, pp. 1967- 1978. doi:10.1007/s00216-011-4948-9
- R. Steuer, J. Kurths, O. Fiehn and W. Weckwerth, “Observing and Interpreting Correlations in Metabolomic Networks,” Bioinformatics, Vol. 19, No. 8, 2003, pp. 1019- 1026. doi:10.1093/bioinformatics/btg120
- N. G. van Kampen, “Stochastic Processes in Physics and Chemistry,” Elsevier, Amsterdam, 1992.
- E. Reznik and D. Segrè, “On the Stability of Metabolic Cycles,” Journal of Theoretical Biology, Vol. 266, No. 4, 2010, pp. 536-549. doi:10.1016/j.jtbi.2010.07.023
- C. Eck, H. Garcke and P. Knabner, “Mathematische Modellierung,” Springer, Berlin Heidelberg, 2008.
- S. Henkel, T. Nägele, I. Hörmiller, T. Sauter, O. Sawodny, M. Ederer and A. G. Heyer, “A Systems Biology Approach to Analyse Leaf Carbohydrate Metabolism in Arabidopsis thaliana,” EURASIP Journal on Bioinformatics & Systems Biology, 2011, p. 2. doi:10.1186/1687-4153-2011-2
- T. Nägele and A. G. Heyer, “Approximating Subcellular Organisation of Carbohydrate Metabolism during Cold Acclimation in Different Natural Accessions of Arabidopsis thaliana,” New Phytologist, Vol. 198, No. 3, 2013, pp. 777-787. doi:10.1111/nph.12201
- R. M. May, “Stability and Complexity in Model Ecosystems,” 2nd Edition, Princeton University Press, Princeton, 1974.
NOTES
*Corresponding author.