Advances in Bioscience and Biotechnology
Vol.1 No.4(2010), Article ID:2858,4 pages DOI:10.4236/abb.2010.14040
Subtle differences in receptor binding specificity and gene sequences of the 2009 pandemic H1N1 influenza virus
![]()
Department of Computer Science, Houghton College Houghton, USA.
Email: wei.hu@houghton.edu
Received 4 June 2010; revised 20 June 2010; accepted 25 June 2010.
Keywords: 2009 Pandemic H1N1; Influenza; Informational Spectrum Method; Mutation; Random Forests
ABSTRACT
A recent phylogenetic inference indicated that the 2009 pandemic H1N1 strains circulating from March 2009 to September 2009 could be divided into two closely related but distinct clusters. Cluster one contained most strains from Mexico, Texas, and California, and cluster two had most strains from New York, both of which were reported to co-circulate in all continents. The same study further revealed nine nucleotide changes in six gene segments of the new virus specific for the two clusters. In the current study, the informational spectrum method (ISM), a bioinformatics technique, was employed to study the receptor binding patterns of the two clusters. It discovered that while both groups shared the same primary human binding affinity, their secondary binding preferences were different. Cluster one favored swine binding as its secondary binding pattern, whereas cluster two mostly exhibited the binding specificity of A/South Carolina/1/18 (H1N1) (one of the 1918 flu pandemic strains) as its secondary binding pattern. Besides all the nine nucleotide changes found in the previous study, Random Forests were applied to uncover several new nucleotide polymorphisms in 10 genes of the strains between the two clusters, and several amino acid changes in the HA protein that might be accountable for the discrepancy of the secondary receptor binding patterns of the two clusters. Finally, entropy analysis was conducted to present a global view of gene sequence variations between the two clusters, which illustrated that cluster one had much higher genetic divergence than cluster two. Furthermore, it suggested a significant overall correspondence between the nucleotide positions of high importance in differentiating the two clusters and nucleotide positions of high entropy in cluster one.
1. INTRODUCTION
The 2009 pandemic H1N1 influenza virus has brought great challenges and opportunities to flu research. Extensive studies to date on different genes of 2009 pandemic H1N1 have offered valuable insight into the nature of this novel virus. A brief summary of the recent findings on the 2009 pandemic H1N1 virus can be found in [1]. One of the key issues in the study of this new virus is to discover its molecular characteristics. However, many of the molecular indicators of adaptation to human hosts or to the generation of a pandemic virus are found to be lacking in 2009 pandemic H1N1, implying that other previously unrecognized molecular determinants are accountable for its capacity to infect humans [2]. Therefore, it is important to uncover new molecular features of 2009 pandemic H1N1. In [1] Random Forests were employed to identify specific amino acids as novel host markers in 10 proteins of the 2009 pandemic H1N1 virus, and to determine specific nucleotides as host markers in 10 genes of the avian, human, 2009 pandemic H1N1, and swine influenza viruses in a follow-up study [3].
In references [4,5] the informational spectrum method (ISM) [6] was applied to probe the interaction between HA and its receptors, and to find one single highly conserved domain in HA of various subtypes of influenza viruses that was responsible for each binding pattern. The study in [7] located multiple such domains in the HAs of 2009 pandemic H1N1 and avian H5N1, thus expanding the known repertoire of key regions in HA associated with receptor binding affinity. These conserved domains in HA might be served to identify new therapeutic targets for drug development.
The analysis of amino acid sequence and the three-dimensional structure of HA indicated the antigenic similarity between the viruses of the pandemics of 1918 and 2009, and demonstrated that both are susceptible to neutralization by the same antibodies [8-10]. HA is not only a primary target of host immune responses, but also is a major player in host cell receptor binding. Uncovering the receptor binding affinity of 2009 pandemic H1N1 is essential for the understanding of this new virus. In one study [11], two 2009 pandemic H1N1 viruses, A/California/4/2009 and A/Hamburg/5/2009, exhibited dual receptor specificity (human and avian), whereas another virus (A/Darwin/2001/2009) revealed a strict preference for human receptors in a subsequent report [12], which implied that the binding preference of one strain might be different from other strains.
HA mutations have an impact on the host cell receptor specificity. The ISM was employed to identify mutations in the influenza viruses within or between hosts, and to quantify the contribution from each mutation to receptor binding switch. It reported that the strains of 2009 pandemic H1N1 tended to favor human receptor binding as a group, demonstrating that this bioinformatics approach offered a valuable alternative in the study of receptor binding that could process many strains in one analysis. Additionally, the ISM was also applied to quantify the effects of several well-known mutations on binding preference shifts, including E190D/G225D in H1N1 and Q192R/S223L/Q226L/G228S in H5N1 [13]. A recent report [14] revealed that the HAs of human H1N1 followed two different evolutionary paths at positions 190 and 225. The antigenic drift of 1918 pandemic has occurred at position 225, and that of epidemic HAs happened at position 190. Surprisingly, the HAs of 2009 pandemic H1N1 took a different path, i.e., they were highly conserved at both positions 190 and 225.
In [4,5] it was found that the consensus informational spectrum (CIS) of HA of influenza strains have the following characteristic dominant peaks at different IS frequencies as presented in Table 1. In this study, F(0.295) will be termed as 2009 pandemic H1N1 receptor interaction frequency, F(0.055) as swine receptor interaction frequency, and F(0.258) as 1918 pandemic H1N1 receptor interaction frequency. In addition to the dominant peak at IS frequencies in each subtype, there are secondary peaks at various IS frequencies [4,5,13].
Elucidation of the genetic evolution of the 2009 pandemic H1N1 influenza virus is an important undertaking. Current research suggested that the 2009 pandemic H1N1 strains have already diversified into distinct viral lineages with defined spatial patterns. One study reported
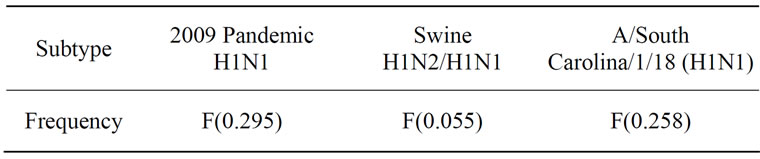
Table 1. Characteristic IS frequencies of HA proteins in 2009 pandemic H1N1, swine H1N1/H1N2, and 1918 pandemic H1N1.
that the strains circulating from April 2009 to July 2009 could be divided into seven phylogenetically distinct viral clades [15], and another analysis indicated that the strains circulating from March 2009 to September 2009 could be divided into two distinct clusters [16]. Cluster one contained most strains from Mexico, Texas, and California, and cluster two had most strains from New York. Strains of cluster one occurred about two weeks earlier than those of cluster two. Both clusters were reported to co-circulate in all continents. Nine nucleotide changes were uncovered in six gene segments (HA, NA, M, NP, NS, PB2) of the strains between the two clusters. A subsequent report [17] revealed that the 2009 pandemic H1N1 virus has evolved worldwide, shifting from an initial mixed clade patterns to one predominant clade (clade 7 in [15] or cluster 2 in [16]), and cluster 2 virus has been under strong purifying selection pressure.
It is of interest to determine the differences in the biological functions of the 2009 pandemic H1N1 strains in the two clusters identified in [16]. The purpose of this study is three fold. One is to explore the HA receptor binding preferences of the two clusters using ISM. The second is to investigate new nucleotide polymorphisms that can characterize the differences between the two clusters with the feature selection capability of Random Forests. The third is to calculate the entropy of 10 genes in the two clusters to achieve a global revelation of the sequence variations of these two clusters.
2. MATERIALS AND METHODS
2.1. Sequence Data
All the protein and nucleotide sequences were retrieved from the Influenza Virus Resource (http://www.ncbi/ nlm.nih.giv/genomes/FLU/FLU.html) of the National Center for Biotechnology Information (NCBI). We utilized 96 isolates that had all six gene segments belonging to cluster one, and 155 isolates that had all six gene segments belonging to cluster two [16]. All the sequences used in the study were aligned with MAFFT [18].
2.2. Entropy
In information theory [19], entropy is a measure of disorder or randomness associated with a random variable. Let x be a discrete random variable that has a set of possible values  with probabilities
  where
where . The entropy H of x is
In the current study, each of the n columns in a multiple sequence alignment of a set of sequences of N symbols is considered as a discrete random variable  (1 ≤ i ≤ N) that takes on one of the 20 amino acid types or 4 nucleotide types with some probability.
  has its minimum value 0 if all the symbols at position i are the same, and achieves its maximum if all the 20 amino acid types or all the 4 nucleotide types appear with equal probability at position i, which can be verified by the Lagrange multiplier technique. A position of high entropy means that the sequences are often varied at this position.
  measures the genetic diversity at position i in our current study.
2.3. Random Forests
Random Forest, proposed by Leo Breiman in 1999 [20], is an ensemble classifier based on many decision trees. Each tree is built on a bootstrap sample from the original training set and is unpruned to obtain low-bias trees. The variables used for splitting the tree nodes are a random subset of the whole variable set. The classification decision of a new instance is made by majority voting over all trees. About one-third of the instances are left of the bootstrap sample and not used in the construction of the tree. These instances in the training set are called “out-of-bag” instances and are used to evaluate the performance of the classifier, which can achieve both low bias and low variance with bagging and randomization.
2.4. Feature Selection Using Random Forests
Random Forest calculates several measures of variable importance. The mean decrease in accuracy measure was employed in [21] to rank the importance of the features in prediction. This measure is based on the decrease of classification accuracy when values of a variable in a node of a tree are permuted randomly. In this study, two packages of R, randomForest and varSelRF [21], were utilized to compute the importance of the amino acids in a given sequence dataset. The effectiveness and robustness of this technique as a feature selection method has been demonstrated in various studies [22-27].
Random Forests produce non-deterministic outcomes. To compensate this bias, the Random Forests algorithm was run multiple times and then the average of the results was taken. The importance of each residue or nucleotide in the sequences was based on the averaged calculations by using the function randomVarImpsRF in varSelRF repeated 20 times.
3. RESULTS
3.1. Receptor Binding Patterns of the Strains in the Two Clusters
As demonstrated in [11,13], the HAs of 2009 pandemic H1N1 largely favored human receptor binding, although some of them exhibited dual binding preference. It was intriguing to explore the receptor binding differences of the two clusters identified in [16]. The ISM confirmed that the primary binding specificity of both clusters was human receptor types at IS frequency F(0.295). After setting the S/N ratio to zero at the primary frequency F(0.295), the secondary peaks of IS of the two clusters were different (Figure 1). Cluster one revealed a peak at frequency F(0.055) (swine binding) but cluster two showed a peak at frequency F(0.258) (1918 pandemic binding) according to the definition given in [4,5].
While all the stains in the two clusters had the same primary binding frequency F(0.295), the secondary binding frequencies varied between the two clusters. To sharpen the search of the true amino acids causing this discrepancy of the secondary binding preferences, two new sub-clusters were constructed by selecting the strains from cluster one that had the primary frequency F(0.295) and the secondary frequency F(0.055) (n = 83), and the strains from cluster two that had the primary frequency F(0.295) and the secondary frequency F(0.258) (n = 148). Random Forests produced the top important amino acid positions in the HA protein and the top nucleotide positions in the HA gene (Figure 2) that could separate the two new sub-clusters, having homogenous primary and secondary binding patterns within each sub-cluster.
Although the amino acids in HA were mainly accountable for the receptor binding affinity, the codon positions in HA were also displayed in Figure 2 to provide finer details of these positions that could differentiate these two sub-clusters. Because there were only a few residue positions of non-zero importance in the HA protein, all these positions were present in the left plot of Figure 2. Seven residue positions 49, 100, 214, 220, 239, 240, and 293 in the left plot of Figure 2 were located in HA1, one of the two domains of HA that is directly involved in the binding of HA to its receptors. It was of note that several codon positions in the right plot of Figure 2 were not present in the left plot of Figure 2, since some nucleotide changes might not be detected at the protein level as a consequence of synonymous mutations. In one case, the consensus HA protein sequence of cluster one had an S (triple-letter codon: tca) at residue 220 and that of cluster two had a T (triple-letter codon: aca) at the same position. In another case, the consensus HA protein sequence of cluster one had a L (triple-letter codon: cta) at residue 470 and that of cluster two had a L (triple-letter codon: tta) at the same position. For this reason, both plots in Figure 2 had position 220 but only the right plot contained position 470.
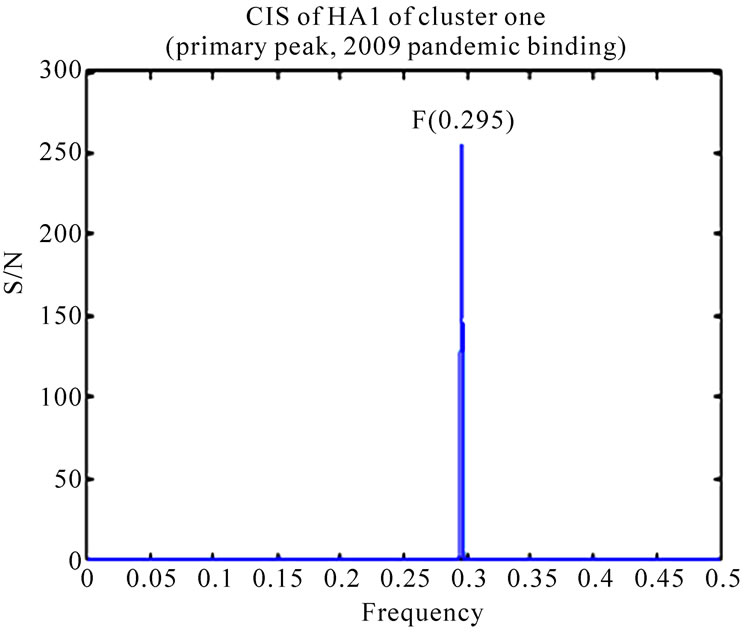

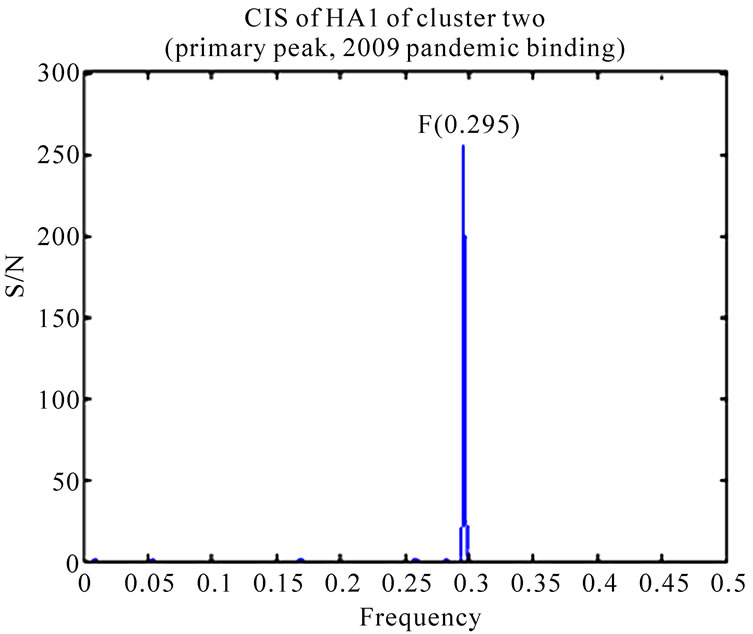
Figure 1. CIS (primary peaks and secondary peaks) of consensus HA1 sequences of the two clusters discovered in [16].
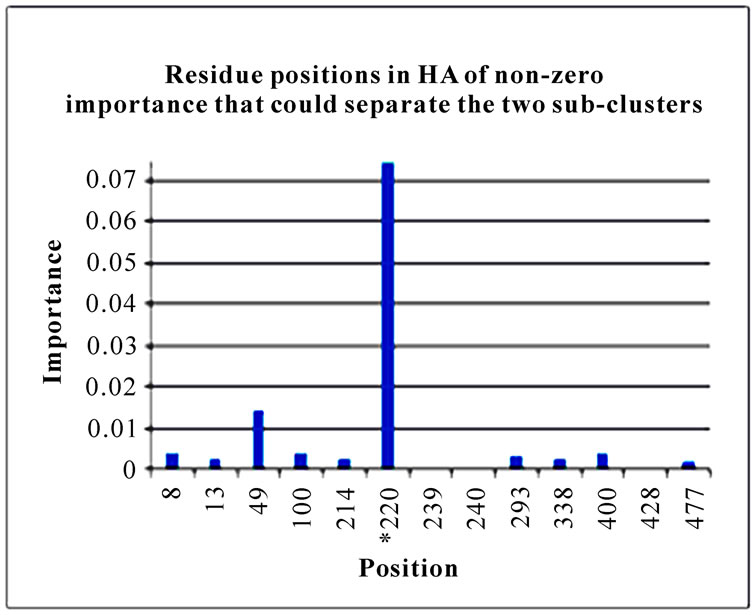

Figure 2. Important positions in the HA of 2009 pandemic H1N1 that could separate the two sub-clusters. The positions with an asterisk are those that were identified in [16]. The number in parenthesis is the position within the codon that was selected by Random Forests.
3.2. Significant Codon Positions That Could Distinguish the Two Clusters
In addition to locating all the nine nucleotide changes found in [16], Random Forests were also able to report two new nucleotide mutations that were as significant as these nine mutations, including codon 106(1) in NA and codon 416(3) in NP (Figure 3). Sequence inspection indicated that the consensus NA sequence of cluster one had a V (triple-letter codon: gta) at residue position 106 and that of cluster two had an I (triple-letter codon: ata) at the same position, with a nucleotide difference in the first position within codon 106. Moreover, the consensus NP sequence of cluster one had an R (triple-letter codon: cgg) at residue position 416 and that of cluster two had an R (triple-letter codon: cga) at the same position, with a nucleotide difference in the third position within codon 416. Even though their importance was not as high as those nine mutations, two significant codon positions, 353(2) in PB1 and 581(1) in PA, were revealed by Random Forests. All the other codon positions in Figure 3 were subtle in the differentiation of the two clusters.
3.3. Entropy of Ten Genes of the Strains in the Two Clusters
To gain an overall perspective of sequence variations, the entropy of 10 genes of the strains in the two clusters was computed (Figure 4). The observed pattern of entropy suggested that cluster one had more sequence divergence than cluster two, highlighting the evolutionary trends of this novel virus. The top 10 entropy positions in each of the 10 genes were listed in Table 2, where many of the high entropy positions in cluster one were also important positions that could discriminate the two clusters (Figure 3). It appeared that the high entropy positions in cluster one, not those in cluster two, could influence the separation of the two clusters. This tendency was more apparent among NP, PA, PB1, and PB2, the genes that are critically involved in the replication of the influenza viruses. As expected, the M2 gene in both clusters exhibited the least sequence variation having only five non-zero entropy positions (Table 2). There were two nucleotide positions 279(3) in HA and 65(3) in M2 that displayed high entropy in both clusters, and
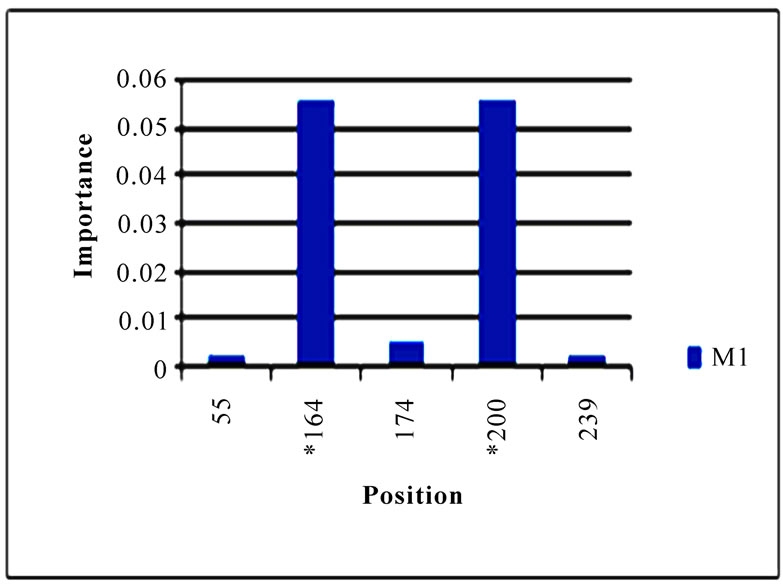
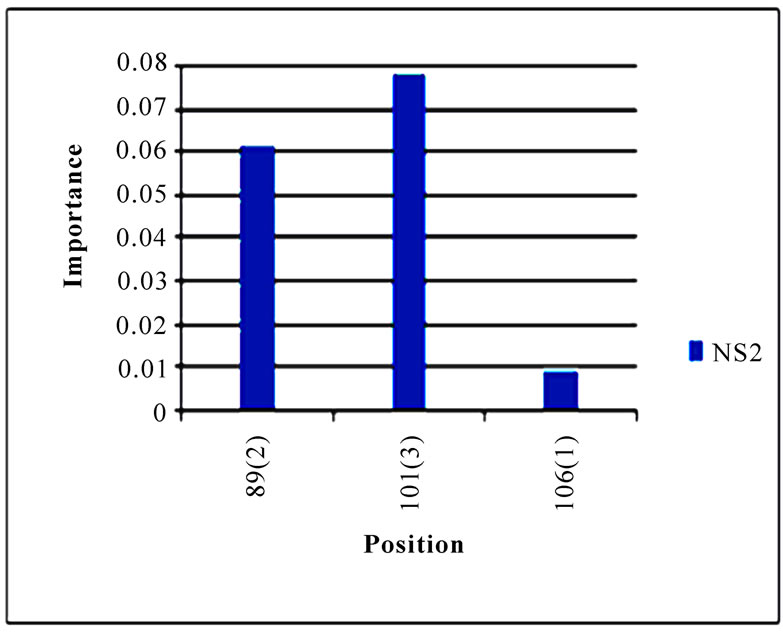
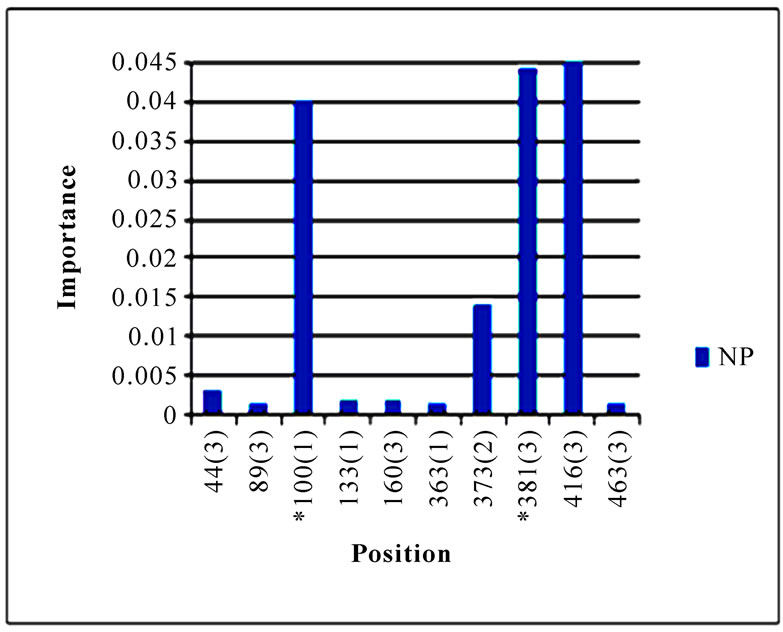
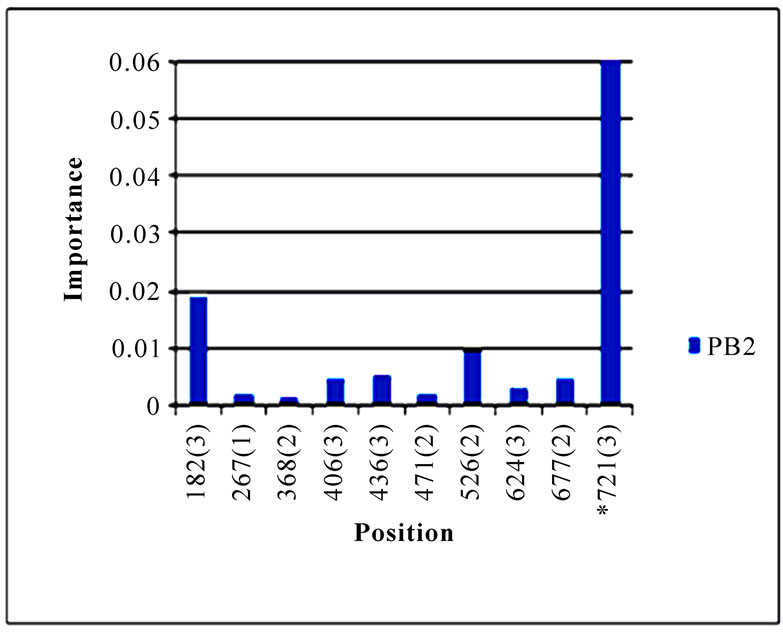
Figure 3. Top 10 important codon positions in 10 genes of 2009 pandemic H1N1 that could differentiate the two clusters. If a gene had less than 10 positions of nonzero importance, then all the nonzero positions in that gene were plotted. The positions with an asterisk are those that were identified in [16]. The number in parenthesis is the position within the codon that was selected by Random Forests.
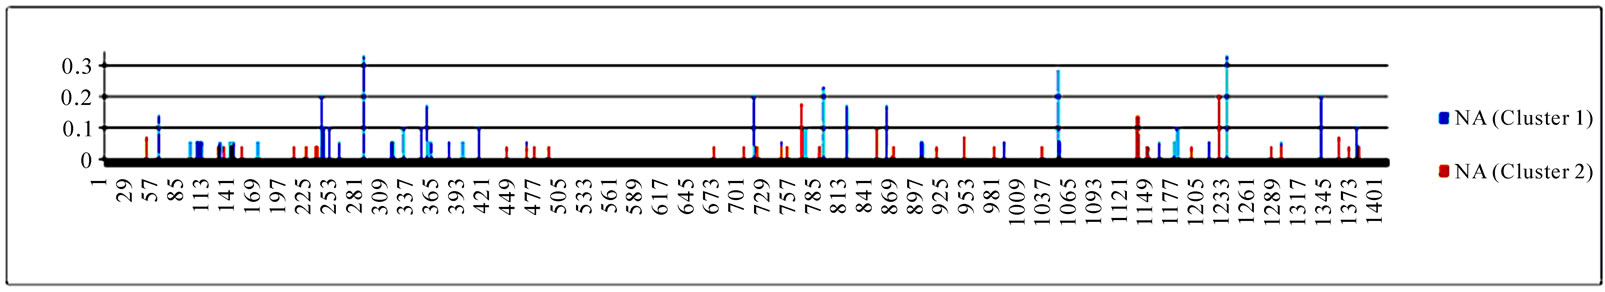
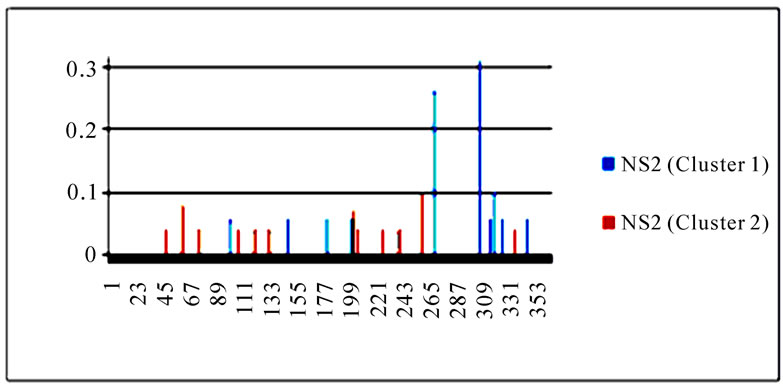
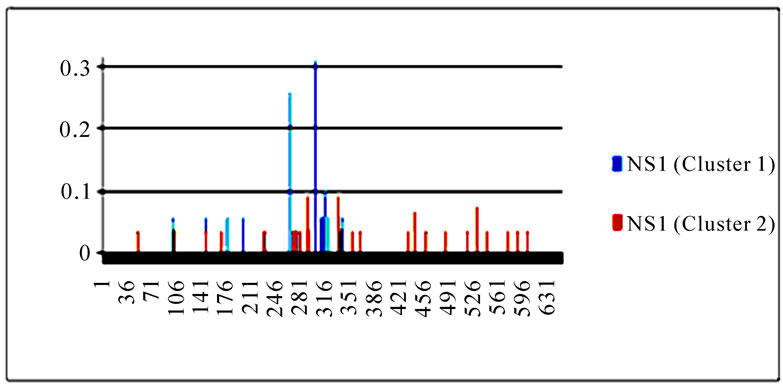
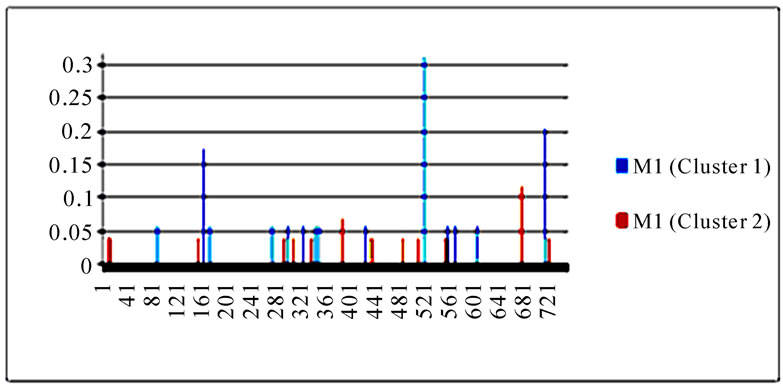
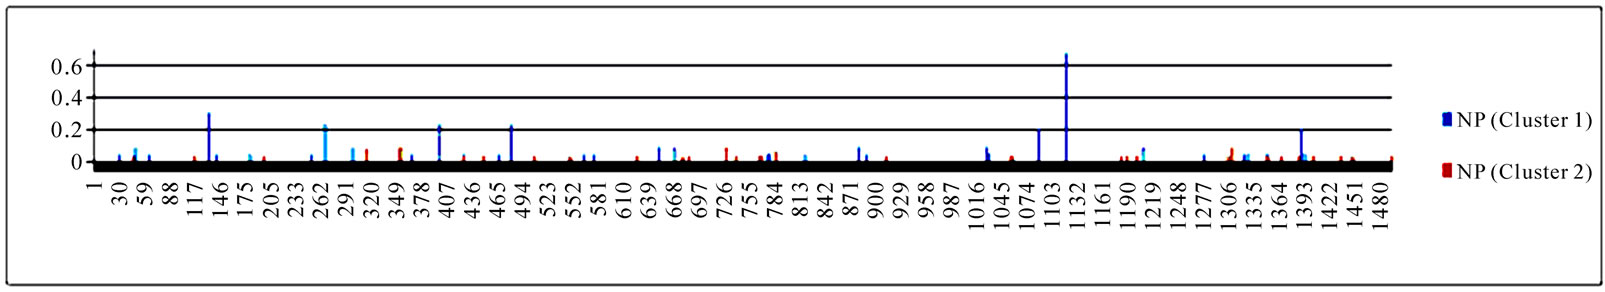
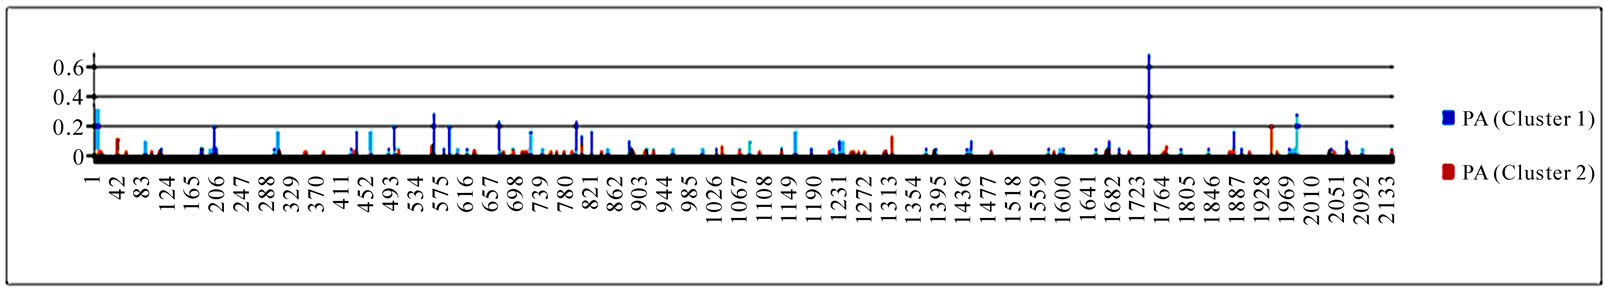
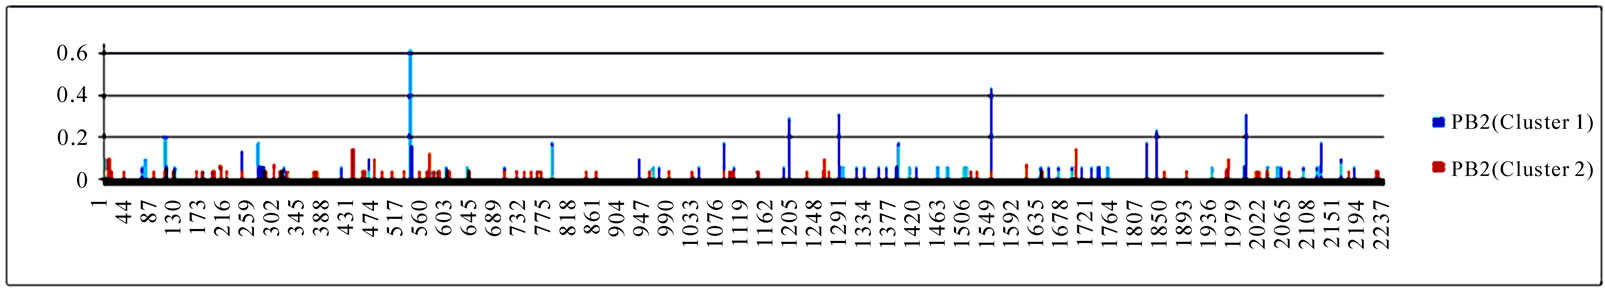
Figure 4. Entropy of 10 genes of the strains in the two clusters. In each plot, the x-axis represents the nucleotide positions in a gene and the y-axis represents the entropy.
Table 2. Top 10 entropy codon positions, ordered by their decreasing entropy values from left to right in each row, in 10 genes of the strains in the two clusters. The positions with an asterisk are those that were identified as important positions in Figure 3. The number in parenthesis is the position within the codon where the corresponding nucleotides had high entropy. The M2 gene of the strains in both clusters had only five non-zero entropy positions.
three codon positions 65 in M2, 67 in NS1, and 16 in NP that showed high entropy in both clusters.
4. CONCLUSIONS
Although the strains in the two clusters defined in [16] shared the same primary binding specificity (2009 pandemic binding), their secondary bindings were different. Cluster one liked swine binding, on the other hand cluster two favored 1918 pandemic binding. Residue positions 49, 100, 214, 220, 239, 240, and 293 in the HA1 domain of HA were reported by Random Forests to be responsible for this discrepancy of secondary bindings. Random Forests also found several new nucleotide polymorphisms including codon 106(1) in NA, codon 416(3) in NP, codon 353(2) in PB1, and codon 581(1) in PA, thus expanding the known nucleotide changes that could distinguish the two clusters. Finally, entropy analysis illustrated that the strains in cluster one exhibited an increased genetic variation compared with cluster two. It also highlighted a remarkable overall association between the nucleotide positions of high importance in differentiating the two clusters and nucleotide positions of high entropy in cluster one.
5. ACKNOWLEDGEMENTS
We thank Houghton College for its financial support.
REFERENCES
- Hu, W. (2010) Novel host markers in the 2009 pandemic H1N1 influenza a virus. Journal of Biomedical Science and Engineering, 3(6), 584-601.
- Garten, R.J., Davis, C,T,, Russell, C.A., Shu, B., Lindstrom, S., Balish, A., Sessions, W.M., Xu, X., et al. (2009) Antigenic and genetic characteristics of swine-origin 2009 A (H1N1) influenza viruses circulating in humans. Science, 325 (5937), 197-201.
- Hu, W. (2010) Nucleotide host markers in the influenza a viruses. Journal of Biomedical Science and Engineering, 3, 684-699.
- Veljkovic, V., Niman, H.L., Glisic, S., Veljkovic, N., Perovic, V. and Muller, C.P. (2009) Identification of hemagglutinin structural domain and polymorphisms which may modulate swine H1N1 interactions with human receptor. BMC Structural Biology, 9, 62.
- Veljkovic, V., Veljkovic, N., Muller, C.P., Müller, S., Glisic, S., Perovic, V. and Köhler, H. (2009) Characterization of conserved properties of hemagglutinin of H5N1 and human influenza viruses: possible consequences for therapy and infection control. BMC Structural Biology, 7, 9-21.
- Cosic, I. (1997) The resonant recognition model of macromolecular bioreactivity, theory and application. Birkhauser Verlag, Berlin.
- Hu, W. (2010) Identification of highly conserved domains in hemagglutinin associated with the receptor binding specificity of influenza viruses: 2009 H1N1, avian H5N1, and swine H1N2. Journal of Biomedical Science and Engineering, 3, 114-123.
- Wei, C.J., Boyington, J.C., Dai, K., Houser, K.V., Pearce, M.B., Kong, W.P., Yang, Z.Y., Tumpey, T.M. and Nabel, G.J. (2010) Cross-neutralization of 1918 and 2009 influenza viruses: Role of glycans in viral evolution and vaccine design. Science Translational Medicine, 2, 24ra21.
- Xu, R., Damian, C., Ekiert, J.C.K., Rong, H., James, E., Crowe, J. and Ian, A.W. (2010) Structural basis of preexisting immunity to the 2009 H1N1 pandemic influenza virus. Science, 328(5976), 357-360
- Igarashi, M., Ito, K., Yoshida, R., Tomabechi, D., Kida, H. and Takada, A. (2010) Predicting the antigenic structure of the pandemic (H1N1) 2009 influenza virus hemagglutinin, PLoS One. 5(1), e8553.
- Childs, R.A., Palma, A.S., Wharton, S., Matrosovich, T., Liu, Y., Chai, W., Campanero-Rhodes, M.A., Zhang, Y., Eickmann, M., Kiso, M., Hay, A., Matrosovich, M. and Feizi, T. (2009) Receptor-binding specificity of pandemic influenza A (H1N1) 2009 virus determined by carbohydrate microarray. Nat Biotechnol. 27(9), 797-799.
- Yang, H., Carney, P. and James, S. (2010) Structure and receptor binding properties of a pandemic H1N1 virus hemagglutinin. PLoS Curr Influenza. 22, RRN1152.
- Hu, W. (2010) Quantifying the effects of mutations on receptor binding specificity of influenza viruses. Journal of Biomedical Science and Engineering, 3, 227-240.
- Shen, J., Ma, J., Wang, Q. (2009) evolutionary trends of a (H1N1) influenza virus hemagglutinin since 1918. PLoS One, 4(11), e7789.
- Nelson, M., Spiro, D., Wentworth, D., Beck, E., Jiang, F. et al. (2009) The early diversification of influenza A/H1N1pdm. PLoS Curr Influenza, 3, RRN1126.
- Fereidouni, S.R., Beer, M., Vahlenkamp, T. and Starick, E. (2009) Differentiation of two distinct clusters among currently circulating influenza A (H1N1) viruses. Euro Surveill, 14(46).
- Valli, M.B., Meschi, S., Selleri, M., Zaccaro, P., Ippolito, G., Capobianchi, M.R. and Menzo, S. (2010) Evolutionary pattern of pandemic influenza (H1N1) 2009 virus in the late phases of the 2009 pandemic. PLoS Currents Influenza, 3, RRN1149.
- Katoh, K., Kuma, K., Toh, H. and Miyata, T. (2005) MAFFT version 5: Improvement in accuracy of multiple sequence alignment. Nucleic Acids Research, 33(2), 511- 518.
- MacKay, D. (2003) Information theory, inference, and learning algorithms. Cambridge University Press, UK.
- Breiman, L. (2001) Random forests. Machine Learning, 45(1), 5-32.
- Díaz-Uriarte, R. and Alvarez de Andrés, S. (2006) Gene selection and classification of microarray data using random forest. BMC Bioinformatics, 7, 3.
- Kellie, J.A. and Ryan V.K. (2008) Empirical characterization of random forest variable importance measures. Computational Statistics and Data Analysis, 52(4), 2249- 2260.
- Reif, D.M.M., Alison, A.M., Brett, A.C., James, E.M., Jason, H. (2006) Feature selection using a random forests classifier for the integrated analysis of multiple data types. Proceedings of 2006 IEEE Symposium on Computational Intelligence and Bioinformatics and Computational Biology, CIBCB '06, Toronto, 2006, 1-8.
- Pablo, M.G., Cesare, F., Franco, B. and Flavia, G. (2006) Recursive feature elimination with random forest for PTR-MS analysis of agroindustrial products. Chemometrics and Intelligent Laboratory Systems, 83(2), 83-90.
- Bjoern, H.M., Kelm, B.M., Masuch, R., Himmelreich, U., Bachert, P., Petrich, W. and Hamprecht, F.A. (2009) A comparison of random forest and its Gini importance with standard chemometric methods for the feature selection and classification of spectral data. BMC Bioinformatics, 10, 213.
- Gao, D., Zhang, Y.X. and Zhao, Y.H. (2009) Random forest algorithm for classification of multi-wavelength data. Research in Astronomy and Astrophysics, 9(2), 220- 226.
- Hu, W. (2009) Identifying predictive markers of chemosensitivity of breast cancer with random forests. Journal of Biomedical Science and Engineering, 3(1), 59-64.