Psychology
Vol.5 No.3(2014), Article ID:44318,14 pages DOI:10.4236/psych.2014.53034
Personality and Participation: Who Volunteers to Participate in Studies
Anthony Saliba, Peter Ostojic
School of Psychology, Charles Sturt University, Wagga Wagga, Australia
Email: asaliba@csu.edu.au
Copyright © 2014 by authors and Scientific Research Publishing Inc.
This work is licensed under the Creative Commons Attribution International License (CC BY).
http://creativecommons.org/licenses/by/4.0/


Received 19 September 2013; revised 18 October 2013; accepted 15 November 2013
ABSTRACT
This work examines the influence of personality factors on willingness to participate in studies. Participants were recruited either via a market research firm or via a face-to-face interception technique. In addition to completing their required tasks, all 256 participants subsequently completed the Myers-Briggs Type Indicator (MBTI). The type distributions from the market research task and the interception task were compared to that of the normative United State National Representative Sample (US NRS). Personality type distributions from the market research recruited participants and the interception recruited participants were found to be significantly different to the US NRS. Further, all over-represented personality types were either Intuitive-Feeling (NF) or Intuitive-Thinking types (NT) and so shared the common trait of “Intuition” whereas all underrepresented types shared the opposing trait of “Sensing” and were either Sensing-Thinking (SN) or Sensing-Feeling (NF) types. Results suggest that personality factors effect a person’s decision to participate in a study. Importantly, since personality type has not usually been part of selection criteria in past studies it may be that a systematic non-response bias may unknowingly have always existed. The implications of such a bias on the true state of knowledge regarding human behavior are potentially profound.
Keywords:Participation; Personality Type; Response Bias; Recruitment Method; Volunteering

1. Introduction
One of the most important concepts in social science research is that of the “representative sample” since without such a sample study findings may not be generally applicable to the cohort being studied. As the representative sample lies at the heart of all social research including psychology, opinion polls and market research, it is not surprising that much is known about maximizing the likelihood of obtaining a truly representative sample (see for example, Hulley, Cummings, Browner, Grady, & Newman, 2013).
Researchers ensure the characteristics of the target group important to the study are reflected in the representative sample through the use of selection criteria. Once the selection criteria have been defined, members of the target group volunteering for the study are vetted against those criteria and either accepted or rejected for the representative sample on that basis.
Statistical techniques can also be employed to increase the likelihood of obtaining a representative sample. Such techniques can range from the simple use of random numbers to aid in selecting participants from a small subject pool, to nested or stratified sampling in situations where a great number of potential participants are spread over a large, geographically diverse area.
Once having established the appropriate statistical sampling technique and selection criteria, the final step in obtaining a representative sample is the recruitment process. Participants can be recruited into a study by a variety of means including market research companies, a request for volunteers or an interception technique.
Market research companies advertise for people willing to participate in studies. Respondent’s details are entered into the company’s database and organizations seeking to undertake a study contact the recruitment company providing them with selection criteria and the number of participants they require. The recruitment company subsequently interrogates its database and invites those people meeting the selection criteria to participate in the study.
In the requests for volunteers approach the proposed study is advertised in places likely to be seen by the target group (e.g. special interest magazines/newspapers, newspapers, bulletin boards etc). Interested people are invited to contact the researchers with potential volunteers subsequently vetted against the selection criteria for inclusion in the study.
Unlike the previous two recruitment methods which rely on potential participants approaching the researchers, interception involves researchers approaching potential participants. Techniques include door-knocking, telephone calling or establishing a “base” in a location known to be popular to the target group (e.g. a booth in a shopping centre) and approaching (“intercepting”) passers-by inviting them to join the study. Once again, acceptance/rejection for inclusion in the study is dependent on the volunteer’s “fit” with the selection criteria.
The internet is beginning to emerge as another potential recruitment method. The increasing technical literacy of the population, the ubiquitous nature of the internet and the decreasing cost of access no longer restricts researchers to target groups easily able to attend a specific location in order to participate in a study. When combined with Software such a Survey Monkey which allows researchers to develop on-line selection criteria and surveys without the need to interact with respondents, the internet provides researchers with the means to cheaply and efficiently obtain results from a representative sample potentially recruited from around the world. It is for those reasons on-line surveys are seen by some as likely to play a growing role in future studies (Smith & Senior, 2001).
Regardless of the method used to recruit a representative sample they all share a number of common characteristics; not everyone who meets the selection criteria and can participate in a study chooses to participate in the study; of those that do participate some may omit items either carelessly or selectively and, of particular relevance to longitudinal studies, people who participated in an initial study may subsequently refuse to volunteer for later studies (Lubin, Levitt, & Zuckerman, 1962; Marcus & Schütz, 2005; Rogelberg et al., 2003). Behaviors such as those on the part of participants may give rise to a potential “non-response bias” in the findings of the study. For example, if a sufficient number of people meeting the selection criteria decline to participate in a study then a biased response may result from those who do agree to participate (complete non-response bias). Similarly, if enough people omit the same item or group of items a distorted result (item response bias) may occur from the responses of those who did not omit the item/s (Hattie, 1983). Data analysis to account for item non-response bias and bias from participant drop out in longitudinal studies has received considerable attention and statistical techniques have been developed over many years in order to deal with it when it has been anticipated or detected (see for example, Hansen & Hurwitz, 1946).
Various recommendations have been made for minimizing and detecting complete non-response bias however they all have their limitations and so are not applicable or practical to use in all situations (see Rogelberg et al., 2003 for a summary). The most common approach involves combining data from a number of sources. Rogelberg and Luong (1998) for example suggested complete non-response bias in mailed surveys could be detected by identifying respondents and nonrespondents by name and then using archival data such as personnel or academic records or job applications to search for differences between the two groups. Lee, Brown, Grant, Belin and Brick (2009) linked California Health Interview Survey data (CHIS) and US Census data in order to compare the neighborhood characteristics of respondents/nonrespondents to the CHIS. However, for most studies involving voluntary participation there is currently no way of detecting or dealing with a large number of complete non-responders. Indeed in many studies the number of complete non-responders is unknown and so could potentially exceed the number of active participants. As a consequence researchers are unable to determine how input from complete non-responders may have influenced the study outcome and so their “representative sample” of volunteers may not be truly representative of the entire target group. A better understand of complete nonresponders then is crucial to obtaining a truly representative sample and so forms the focus of this work.
Complete non-response bias has been attributed to numerous factors including an inability to contact suitable participants, privacy and confidentially concerns, a fear of crime (i.e. the fear held by some potential participants, particularly women or the elderly, of opening their door to strangers claiming to be undertaking a study) and interviewer characteristics such as appearance, gender and attitude (Schräpler, Schupp, & Wagner, 2010) as well as a lack of trust in the researchers, concerns about stereotyping or racism and disenfranchisement due to immigrant/refugee status, disability, sexual orientation, homelessness and so on (Berger, Begun, & Otto-Salaj, 2009).
From a theoretical prospective non-response bias is attributed to “response propensity”: the inclination a person who meets the selection criteria has to participate in a study. While response propensity is undoubtedly influenced by the factors mentioned above as well as by personal circumstances at the time of the study such as illness or prior commitments, such issues are not thought to account for all those who decline their participation. Response propensity is also considered to be related to how important aspects of the study are to potential participants. Indeed, leverage-saliency theory postulates that many factors contribute to the decision to participate with the salience of those factors varying from person to person (Groves, Singer, & Corning, 2000). Upon being introduced to the study, prospective volunteers “tune in” to those aspects they consider salient and base their subsequent decision to participate on how much personal importance (“leverage”) they ascribe to those aspects. When a study has salient features likely to be of personal importance to a large number of people within the target group, a non-response bias is possible since encountering volunteers who did not consider that feature to be salient/personally important is unlikely. Such people may however, still agree to participate if they considered some other aspect of the study to be salient/important. A study involving alcohol for example may be of little interest to teetotalers within the target group but appeal to social drinkers. Some teetotalers may however agree to participate if the study is short and the incentive alluring enough.
Rational choice theories provide another perspective on response propensity in that they posit people always make choices in a manner that is rational to them and in their best interests. According to Scott (2000) “Rational choice theories hold that individuals must anticipate the outcomes of alternative courses of action and calculate that which will be best for them. Rational individuals choose the alternative that is likely to give them the greatest satisfaction” (p. 128). In essence, rational choice theory suggests that when potential participants are faced with a choice they engage in a type of cost-benefit analysis. In the context of this work, their decision to participate in a study occurs after they have weighed the “cost” of participation (e.g. time involved, the need to forego other plans, inconvenience to others etc) against the “benefit” (e.g. personal interest in the topic, feeling good about helping a postgraduate student, usefulness of the incentive etc). Their ultimate decision regarding participation then is derived rationally and based on their best interest.
Both “leverage-salience” and “rational choice” theory share an implicit assumption in that the salience (and leverage) of factors can change over time as can one’s view of “cost” and “benefit”. As such, a person’s decision to participate in a study is not fixed for all time and so a complete non-responder who declined their participation in the present study may well have consented if approached at some other time since their perception of the salience/leverage or cost/benefit of participation may have changed. For example, the non-responding teetotaller who initially declined to participate in a study involving alcohol may subsequently agree to do so after having encountered an alcohol problem in their family.
Changes in perceptions of salience/leverage or cost/benefit over time promote the perception of random subject selection since they suggest any potential participant would have agreed to undertake the study at some point in time had their personal circumstances at that time been different. Since there are myriad factors affecting personal circumstances, a complete non-responders refusal to participate in a study despite meeting the selection criteria can be attributed to a confluence of events particular to that person at a given time rather than to some systematic effect common to the entire target group.
As appealing as the various explanations may be as to why everyone who meets the selection criteria fails to agree to participate in the study, they do not generally consider the influence personality factors may play in response propensity.
Research involving personality factors and complete non-response is both limited and of limited usefulness. Lubin et al. (1962) administered the Edwards Personal Preference Schedule (EPPS) to 72 students comprising an entire nursing class at a medical centre. Those students were subsequently mailed a questionnaire seeking their opinion on counseling services and asked to voluntarily complete and return that survey. The EPPS of the 54 students who returned the questionnaire were compared to the 18 who did not with the finding that responders had a significantly higher Dependency Ratio and Order score compared to nonresponders who were reported to score significantly higher on Aggression.
In 2005 the “Big Five” personality construct (see McCrae & Costa Jr., 1997 for a review) was introduced into the German Socio-Economic Panel (SOEP—an annual household survey begun in 1984) and was again used in 2009. Lang, John, Lüdtke, Schupp and Wagner (2011) used the Big Five data to examine, amongst other things, if the method of data collection might influence the social desirably of participant’s answers and so “... generate mode biases with respect to the consistency and reliability of personality constructs” (p. 551). Data obtained from a short-form version of the Big Five was administered face-to-face (N = 11,266), via computer assisted telephone interviewing (i.e. interviewers read the questions and response options aloud before recording the chosen response using specialized software, N = 1,178) and mailed out to some participants (i.e. self-administered, N = 8,085). The authors reported no difference in results between face-to-face and self-administration but noted an increase in “Openness” for computer assisted telephone interviewing thereby linking an aspect of personality to the likelihood of responding to a survey. Although, postulating on the reason for that result the authors acknowledged “We do not have a good explanation for this finding” (p. 563).
Through the administration of a class survey Rogelberg et al. (2003) assessed personality characteristics of 405 non self-selected university students using the Mini-Markers Big 5 personality measure (Saucier, 1994) as well as a number of other things including their satisfaction with University life, their intention to quit the University and their behavioral intentions regarding participating in future surveys. Two additional follow-up surveys were subsequently mailed to all students at three week intervals. Those surveys contained identifying codes that enabled the researchers to match responders and nonresponders with their answers to the initial “in class” survey. The results were used, in part, to identify personality differences between survey respondents, “active nonrespondents” i.e. those who reported a definite, conscious and overt decision not to respond to future surveys (approximately 15% of participants) and “passive nonrespondents” i.e. those who made no such decision but instead fail to respond presumably due to forgetfulness or their personal circumstances at the time. In general, both active and passive nonrespondents were found to be less significantly Conscientious than responders.
Almeida, Falcão, Coelho, Albino-Teixeira, Soares-da-Silva (2008) used “word-of-mouth” to recruit 120 healthy subjects into a phase 1 study of a new drug for the treatment of Parkinson’s disease. Volunteers were asked to provide demographic and socioeconomic information and requested to complete a number of psychological questionnaires including the Curiosity and Exploration Inventory-Trait (CEI-T), the Self-Efficacy Scale (SES) and the State-Trait Anxiety Inventory (STAI). In addition volunteers were also asked to indicate their willingness to participate in the phase 1 trial with a “Yes”, “No” or “Maybe” response. Of the 110 participants who provided usable data 59 refused participation (“No” response) with the remaining 51 indicating they could participate (“Yes” or “Maybe” response). A positive correlation with “exploratory tendencies” (CEI-T) and “initiative and persistence” (SES) along with a negative correlation with “trait anxiety” (STAI) were reported to be the only unique significant predictors of willingness to participate in the proposed phase 1 study. No effect for demographic or socioeconomic characteristics was found.
Although interesting, work on personality factors impacting volunteering behavior such as that outlined above is of limited usefulness for a number of reasons. Firstly, it is not generalizable. Lubin et al.’s (1962) finding that nursing students who returned a mailed questionnaire had a significantly higher Dependency Ratio and Order score than the more Aggressive nonresponders does not mean the healthy nonresponders in the Almeida et al. (2008) Parkinson’s Disease study nor the active and passive nonrespondents in the Rogelberg et al. (2003) study also shared those personality characteristics, and vice versa. Secondly is the issue of normative data. In using personality tests that have normative data, researchers assume their “representative” sample of volunteers reflects that normative data. If however, personality factors significantly influence volunteering behavior that may not be the case. Thirdly, the sheer number of personality characteristics that might impact volunteering behavior is enormous as are the number of research topics in all areas of the social sciences that requires volunteers. Both “leverage-salience” and “rational choice” theory predict only a subset of the target group will volunteer for a given study depending on how salient/”cost” effective the topic is to them. That subset will be further reduced due to potential volunteer’s personal circumstances at the time, concerns about stereotyping, privacy and confidentially, fear of crime and so on. It is therefore unlikely the current approach of different researchers testing for different personality characteristics specific to a given task and group of volunteers will identify a consistent and clear set of personality characteristics that may be common to all responders and nonresponders. Instead, the current approach can only build a limited and disjointed picture of some of the personality factors possibly associated with responders/complete nonresponders and so cannot provide clear directions for future research. A new approach aimed at identifying and understanding possible global personality factors that may significantly underpin volunteering behavior is needed. Without such an understanding real progress in quantifying, addressing and minimizing non-response bias may be virtually impossible.
There is some literature that hints at global personality characteristics influencing volunteering behavior. Groves (2006) in discussing the history of non-response rates/bias presented a mathematical expression for bias and notes it “...is compatible with the notion of a hard-core non respondent group” (Groves, 2006: p. 648). However that idea began to drop out of favour in the 1980’s in response to the observation that different surveys were found to elicit different response rates from the same population and so “... more researchers became attracted to the view that everyone is potentially a respondent or a non-respondent, depending on circumstances” (Groves, 2006: p. 648).
Klesges et al. (1999) had all US Air Force recruits entering the service from August 1995 to August 1996 complete a questionnaire as part of a Smoking Cessation Program. Willingness to be questioned about personal information was assessed by the last question in the survey which asked: “Imagine you are at home, someone calls you, they tell you they are conducting important research, and want to ask you some questions. Would you participate?” Possible responses were: “Yes,” “Yes, depending on the circumstances (e.g., if they call at a convenient time, how short the call is, whether I get paid),” and “No (I'd avoid them whenever they called, or hang up on them).” Of the 32,144 recruits 19.9% said “No”, indicating they would not participate in “important research” under any circumstances. That figure is surprisingly close to the approximately 15% of active nonresponders reported in the Rogelberg et al. (2003) study even though the two studies used different questionnaires’ and subject pools.
If underlying, global personality factors exist that significantly predispose some people to volunteer and others not, then there is potentially a systematic bias common to all representative samples that rely on volunteers. As a consequence, all “representative” samples would be skewed in favor of volunteers having those personality factors regardless of the selection criteria, recruitment method, incentive and statistical sampling techniques used to generate the sample and so may not be “representative” at all.
It is the purpose of this work to explore the possibility that not everyone who can participate in a study chooses to participate because global personality factors (in addition to personal circumstances, salience, cost/benefit etc) predispose them not to. A clear understanding of factors affecting the likelihood of a person agreeing to volunteer for a study is not only relevant to ensuring the representative sample required of social scientists, pollsters and market researchers, but may also be of importance to other areas of society reliant on volunteers (eg military, charities, blood donors, hospital volunteers etc).
Myers-Briggs Type Inventory (MBTI)
Identifying a (potentially) small group of personality factors likely to predispose individuals to volunteer for a study from a large pool of possibilities presents a daunting task. Attempting to be too specific runs the risk of finding nothing of significance as does attempting to be too broad.
A number of considerations impacted the final choice of assessment tool including the need to find a personality inventory whose output would not only be useful in identifying personality factors likely to affect response propensity, but might also provide direction for future work by offering insights into other salient personality factors not specifically assessed by the assessment tool.
The MBTI assess aspects of personality on four dichotomous scales, specifically: Introversion/Extraversion (E-I), Intuition/Sensing (N-S), Thinking/Feeling (T-F) and Judging/Perceiving (J-P). Since the scales are dichotomous individuals are assigned a single letter for each scale based on their numerical score for that scale with the resulting four-letter code representing their Myers-Briggs Personality Type. ENFP denotes an Extraverted, Intuitive, Feeling, Perceiving individual for example whereas ISTJ denotes an Introverted, Sensing, Thinking, Judging person.
The two letters from each of the four dichotomies can be combined in 16 ways (i.e. 2 × 2 × 2 × 2) resulting in 16 possible MBTI personality types. The MBTI then allows for the classification of all individuals into a relatively small number of personality types each with theoretically derived, well-defined personality profiles that contain information on the likely behaviors, values and beliefs of each type. Classification is clear-cut since it is based on numerical scores for each dichotomy and so reduces possible classification errors resulting from the need to “interpret” responses or assess interactions between various traits before assigning a category.
In addition to the above, the MBTI has a number of other advantages. Specifically• it provides for easy assessment of data consistency. For example, if the ENTP personality type is found to be the most over-represented then its exact opposite (ISFJ) should be most under-represented.
• the distribution of the 16 MBTI personality types has been established for the adult populations of both the United States and the United Kingdom, countries culturally similar to Australia. There is therefore reference data against which results can be compared.
• it can provide a measure of the amount of Introversion/Extraversion, Intuition/Sensing, Thinking/Feeling etc.
• Form M of the MBTI has a reading level of approximately 12 to 13 years old and so should be readily understood by most people aged over 18 (Myers, McCaulley, Quenk, & Hammer, 1998).
• it can be administered either individually or in groups.
• the theory underlying the MBTI can be used as a basis for predicting other behaviors associated with personality and volunteering which can then be tested.
It is for those reasons the Myers-Briggs Type Inventory-Form M (MBTI-M) was chosen for use in this work. It should be noted however that the MBTI is not without its critics (Mitchell, 2000; Pittenger, 2005; Zumbo & Taylor, 1993).
2. Materials and Methods
Participants
Participants were recruited for this study using the services of a market research company and via an interception technique.
Market Research Company. A senior marketing manager within a large national organization known to use market research companies to assess their products was approached and the purpose of the study outlined. That manager arranged for one of the authors (Dr. Ostojic) to attend a total of 10 focus groups over a period of about 8 weeks. Participants in the focus groups were supplied by the market research company from their database and chosen according to selection criteria supplied by the large national organization. The authors did not select which focus groups to attend but instead attended all focus groups available during that 8 week period.
All 10 focus groups were cognitive in nature with four aimed at obtaining feedback on a new product being considered for introduction by the organization with the remaining six focus groups dedicated to improving billing information. Focus groups ranged in size from 4 to 9 participants with roughly equal numbers of males and females in each group.
The researcher was presented to focus group members during the introductory phase of the focus group by a focus group leader. Participants were told they could chose to undertake an additional study being conducted by him at the conclusion of the focus group; that additional study would take approximately 20 mins and they would receive a $20 incentive payment if they participated. The researcher then left the room and watched the focus group from an observation area before re-entering at the conclusion of the focus group following a reminder by the group leader about the additional study.
The purpose of the study was explained and any participants unable or unwilling to participate were given the opportunity to leave. The MBTI-M was administered to those remaining. A total of 61 people (35 males, mean age = 38.7 years, SD = 11.7; 26 females, mean age = 35.8 years, SD = 12.5) agreed to participate with 2 females and 1 male declining ostensibly owing to other commitments.
Interception. Interception data involved a sensory task (i.e. wine tasting) undertaken at two different locations. The first was a local farmer’s market where a booth clearly marked as belonging to Charles Sturt University was established. The booth advertised one free cinema tickets for people agreeing to participate in the sensory task. In addition to people voluntarily visiting the booth, research assistants sporting University t-shirts approached passersby aged 18 and over and invited their participation.
People meeting the selection criteria and agreeing to participate in the study proceeded to do so and at its conclusion were given the opportunity to contribute to the current study. The purpose of the study was outlined and an incentive of one additional movie ticket offered. The MBTI-M was subsequently administered to those agreeing to contribute. A total of 97 people (42 males, mean age = 38.3 years, SD = 11.5; 55 females, mean age = 38.6 yrs, SD = 12.6) agreed to participate in the MBTI study at the farmer’s market.
The same methodology was employed at the second location where the booth was established at a food and wine exhibition. A total of 98 people (40 males, mean age = 41 years, SD = 18.0; missing = 13; 58 females, mean age = 40 years, SD =18; missing = 4) agreed to participate in the MBTI study at that location. The interception data then consisted of a total of 195 participants.
MBTI results for participants recruited by the market research firm and by the interception technique were combined to form a total pool of 256 participants comprising 117 males and 139 females. The rationale for combining the datasets was that there were no selection criteria per se for the current study.
Participants in this work were not recruited to complete an MBTI. Instead, they agreed to participate in a cognitive or sensory task and were recruited into that task using different recruitment methods. The option to complete an MBTI was unknown to participants at the time of agreeing to participate in their respective studies and so only subsequently formed a secondary task. The sole selection criterion for this study then was that participants met the selection criteria of other studies regardless of the issue under investigation or the recruitment method used. As such, their combined MBTI results was considered to be representative of the personality types who volunteer to participate in studies in general, rather than representative of the personality types who may be drawn to a specific study topic or specific recruitment method.
3. Results
The US population distribution of the 16 MBTI personality types is based on a “national representative sample” (NRS) which consisted of a total of 3009 participants roughly equally divided into males and females (1478 males, 1531 females) and weighted according to gender and ethnicity to match the 1990 US census (Myers et al., 1998). The distribution of the 16 personality types differs between males and females and so the combined distribution for the US NRS is shown in Figure 1 as is the adult normative data for the United Kingdom (based on a total of 1634 participants). The Figure shows that the 16 personality types are not uniformly distributed across the population (e.g. there are more ISFJ types than INFJ types) and that little discrepancy exists between the two distributions. Indeed, a mean difference of only 1.08% was found across all 16 types (SD = .74, derived from Table 14.1, p. 379, Myers et al., 1998) with a maximum discrepancy of 2.7% (between ISFP types). In light of the cultural similarity between the two countries such a result is perhaps not surprising.
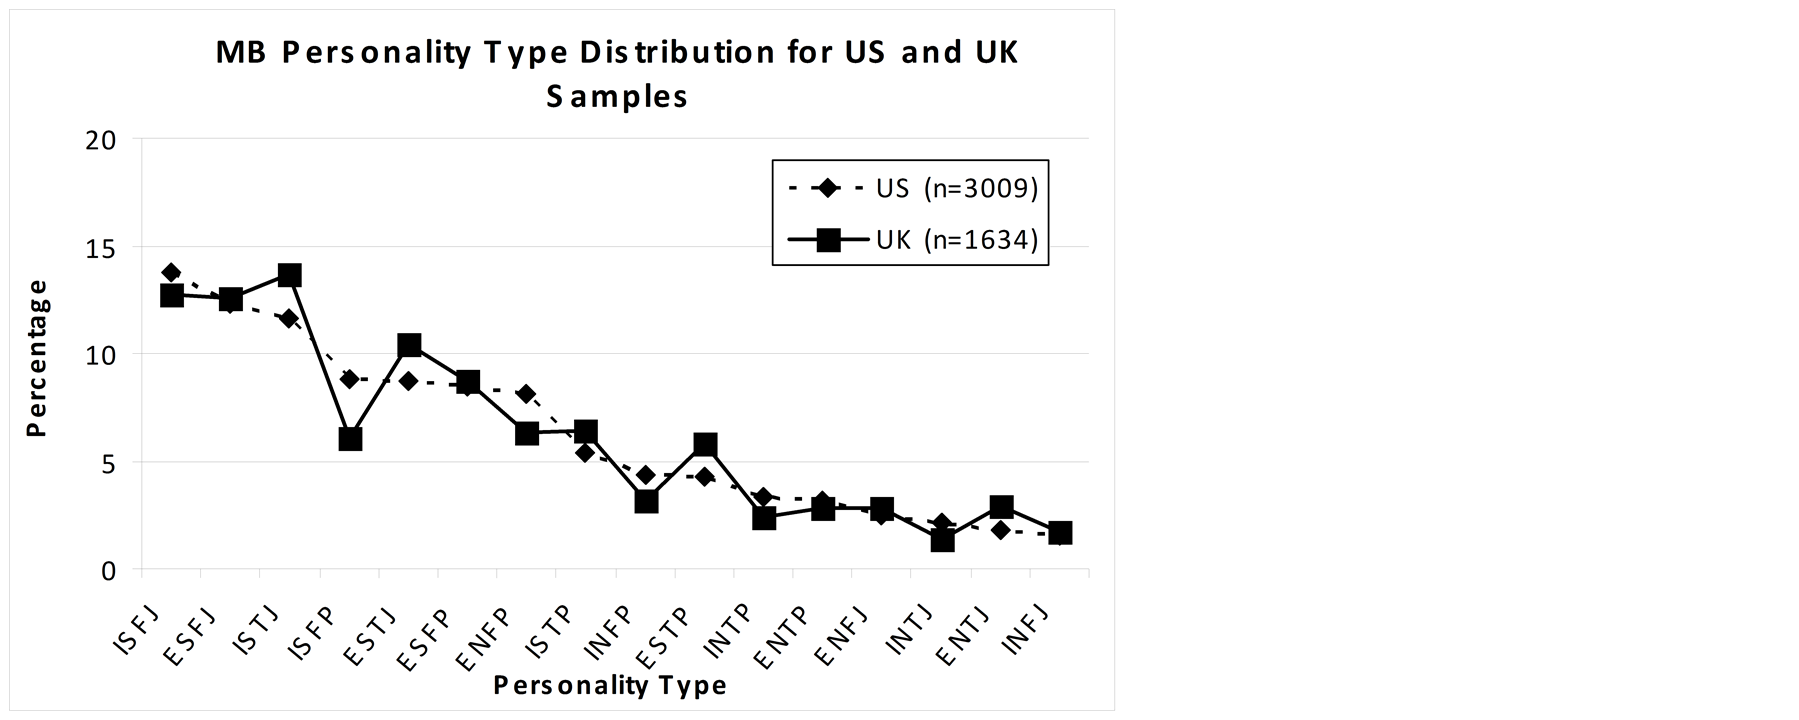
Figure 1. Distribution of the 16 MB personality types for both the US National Representative Sample (n = 3009) and the UK adult normative sample (n = 1634).
Owing to the similarity in the UK and US distributions but the larger sample size of the US NRS, it was decided to reference the results of this work against that standard. The US NRS is discussed further in Section 5.0.
Figure 2 shows the observed and expected distribution of the 16 MB personality types found in this study. Since the distribution of personality types differs between males and females the observed distribution was obtained by summing the number of males and females of each personality type to form the total for that type. The expected distribution was obtained from the percentages of each type reported in the NRS data. The percentages were applied to each personality type according to gender and then summed to provide the total for each type. The observed and expected values for each personality type are shown in Table 1.
Chi-square goodness-of-fit testing found a significant difference between the observed number of participants of the various MB personality types agreeing to participate in this study and the number expected to participate based on NRS data (Χ2 (15, n = 256) = 162.78, ρ < .005). Examination of the standard residuals from the Chi-square analysis in conjunction with Figure 2 shows that the personality types ISFJ, ESFJ, ISFP and ESFP were significantly under-represented relative to the NRS whereas the personality types ENFP, INFP, ENTP, ENFJ, INTJ, ENTJ and INFJ were significantly over-represented.
In an effort to establish if the differences were associated with recruitment method (i.e. market research firm or interception) the observed number of the various MB personality types for each recruitment method was compared to the number expected from the NRS. The results are presented in Figure 3 and Figure 4.
Figure 3 shows the observed and expected number of the 16 MB personality types for all 61 participants recruited via a market research firm. Chi-square goodness-of-fit testing found a significant difference between the observed number of participants with the various MB personality types recruited via a market research firm and the number expected from the NRS (Χ2 (15, n = 61) = 98.67, ρ < .005). Examination of the standard residuals from the Chi-square analysis in conjunction with Figure 3 shows that the personality types ISFJ and ISTJ were significantly under-represented whereas the personality types ENFP, INFP, ENTJ, and INFJ were significantly over-represented.
Figure 4 shows the observed and expected number of the 16 MB personality types for all 195 participants recruited using an interception technique. Significant differences were found between the observed and expected number of participants with various MB personality types recruited using an interception technique Χ2 (15, n = 195) = 105.79, ρ < .005). Examination of the standard residuals from the Chi-square analysis and Figure 4 showed the personality types ISFJ, ESFJ ISFP and ESFP were significantly under-represented whereas the personality types ENFP, INTP, ENTP, ENFJ, INTJ, ENTJ, and INFJ were significantly over-represented.
The results from Figure 3 and Figure 4 indicate the recruitment methods used in this work result in different personality types being under/over-represented when compared with the NRS.
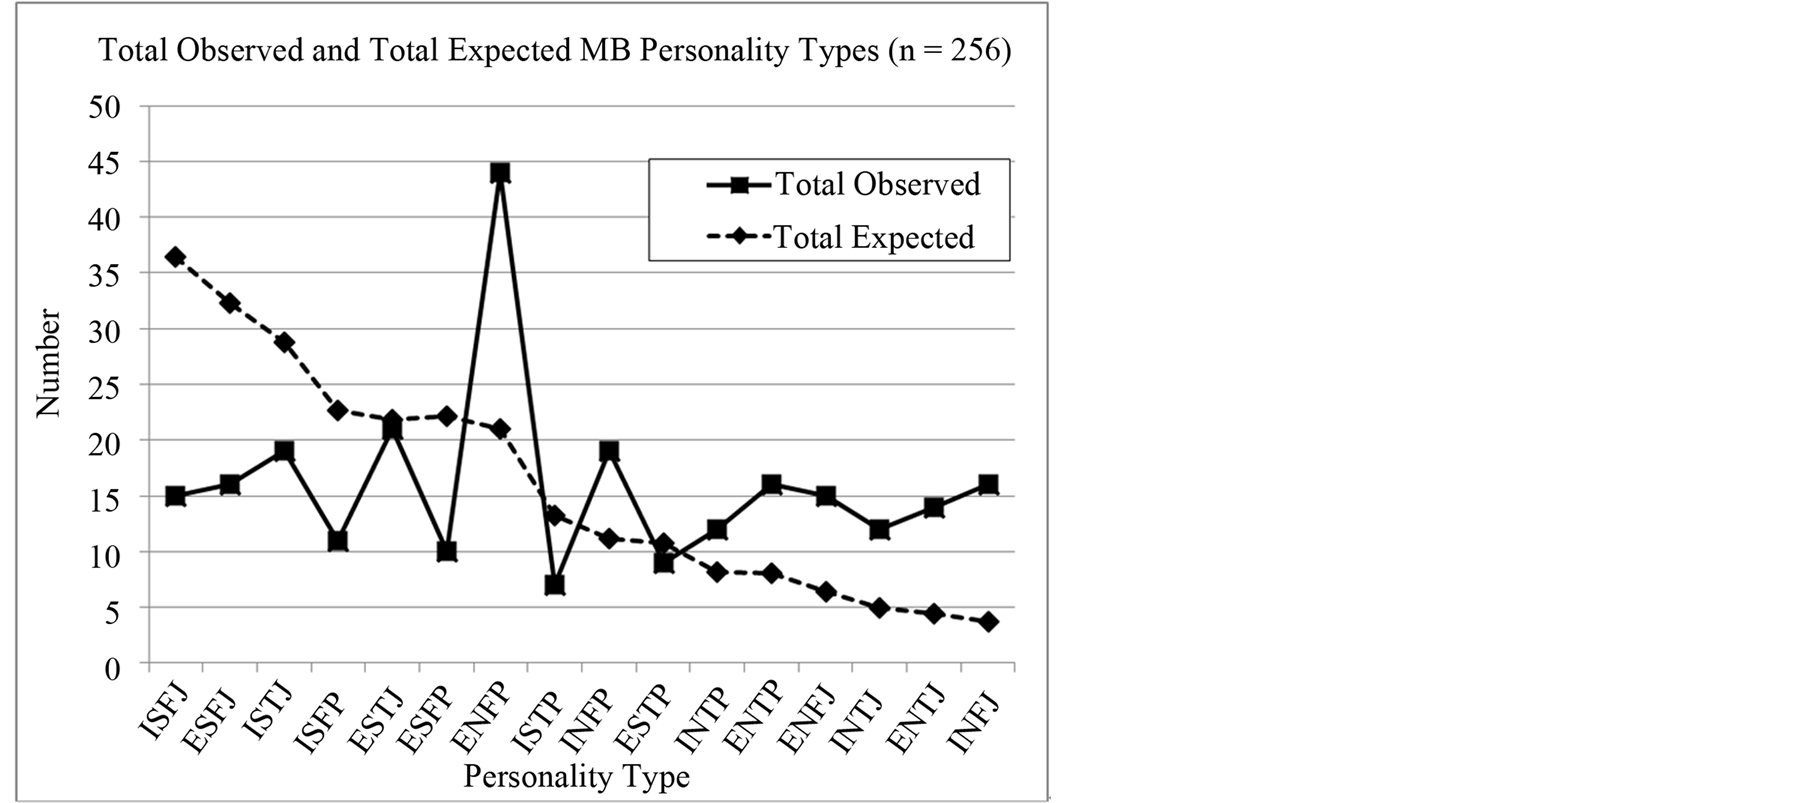
Figure 2. Comparison of the observed (n = 256) and expected number of the 16 MB personality types found in this work. Expected number was calculated according to the percentages of each type reported in the US National Representative Sample.

Table 1. Observed and expected number of male (n = 117) and female (n = 139) participants of each MB personality type found in this work. Expected values were calculated from the percentages of each type reported in the US National Representative Sample.
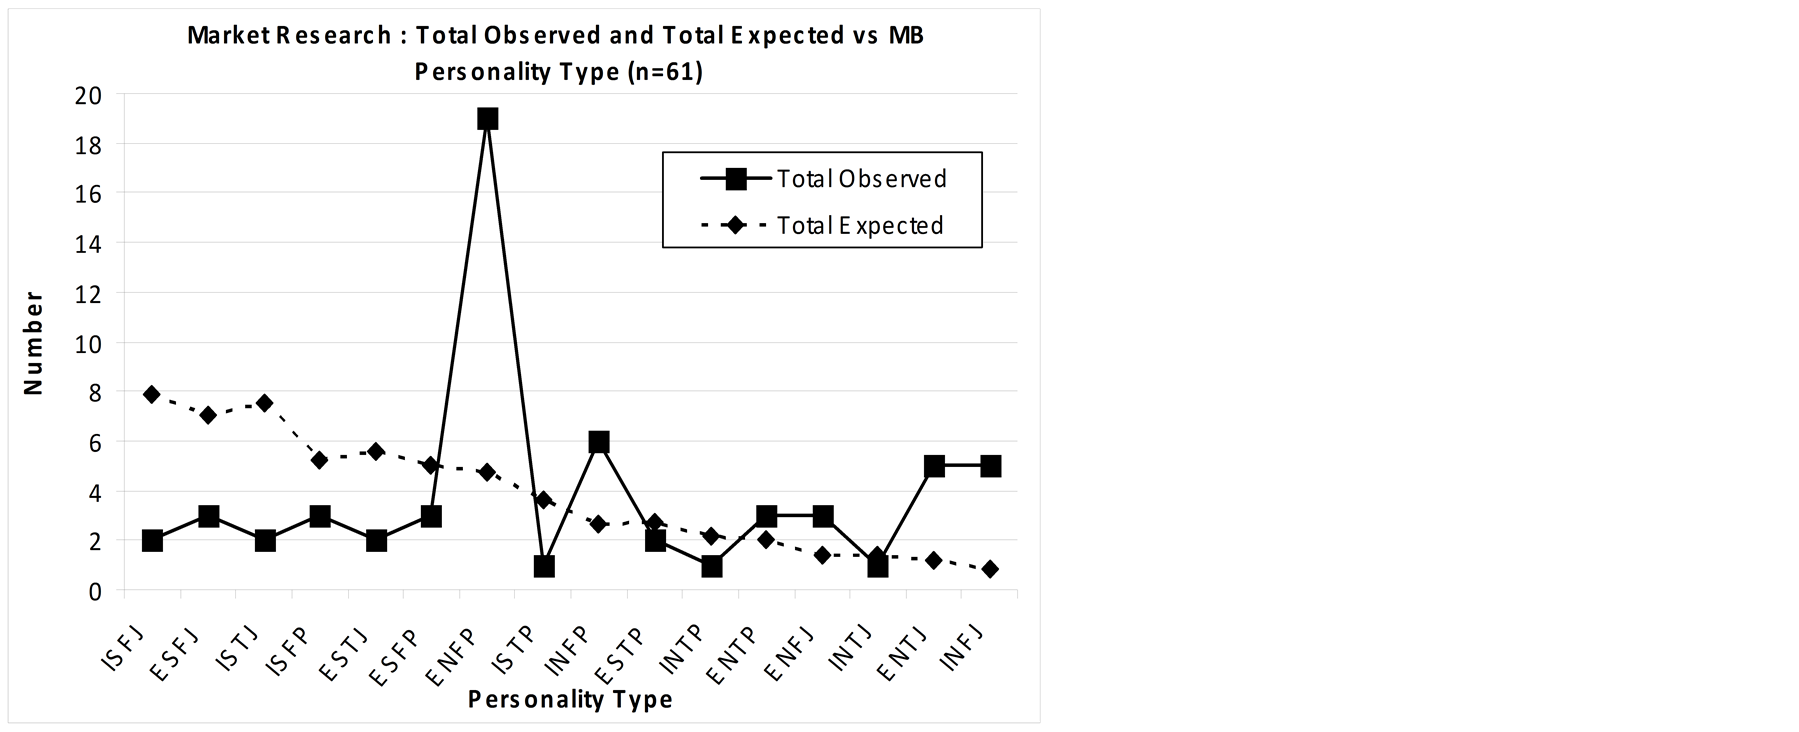
Figure 3. Comparison of the observed (n = 61) and expected number of the 16 MB personality types for participants recruited via a market research firm. Expected number was calculated according to the percentages of each type reported in the National Representative Sample.
Table 2 summarizes the findings of this section and indicates that not only are some personality types over/ under-represented relative to the NRS, but that different recruitment methods appear to be attractive to different personality types. The table also shows that all over-represented types have the Intuitive (N) dimension in common and are either NF (Intuitive/Feeling) or NT (Intuitive/Thinking) types regardless of method of recruitment.
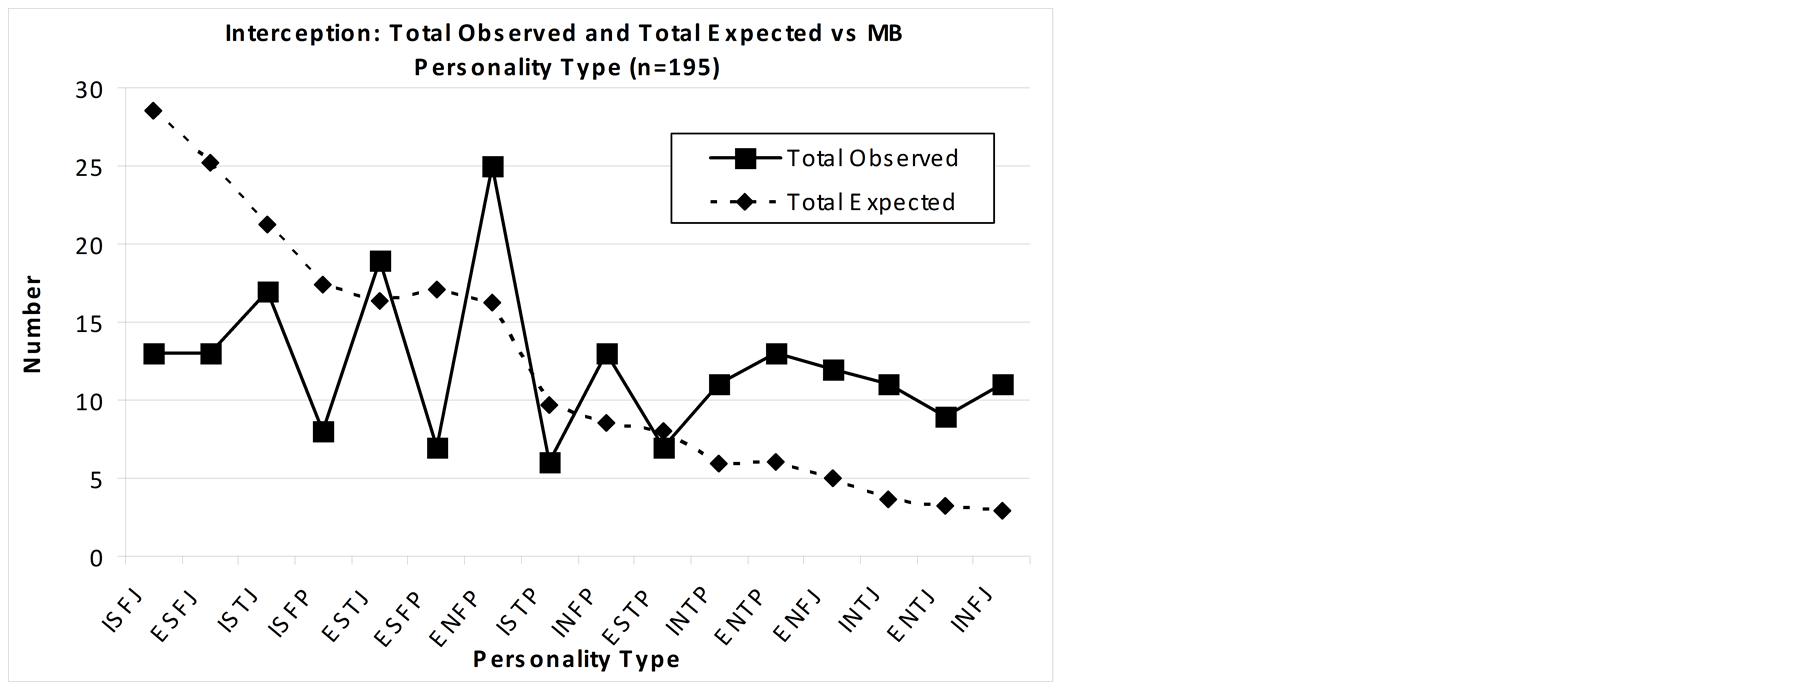
Figure 4. Comparison of the observed (n = 195) and expected number of the 16 MB personality types for participants recruited using an interception technique. Expected number was calculated according to the percentages of each type reported in the National Representative Sample.
Table 2. Over/under-representation of MB personality types relative to the NRS.
Similarly, all under-represented types have the Sensing (S) dimension in common and are either SF (Sensing/Feeling) or ST (Sensing/Thinking) types regardless of method of recruitment.
4. Discussion
This work was aimed to better understand volunteering behavior by examining the possibility that personality characteristics may give rise to a predisposition to volunteer and so may play a major part in who volunteers, along with factors such as personal circumstances, salience, cost/benefit etc.
No specific selection criteria were used to recruit participants into the current study. Instead, participants recruited via market research/interception methodology and meeting the selection criteria of other studies formed the participant pool for this work. Since personality type was not part of the selection criteria for those studies and participants in those studies were considered to be representative of the target group, they must also be considered as representative of the personality types who agree to participate in studies.
The Myers-Briggs Type Inventory-Form M (MBTI-M) was used to assess personality type with the result that a number of personality types were found to be over-represented and under-represented when compared with the United States National Representative Sample (US NRS). A variety of possibilities exist to explain that difference with the most obvious being that the distribution of MB personality types in the Australian population differs significantly to the distribution of the American (and UK, see Figure 1) population.
Although no normative data has been reported for the Australian population, some relevant studies can provide an insight into the likely distribution of MB personality types in Australia. For example, a comparison of type distribution between high school students in Pennsylvania (n = 9320) and Australia (n = 3373) found a mean discrepancy across all 16 types of 1.4% (SD = 1.11, derived from Table 14.2, p.380, Myers et al., 1998) with a maximum discrepancy of 3.8% (between ESFJ types). Similarly, and as previously mentioned in Section 4, a comparison between adult normative data for the United Kingdom (n = 1,634) and the US NRS showed a mean difference of 1.08% across all 16 types (SD = 0.74) and a maximum discrepancy of 2.7% (between ISFP types). In contrast, a much larger mean discrepancy of 3.9% (SD = 2.3) across all 16 types was found in this work as was a maximum discrepancy of 9.1% (between ENFP types). Such large differences between the Pennsylvania/UK results and those found here are difficult to explain in light of the cultural similarities between the US, the UK and Australia.
Further, Myers et al. (1998) report that “The most notable pattern in all the normative samples…..is the predominance of ISJ and ESJ types” with the four types comprising that group (i.e. ISFJ, ISTJ, ESFJ and ESTJ) totaling 44 to 52% of the normative sample (p. 379). Indeed, ISJ and ESJ types constitute 46.4% of the US NRS and 49.4% of the UK sample in contrast to only 27.73% of the current sample. In addition, the four major types in the current study were found to be ENFP, INFP, ESTJ, and ISTJ, accounting for 40.23% of the total. Once again, it is difficult to envisage a mechanism that would account for Australia not conforming to the “most notable pattern” observed in other normative data.
Another possibility to explain the observed difference between the distribution of personality types in the Australian population and the US may lay in the recruitment methods used. Since this work found the type distribution of participants recruited through a market research company and via an interception technique differed significantly from the US NRS it may be that that different recruitment methods attract different personality types. Introverted-Thinking types for example may be less inclined than Extroverted-Feeling types to participate in a sensory task when asked to do so by a stranger in a public place (interception). They may however, be more likely to agree to participate in a small group engaged in a cognitive task (market research).
A significant body of research indicates different preferences amongst the MB personality types. Myers et al. (1998) for example report a higher proportion of Thinking types amongst engineering students than liberal arts students (p. 187) while Hicks (1984) found Intuitive types read more books than Sensing types. It may be then that it is the type of task, rather than the method of recruitment, that appeals to different personality types. Different tasks were indeed employed in the US NRS and the market research and interception work reported here. Participants in the US NRS were recruited solely to complete a psychological inventory (the MBTI) whereas participants in the market research study and the interception study were not. Participants in the market research work were recruited to undertake a cognitive task (e.g. feedback on a potential new product or to improve billing information) and were only made aware of the MBTI task after having participated in that task. Similarly, participants recruited via the interception technique volunteered to participate in a sensory study (wine tasting) and were introduced to the MBTI task only after completing the sensory task. The observed difference in type distributions then may reflect the differing interests of the various personality types and hence their propensity to agree to participate in a particular study.
The observed disparity in MB type distributions between participants recruited by a market research company, via an interception technique and the US NRS is difficult to explain in terms of population differences, especially in light of the cultural similarities between Australia and the US. Instead, the observed differences may reflect the appeal of different recruitment methods or tasks, or a combination of the two, to different personality types. The possibility that different recruitment methods/tasks appeal to different personality types may significantly impact MBTI normative data.
The distribution of personality types in the NRS is based on a telephone interception technique requiring delayed task completion, in this case the completion/return of a questionnaire some time after first agreeing to participate in the study. In light of the finding that the type distribution of the interception (telephone), questionnaire-based NRS data was significantly different to that of the interception (face-to-face), sensory-based data found in this work, it is possible the NRS reflects the method of recruitment/task rather than the true distribution of MB personality types in the US population and so the true distribution remains unknown. Some support for that contention can be found in the work of Lang et al. (2011). They reported an increase in the Big Five factor of “Openness” for computer assisted telephone interviewing compared with other data collection methods and so established a link between an aspect of personality and the method of recruitment/data collection.
The importance of the relative appeal of different recruitment methods to different personality types is likely to become increasingly significant as the popularity of internet-based surveys amongst researchers grows. It is of interest to note that all over-represented personality types in this work shared the common trait of “Intuition”. Internal consistency therefore dictates all under-represented types to share the opposite trait of “Sensing” and Table 2 shows that was indeed found to be the case.
All over-represented personality types were found to be either NF or NT types and so all reportedly exhibit (N) a “grasp of possibilities” as well as either (F) “warmth and sympathy” or (T) “logic and analysis”. Similarly, all under-represented types were found to be either SF or ST types and so all exhibit (S) a “reliance on facts” as well as either (F) “warmth and sympathy” or (T) “logic and analysis” (Table 4.2, p. 38, Myers et al., 1998). Both overand under-represented types then all seem to share “warmth and sympathy” or “logic and analysis” but differ in their “grasp of possibilities” and “reliance on facts”.
The overarching “grasp of possibilities” in N-types may result in a general predisposition of such types to volunteer for tasks involving new or innovative ideas. “Warmth and sympathy” towards the researcher/other participants may further drive NF types to volunteer whereas the chance to apply “logic and analysis” to an innovative concept may provide additional attraction for NT types to agree to participate in such a study.
While “Warmth and sympathy” towards the researcher/other participants or the chance to apply “logic and analysis” may also apply to SF and ST types respectively, they are less likely to be drawn to a task involving new or innovative ideas since such tasks, by their nature, preclude a “reliance on facts”.
All tasks undertaken in this work involved a “grasp of possibilities” and had little reliance on facts. The US NRS involved completing a new psychological inventory; the market research studies involved a new product or new billing information while the interception study was purely sensory in nature. It is not surprising then that Intuitive types were found to be over-represented and Sensing types are under-represented.
Summary and Conclusions. Results of this study indicate that certain Myers-Briggs personality types are predisposed to participating in studies irrespective of the selection criteria and the statistical sampling methodology used. Intuition (N, a grasp of possibilities) appears to be a key predisposing factor in favour of volunteering since all over-represented types were found to have the “Intuitive” (N) dimension in common and to be either Intuitive-Feeling (NF) or Intuitive-Thinking (NT) types. In contrast, “Sensing” (S, a reliance on facts) seems to give rise to a predisposition not to volunteer for studies. This suggests that the way information on a proposed research topic is presented to potential volunteers may influence their decision to participate and so the current “one size fits all” approach may not be the most fruitful. Instead, presenting information on the future possibilities of a project would be expected to appeal to “Intuitives” whereas providing factual data on the likely outcome/benefits of the research should be more attractive to “Sensitives”. Such a multi-pronged approach to explaining proposed research would be expected to lead to a broader range of personalities agreeing to participate than is currently the case.
Recruitment method and/or type of task appear to appeal to different personality types and so may help explain why the type distributions found in this work do not reflect that of the US NRS. It may be that US NRS better reflects the personality types attracted to a psychological task and recruited via telephone interception technique than the true type distribution of the American population.
It should be stated that while certain personality characteristics seem to predispose people to volunteer, there is currently no evidence to suggest the resulting non-response bias would significantly alter the outcome of studies. That is an area for future work. However, should it be found that a significant non-response bias based on personality type/characteristics does indeed exist the impact would be two-fold. Firstly, selection criteria would need to be broadened to include representative personality types/characteristics and so the establishment of normative data, particularly around recruitment method, would need to be undertaken as a matter of priority.
Secondly, the possibility may have to be entertained that the “representative” samples used in social science research to date may not have been representative at all. Instead, they may have displayed consistent and widespread non-response bias. The generalizability of past research findings in areas such as Psychology, Sociology and Market Research to the broader community could therefore be questionable and so, consequently, could the true state of knowledge regarding human behavior. The implications are potentially profound and so further research in the area of personality type/characteristics and propensity to volunteer is strongly encouraged.
Acknowledgements
This work was completed with the assistance of a Charles Sturt University Faculty of Arts grant.
References
- Almeida, L., Falcão, A., Coelho, R., Albino-Teixeira, A., & Soares-da-Silva, P. (2008). The Role of Socioeconomic Conditions and Psychological Factors in the Willingness to Volunteer for Phase I Studies. Pharmaceutical Medicine, 22, 367- 374. http://dx.doi.org/10.1007/BF03256734
- Berger, L. K., Begun, A. L., & Otto-Salaj, L. L. (2009). Participant Recruitment in Intervention Research: Scientific Integrity and Cost-Effective Strategies. International Journal of Social Research Methodology, 12, 79-92. http://dx.doi.org/10.1080/13645570701606077
- Groves, R. M. (2006). Nonresponse Rates and Nonresponse Bias in Household Surveys. Public Opinion Quarterly, 70, 646- 675. http://dx.doi.org/10.1093/poq/nfl033
- Groves, R. M., Singer, E., & Corning, A. (2000). Leverage-Saliency Theory of Survey Participation: Description and an Illustration. The Public Opinion Quarterly, 64, 299-308. http://dx.doi.org/10.1086/317990
- Hansen, M. H., & Hurwitz, W. N. (1946). The Problem of Non-Response in Sample Surveys. Journal of the American Statistical Association, 41, 517-529. http://dx.doi.org/10.1080/01621459.1946.10501894
- Hattie, J. (1983). The Tendency to Omit Items: Another Deviant Response Characteristic. Educational and Psychological Measurement, 43, 1041-1045. http://dx.doi.org/10.1177/001316448304300412
- Hicks, L. E. (1984). Conceptual and Empirical Analysis of Some Assumptions of an Explicitly Typological Theory. Journal of Personality and Social Psychology, 46, 1118-1131. http://dx.doi.org/10.1037/0022-3514.46.5.1118
- Hulley, S. B., Cummings, S. R., Browner, W. S., Grady, D. G., & Newman, T. B. (2013). Designing Clinical Research: An Epidemiologic Approach (2nd ed.). Philadelphia: Lippincott, Williams & Wilkins.
- Klesges, R. C., Williamson, J. E., Somes, G. W., Talcott, G. W., Lando, H. A., & Haddock, C. K. (1999). A Population Comparison of Participants and Nonparticipants in a Health Survey. American Journal of Public Health, 89, 1228-1231. http://dx.doi.org/10.2105/AJPH.89.8.1228
- Lang, F. R., John, D., Lüdtke, O., Schupp, J., & Wagner, G. G. (2011). Short Assessment of the Big Five: Robust across Survey Methods except Telephone Interviewing. Behavior Research Methods, 43, 548-567. http://dx.doi.org/10.3758/s13428-011-0066-z
- Lee, S., Brown, E. R., Grant, D., Belin, T. R., & Brick, J. M. (2009). Exploring Nonresponse Bias in a Health Survey Using Neighborhood Characteristics. American Journal of Public Health, 99, 1811-1817. http://dx.doi.org/10.2105/AJPH.2008.154161
- Lubin, B., Levitt, E. E., & Zuckerman, M. (1962). Some Personality Differences between Responders and Nonresponders to a Survey Questionnaire. Journal of Consulting Psychology, 26, 192. http://dx.doi.org/10.1037/h0048697
- Marcus, B., & Schütz, A. (2005). Who Are the People Reluctant to Participate in Research? Personality Correlates of Four Different Types of Nonresponse as Inferred from Selfand Observer Ratings. Journal of Personality, 73, 959-984. http://dx.doi.org/10.1111/j.1467-6494.2005.00335.x
- McCrae, R. R., & Costa Jr., P. T. (1997). Personality Trait Structure as a Human Universal. American Psychologist, 52, 509- 516. http://dx.doi.org/10.1037/0003-066X.52.5.509
- Mitchell, W. (2000). Cautions Regarding Aggregated Data Analyses in Type Research. Journal of Psychological Type, 53, 19-30.
- Myers, I. B., McCaulley, M. H., Quenk, N. L., & Hammer, A. L. (1998). The MBTI® Manual: A Guide to the Development and Use of the Myers-Briggs Type Indicator. Palo Alto: Consulting Psychologists Press.
- Pittenger, D. J. (2005). Cautionary Comments Regarding the Myers-Briggs Type Indicator. Consulting Psychology Journal: Practice and Research, 57, 210. http://dx.doi.org/10.1037/1065-9293.57.3.210
- Rogelberg, S. G., Conway, J. M., Sederburg, M. E., Spitzmüller, C., Aziz, S., & Knight, W. E. (2003). Profiling Active and Passive Nonrespondents to an Organizational Survey. Journal of Applied Psychology, 88, 1104. http://dx.doi.org/10.1037/0021-9010.88.6.1104
- Rogelberg, S. G., & Luong, A. (1998). Nonresponse to Mailed Surveys: A Review and Guide. Current Directions in Psychological Science, 7, 60-65. http://dx.doi.org/10.1111/1467-8721.ep13175675
- Saucier, G. (1994). Mini-Markers: A brief Version of Goldberg’s Unipolar Big-Five Markers. Journal of Personality Assessment, 63, 506-516. http://dx.doi.org/10.1207/s15327752jpa6303_8
- Schräpler, J., Schupp, J., & Wagner, G. (2010). Individual and Neighborhood Determinants of Survey Nonresponse: Technical Report.
- Scott, J. (2000). Rational Choice Theory. In G. Browning, A. Halcli, & F. Webster (Eds.), Understanding Contemporary Society: Theories of the Present (pp. 126-138). London: Sage Publications. http://dx.doi.org/10.4135/9781446218310.n9
- Smith, M., & Senior, C. (2001). The Internet and Clinical Psychology: A General Review of the Implications. Clinical Psychology Review, 21, 129-136. http://dx.doi.org/10.1016/S0272-7358(99)00043-4
- Zumbo, B. D., & Taylor, S. V. (1993). The Construct Validity of the Extraversion Subscales of the Myers-Briggs Type Indicator. Canadian Journal of Behavioural Science/Revue Canadienne des Sciences du Comportement, 25, 590-604. http://dx.doi.org/10.1037/h0078847