Journal of Environmental Protection
Vol. 4 No. 7A (2013) , Article ID: 34276 , 8 pages DOI:10.4236/jep.2013.47A007
Analytical Monitoring of the Chemicals Present in the Discharge Water Generated by the Surface Treatment Industry
![]()
1Université de Franche-Comté, Chrono-Environnement, Besançon Cedex, France; 2Agence de l’Eau Rhône-Méditerranée-Corse, Délégation de Besançon, Besançon Cedex, France; 3Agence de l’Eau Rhône-Méditerranée-Corse, Département des Interventions et des Actions de Bassin, Lyon Cedex, France.
Email: *nadia.crini@univ-fcomte.fr
Copyright © 2013 Nadia Morin-Crini et al. This is an open access article distributed under the Creative Commons Attribution License, which permits unrestricted use, distribution, and reproduction in any medium, provided the original work is properly cited.
Received May 20th, 2013; revised June 28th, 2013; accepted July 9th, 2013
Keywords: Discharge Water; Metal-Finishing Industry; Hazardous Substances; Analytical Monitoring
ABSTRACT
Industrial discharge water, and especially that from the surface treatment industry (ST), contains non-negligible amounts of pollutants even though the legislation is fully respected. In spite of this, no detailed studies list the exact chemical composition of these effluents. The present study reports the results of analyses performed over a 6-month period involving 15 standard water parameters. Over 160 substances including 33 metals, 58 volatile organic compounds (VOCs), 16 polycyclic aromatic hydrocarbons (PAHs), 24 chlorophenols (CPs), 16 alkylphenols (APs), 5 chloroanilines (CAs) and 7 polychlorobiphenyls (PCBs) were monitored. The industrial effluents presented polycontamination involving metals, minerals and organics with a high degree of qualitative and quantitative variability. Of the 160 substances monitored, 46 were regularly found: 25 inorganics including 8 metals (Co, Cr, Cu, Fe, Ni, Pb, Sn, Zn) and 21 organics (4 PAHs, 10 VOCs, 4 CPs and 3 APs). Eighteen were systematically presented at quantifiable levels.
1. Introduction
In 1976, European legislation classified chemicals into two main lists of priority substances or groups of priority substances (Directive 76/464/EEC of 4 May 1976). The first called “The Black List” or “List I” concerns particularly dangerous substances such as hexachlorobenzene, pentachlorophenol, trichloromethane, mercury and cadmium, substances considered to be highly toxic, persistent and bio-accumulative. The second list i.e. “List II” or “The Grey List” gathers priority substances, such as benzene, dichloromethane, lead and nickel, which are considered to be less toxic than those of List I but nevertheless to present a significant risk to the environment [1-4]. These lists were then completed, following the Water Framework Directive of 2000 (Directive 2000/60/ EC, WFD 23 October 2000) which aims to achieve good chemical and ecological status of all water bodies in Europe [1-3]. The WFD focuses in particular on ensuring a reduction of the volumes of effluent discharged and on monitoring target substances for which objectives of reduction and/or elimination were laid down to occur over a defined period of time. Currently in France, the list of substances included in the characterization of good chemical status includes 41 substances classified into three broad categories. The first concerns 13 substances blacklisted by the WFD including for instance 4-p-nonylphenol, anthracene, mercury and cadmium, for which the French target is a 50% reduction in releases by 2015 and the European target, elimination of discharges by November 2021 or December 2028. The second category covers 20 WFD priority substances, such as naphthalene, trichlorobenzene, octylphenols, dichloromethane, lead and nickel; the national objective for them is a 30% reduction in their release by 2015 while no deadline has been fixed at the European level. The other eight substances such as trichlorethylene and carbon tetrachloride were on list I of the 1976 directive, but are not included in the current WFD; the French objective for these molecules is a 50% reduction in discharges by 2015. Note that there is also another category which includes 139 substances on list II of 1976, including, for example, toluene, 1,2-dichlorobenzene, copper and zinc, which are also concerned by a national reduction plan (10% reduction by 2015).
The surface treatment (ST) industry is particularly affected by many of the chemicals mentioned [5-9]. Indeed, among industrial activities as a whole, ST is currently considered to be one of the sectors that consumes the most water and chemicals, and therefore one of the largest producers of wastewater, although a huge effort has been made in water treatment for over 20 years by ST plants [8,9]. To treat their wastewater, the ST sector generally uses physico-chemical methods, making various substances insoluble then separating the purified water from the sludge formed [10,11]. However, it is known that this decontamination technique cannot eliminate all pollutants. Even though it complies with the regulations in force, ST effluent contains significant mineral and organic polycontamination. Currently, Europe asks manufacturers to innovate to reduce and/or eliminate any chemicals present in their wastewater. However, before any actions can be taken to move towards zero pollution discharge, it is necessary to identify all the pollutants in the effluents qualitatively and quantitatively [2,3,10,11]. But, to our knowledge, there is no literature on this issue, in particular concerning the cocktails of chemicals present in the discharge water from the ST industry.
In the present study, we report the results of analytical monitoring of the chemical composition of the water discharged from a surface treatment company. To do this, we collected effluents characteristic of the industrial activity over six consecutive months, measured several parameters of the water and identified the presence of numerous chemicals to characterize the effluents.
2. Materials and Methods
2.1. Sampling
Wastewater was taken at the outflow from Galvanoplast Co Ltd located in Les Aynans (Haute-Saône, France). Galvanoplast specialises in galvanisation, phosphatation, electrophoretic painting and flake coating, all processes designed to protect metal parts against corrosion. To process its waste water, the company uses a physico-chemical treatment composed of three main steps: 1) pretreatment for hexavalent chrome, 2) treatment by chemical precipitation of the whole range of metal pollutants and 3) flocculation-decantation to separate the sludge formed from the water (defined as the wastewater) which then flows into the river if it satisfies legal requirements. Effluent outflow rate averaged ~8 m3/h. Each sample of wastewater was representative of a whole day’s activity. We sampled one outflow per month over 6 consecutive months. The three main concerns for the environment arise from the levels of zinc, nickel and COD (chemical oxygen demand) which are not far from the authorized limit.
2.2. Chemical Analysis
Full chemical characterisation of the wastewater was carried out by measuring several conventional parameters of the water and by looking for the presence of various chemicals. Thus, we measured 15 parameters and checked for the presence of 160 chemicals in the 6 samples. The water parameters monitored were: pH, conductivity, suspended solids (SS), COD, biological oxygen demand (BOD), total organic carbon (TOC), the levels of the different forms of nitrogen (nitrates, nitrites, ammonium nitrogen and Kjeldahl nitrogen), adsorbable halogenated organic compounds (AOX), the hydrocarbon index, free chlorine, and cyanides (total CN and easily released CN). In order to identify the inorganic and organic pollutants present in the wastewater, we analysed eight broad categories of substances classified as follows: inorganic compounds including metals (33 metal ions), volatile organic compounds (VOCs, 58 molecules), polycyclic aromatic hydrocarbons (PAHs, 16 molecules), chlorophenols (CPs, 24 molecules) alkylphenols (APs, 16 molecules), chloroanilines (CAs, 5 molecules), polychlorobiphenyls (PCBs, 7 molecules) and other substances (4 organo-tin complexes, and a few other molecules). The experimental protocols have already been detailed elsewhere [10,11]. The COD was assessed following protocol ISO 15705 which requires oxidation by potassium bichromate in hot acid medium (150˚C) for 2 hours. The equipment used was the Vario COD measurement system (Aqualytic, Dortmund, Germany) with Eco8 reactors from Velp Scientifica (Milan Italy). The 5-day BOD protocol involved measurement of the initial concentration of O2 initially dissolved in the sample (C0) and the concentration of O2 after five days of incubation in the darkness at 20˚C (Cs). The BOD5 was thus equal to C0 - C5 and is expressed in mg of O2/L. We used the so-called respiration method following standard NF EN 1899-2 which measures the consumption of O2 through the drop in pressure in the vials by means of a manometer and a KOH trap to absorb the CO2 evolved through respiration. The method is simple, reproducible and reliable (no problems of dilution) but is rather time-consuming (5-day incubation). The measurements were made with an OxiDirect system and an ET 618-4 incubator (both from Aqualytic, Dortmund, Germany). Metal analysis was performed by ICP-AES (ThermoFisher, iCAP 6500 radial model, Courtaboeuf, France) fitted with a rapid sampling loop (FAST). An internal standard, Yttrium, was added continuously in order to overcome any variation in the response of the instrument during analysis. Analysis accuracy was estimated using certified references (Hard Drinking Water, ERM-CA011, LGC Promochem, Molsheim, France). Quality control (half a point on the calibration scale prepared independently of the calibration) was inserted every 10 samples to check for the absence of drift. The concentrations of other ions were measured by ionic chromatography (orthophosphates, nitrites) or by photometry (F, B) following standard French protocols (NF EN ISO 10304 for anions). The VOCs (NF EN ISO 15680), PAHs (MET 72G), CPs (NF EN 12673), AOX (NF EN ISO 9562), CAs (MET INT), hydrocarbon index (NF EN ISO9377) and APs (MET INT) were analysed by an accredited analysis laboratory (LCDI, Marange, France). The results are expressed in mg/L or µg/L.
3. Results
Which parameters and pollutants to monitor? The choice of parameters and substances was determined by the regulatory requirements specifically laid down for the surface finishing plant (as stipulated in the French law of 5 September 2006). The company must monitor a clearly defined set of parameters and substances for which limit levels have been fixed by county law (Table 1). The company must permanently record the volume of water
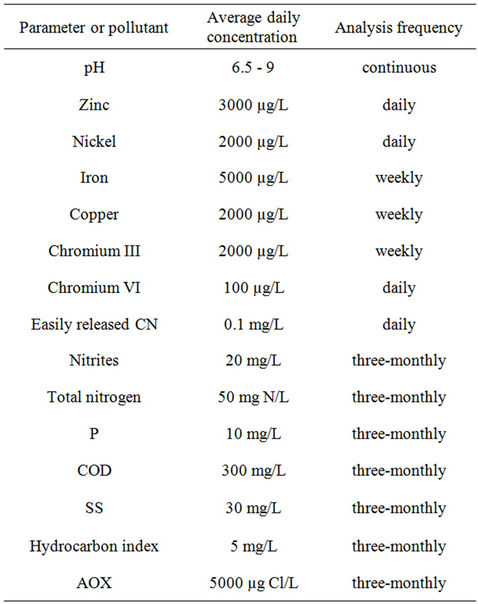
Table 1. Maximum authorized levels of emission in treated industrial discharge water, expressed in average concentrations.
discharged and the pH, and also make a daily records of the temperature and the levels of chromium VI, nickel, zinc and easily released cyanides. Then, once a week, it must follow its concentrations of chromium III, copper and iron. Finally, every quarter, an accredited laboratory must determine Cr(VI), Cr(III), Cu, Fe, Ni, Zn, P, F, SS, NTOT, CN, COD, nitrites, the hydrocarbon index and the AOX. Note that no organics are mentioned in this list. However, following the recommendations of 5 January 2009 concerning dangerous substances in water, the ST companies must monitor new target molecules for the ST industry including nonylphenols, fluoranthene, naphthalene, anthracene, trichloroethylene, tetrachloroethylene, dichloromethane, carbon tetrachloride and toluene.
3.1. Water Parameters
Table 2 shows the results obtained for the 15 water parameters measured in the six samples. The discharge water samples were slightly alkaline (mean pH of 8.04 at 20˚C). They did not present significant turbidity (low levels of SS) and were not biodegradable (very low BOD). On the other hand, they showed high conductivity (mean value 5969 ± 386 µS/cm) and relatively high levels of organic pollution with a mean COD of 198 ± 26 mg/L and TOC of 48.7 ± 6.3 mg/L. High levels can also be seen in total nitrogen (71.7 ± 4.8 mg/L) and AOX (1020 ± 200 µg Cl/L). The hydrocarbon index, cyanides (total and easily released) and free chlorine were lower than the quantification limit (Table 2).
3.2. Inorganic Substances
The results reported in Table 3 confirm the high salinity of the discharge water with high levels of chloride ion (mean value 1650 ± 339 mg/L), sulphates (258 ± 16 mg/L), calcium (175 ± 13 mg/L) and sodium (1057 ± 116 mg/L). These results are also in agreement with the issues faced by the company concerning the levels of zinc and nickel, occurring at high levels (mean values 874 ± 98 µg/L and 408 ± 111 µg/L respectively), even though they remain below the authorized limits (Table 1). Ten other metals were also found at quantifiable levels (Table 3): Li, Mn, Mo, Se, Co, Cr, Cu, Fe, Pb and Sn. The concentration of other metals remained below the limit of quantification (Al, Ba, Cd, Sr, Ti and V), or below the limit of detection (Sb, As, Cr VI, Hg, Pd, Pt, Ag, Te, Tl, W).
3.3. Organic Substances
Twenty-one organic substances were identified and quantified including certain VOCs, PAHs, CPs and APs (Table 4). In the first category, only chloroform was systematically found in all six effluent samples. All the other substances, in particular chloroanilines and poly-
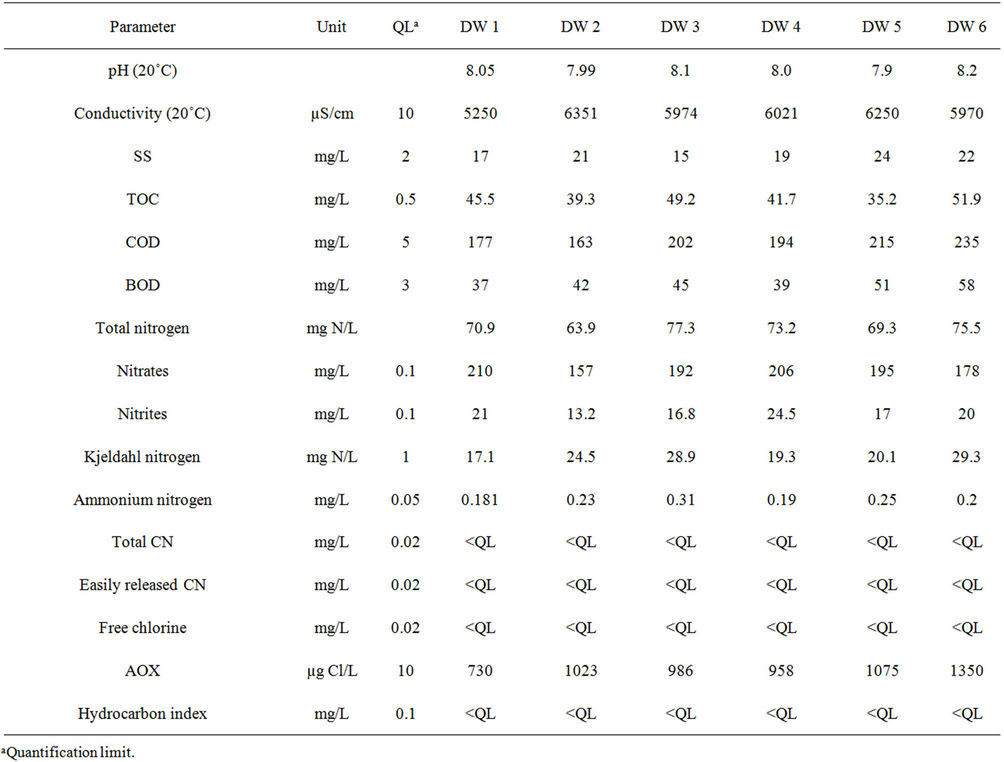
Table 2. Parameters for the six samples of industrial discharge water (DW).
chlorobiphenyls were below the limit of quantification.
4. Discussion
The analytical characterisation of the six samples of discharge water showed that the physico-chemical treatment used by the company to decontaminate its wastewater did not enable total abatement of all the pollution. The samples were found to still contain mineral pollution (high conductivity and salinity), an organic load presenting high values of COD and TOC, and a mixture of metals and organics that was not negligible. However, the legal requirements were satisfied. It can also be noted that the pollutant load varied over time both quantitatively and qualitatively.
The 6-month sampling campaign identified and quantified a total of 46 chemicals (Table 5) that can be grouped into a series of 25 inorganics including 8 metals (Co, Cr, Cu, Fe, Ni, Pb, Sn, Zn) and 21 organic pollutants (4 PAHs, 10 VOCs, 4 CPs and 3 APs). Of the 46 substances, 18 were systematically at quantifiable levels (Cr, Fe, Ni, Zn, Mn Mo, Se, Li, P, Si, Na, K, Mg, CaSO4, Cl, F and chloroform). Note that the concentrations found ranged from a few g/L for minerals to a few µg/L (traces) for organics with intermediate levels of mg/L for metals. However, if these same values are expressed as quantities discharged rather than concentrations, some quite high values are reached, especially for minerals. For instance, for the three main issues that the company has to face (COD, Zn and Ni), the mean concentrations in the six discharge waters were 198 ± 26 mg/L for the COD (38 kg/day), 0.87 ± 0.1 mg/L for zinc (i.e. 168 g/day) and 0.41 ± 0.11 mg/L for nickel (78 g/day). Also, the values varied over time (RSDs of 13, 11 and 27% for COD, Zn and Ni, respectively). Moreover, this variability over the whole 6 months of the study is also found over shorter periods, as seen in Figure 1 which reports the levels of COD, Zn and Ni over 54 hours of monitoring with RSDs of 14, 11 and 19% respectively. This observation is confirmed by the results in Figure 2 which describes the variations in the concentrations of the parameter AOX (RSD = 69%) and the substance chloroform (RSD = 85%) over 45 days (9 samples). This illus-
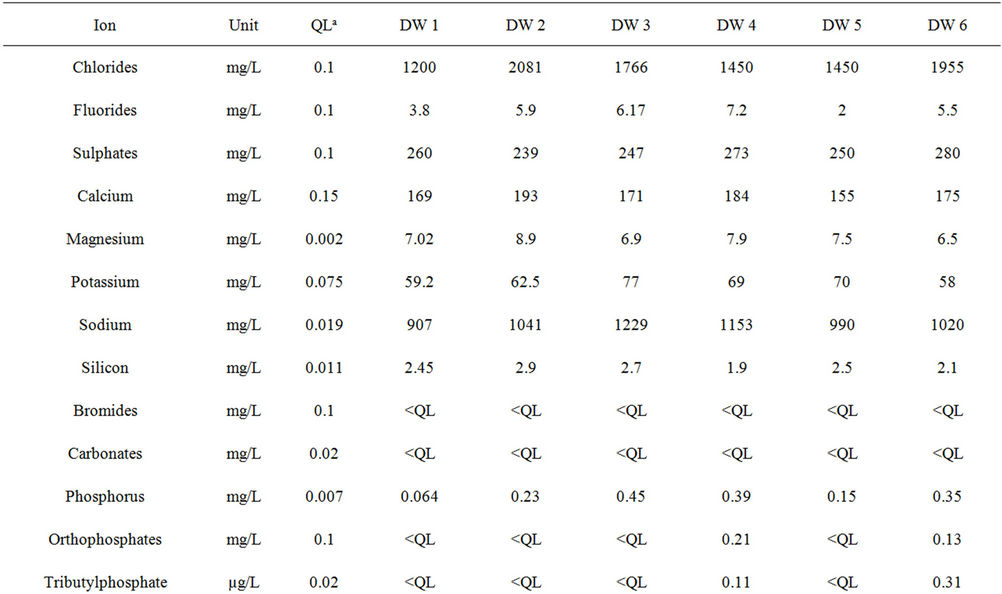
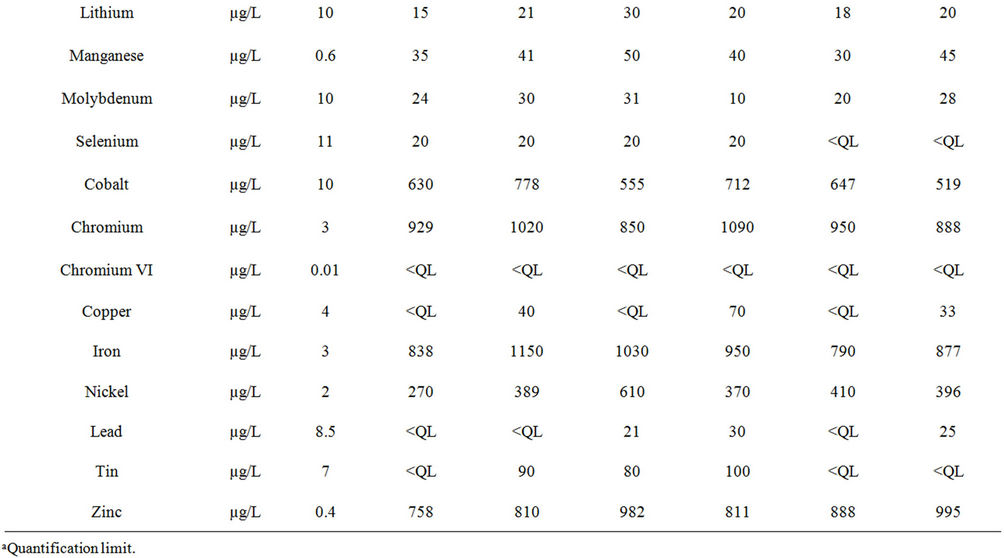
Table 3. Concentrations of the inorganic substances present in the six samples of industrial discharge water.
trates how the RSDs over a period of 6 months are similar or even lower (RSDs of 20% and 94% for AOX ··· and than those over a shorter time. So from the overall results, it can be noted that the variability over 6 months is simply the result of variability over a much shorter time scale. The daily and monthly fluctuations noted are not easily controllable as they depend not only on the variety of industrial processes carried out (different parts to be treated, multiple treatments, etc.) but also on dysfunctions liable to occur in the waste water treatment
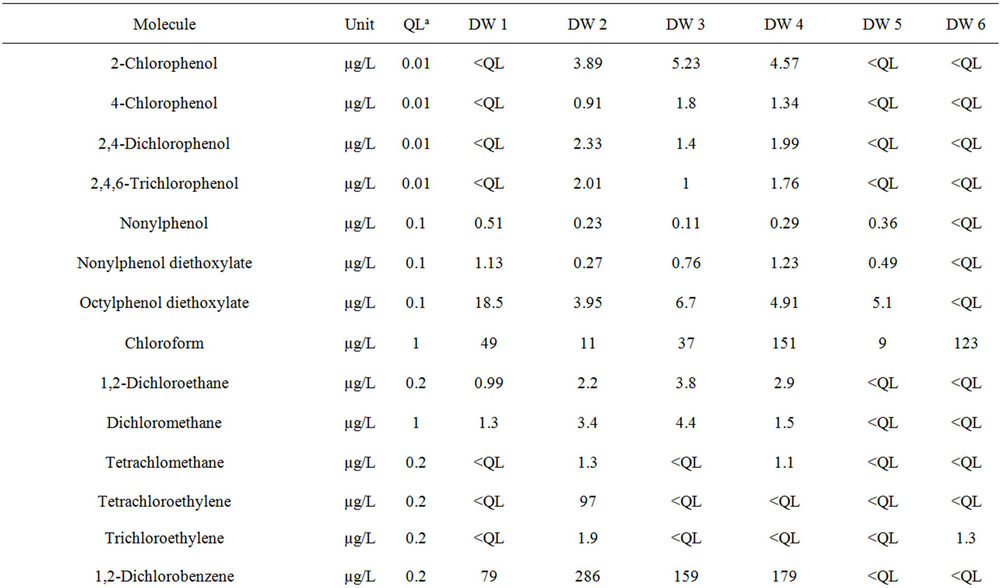
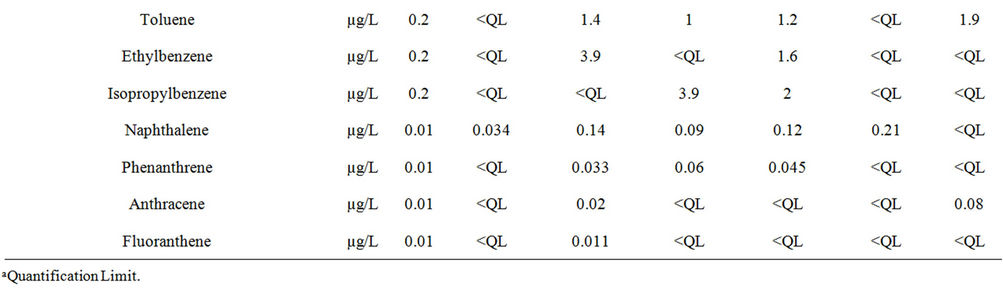
Table 4. Concentrations of organic substances in the six samples of discharge water.

Table 5. Recap of the total number of substances identified in the whole set of 6 discharge water samples and the total number of substances per sample.
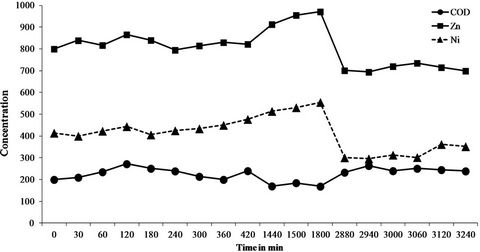
Figure 1. Variation of the levels of COD, Zn and Ni in mg/L over 54 hours of analytical monitoring.
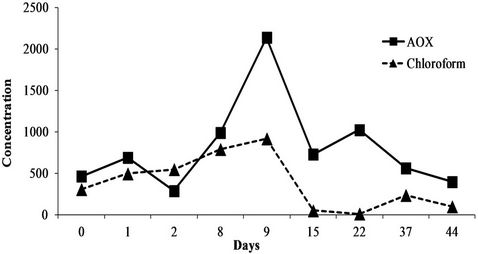
Figure 2. Variation of concentrations of AOX and chloroform in µg/L over 45 days.
plant. The high variability of the levels of pollution arriving in the treatment plant is not taken into account in the continuous decontamination of the wastewater, which could explain the variations that were noted in the samples taken at the outlet of the plant.
The number of substances found in the discharge water was also highly variable. The minimum was 24 substances found in DW 5 while this value was doubled in DW 2 and DW 4 (Table 5). Finally, we can consider that our figure of 46 chemicals present, is an underestimation since some substances (Al, Ba, B, Sr, Ti, V, CAs, PAHs, organo-tin) were identified but not quantified. Moreover, other organic substances (chloronitrobenzenes, chloronitrotoluenes, chlorotoluidines, etc.) were not assayed for financial or analytical reasons (techniques not available or not sufficiently sensitive), although it is known that they could potentially be present in the discharge water owing to the use of numerous complex cleaning agents in the industrial processes, their exact composition often being difficult to ascertain.
5. Conclusion
This study has shown that although the effluent produced by the surface treatment company studied here respects the authorized discharge levels, it does contain a whole cocktail of chemicals. They lead to relatively strong polycontamination with metals, minerals and organic compounds. The polycontamination is variable in time both qualitatively and quantitatively. In all, 46 substances were identified and quantified including 8 metals and 21 organics. Of the 46, 18 were systematically found including zinc and nickel, two substances that the industry has problems eliminating. It was also shown that the variations in the levels and parameters studied over the 6 months of the investigation were similar to those noted over much shorter periods of time. The variations were attributed to the differences in activities carried out by the company over time. Decontamination of the effluent was a continuous process and it was unable to systematically handle all the fluctuations in the pollutant levels at the plant’s inlet. For the follow-up of this study, it would be interesting to identify the origin of the substances, especially organics, by means of analytical monitoring of the effluent at the inlet to the treatment plant and also how the levels of the pollutants change as the waste water flows through the plant.
6. Acknowledgements
The authors thank the Agence de l’Eau Rhône-Méditerranée & Corse for financial support (NIRHOFEX 2013- 2016 Program: “Extraction, Quantification, Removal and Risk Evaluation of Emerging Compounds in Water Discharge from Treatment Surface Industries”). The authors also thank Alexandre Cordonnier and Philippe Antoine (Galvanoplast Industrie, Les Aynans, France) and Peter Winterton (Université de Toulouse, Toulouse, France) for helpful discussions.
REFERENCES
- M. Fuerhacker, “The Water Framework Directive—Can We Reach the Target?” Water Science and Technology, Vol. 57, No. 1, 2008, pp. 9-17. doi:10.2166/wst.2008.797
- M. Fuerhacker, “EU Water Framework Directive and Stockholm Convention Can We Reach the Targets for Priority Substances and Persistent Organic Pollutants?” Environmental Science and Pollution Research, Vol. 16, No. 1, 2009, pp. 92-97. doi:10.1007/s11356-009-0126-4
- M. Ostoich, A. Critto, A. Marcomini, E. Aimo, M. Gerotto and L. Menegus, “Implementation of Directive 2000/60/EC: Risk-Based Monitoring for the Control of Dangerous and Priority Substances,” Chemistry and Ecology, Vol. 25, No. 4, 2009, pp. 257-275. doi:10.1080/02757540903103857
- S. Zgheib, R. Moilleron and G. Chebbo, “What Priority Pollutants Occur in Stormwater and Wastewater,” Water Pollution, Vol. 135, No. 1, 2010, pp. 3-13.
- A. G. Chmielewski, T. S. Urbanski and W. Migdal, “Separation Technologies for Metals Recovery from Industrial Wastes,” Hydrometallurgy, Vol. 45, No. 3, 1997, pp. 333- 344. doi:10.1016/S0304-386X(96)00090-4
- J. F. Blais, S. Dufresne and G. Mercier, “Etat du Développement Technologique en Matière d’Enlèvement des Métaux des Effluents Industriels (in French),” Revue des Sciences de l’Eau, Vol. 12, No. 4, 1999, pp. 687-711. doi:10.7202/705373ar
- J. Fresner, H. Schnitzer, G. Gwehenberger, M. Planasch, C. Brunner, K. Taferner and J. Mair, “Pratical Experiences with the Implementation of the Concept of Zero Emissions in the Surface Treatment Industry in Austria,” Journal of Cleaner Production, Vol. 15, No. 13-14, 2007, pp. 1228-1239. doi:10.1016/j.jclepro.2006.07.024
- M. A. Barakat, “New Trends in Removing Heavy Metals from Industrial Wastewater,” Arabian Journal of Chemistry, Vol. 4, No. 4, 2011, pp. 361-377. doi:10.1016/j.arabjc.2010.07.019
- F. Fu and Q. J. Wang, “Review of Heavy Metal Ions from Wastewaters: A Review,” Journal of Environmental Management, Vol. 92, No. 3, 2011, pp. 407-418. doi:10.1016/j.jenvman.2010.11.011
- B. Sancey, N. Morin-Crini, L. F. Lucas, F. Degiorgi, J. F. Minary, P. M. Badot and G. Crini, “La Bioadsorption sur Amidon Réticulé pour Enlever des Métaux des Effluents Industriels (in French), ” Revue des Sciences de l’Eau. Vol. 23, No. 3, 2010, pp. 275-287. doi:10.7202/044689ar
- B. Sancey, J. Charles, G. Trunfio, P. M. Badot, M. Jacquot, X. Hutinet, S. Gavoille and G. Crini, “Effect of Additional Sorption Treatment by Cross-Linked Starch of Wastewater from a Surface Finishing Plant,” Industrial & Engineering Chemistry Research, Vol. 50, No. 3, 2011, pp. 1749-1756. doi:10.1021/ie1010492
NOTES
*Corresponding author.