Journal of Environmental Protection
Vol.4 No.4(2013), Article ID:30696,8 pages DOI:10.4236/jep.2013.44042
On the Patterns of the Occurrence of Diarrheas in the Southern Benin
![]()
1Department of Geography and Regional Development, Benin Scientific and Technical Research Center (CBRST), Cotonou, Benin; 2Faculty of Agronomic Sciences, University of Abomey-Calavi, Cotonou, Benin.
Email: *azonheth@yahoo.fr
Copyright © 2013 Hervé Thierry Azonhè et al. This is an open access article distributed under the Creative Commons Attribution License, which permits unrestricted use, distribution, and reproduction in any medium, provided the original work is properly cited.
Received November 6th, 2012; revised February 8th, 2013; accepted March 11th, 2013
Keywords: Diarrheas; Insanitation; Environment; Health; Benin
ABSTRACT
The present study focused on the analysis of the risk factors of diarrhea in Southern Benin. Data have been collected from 442 peasant households on the basis of a stratified random sampling method in the targeted communities, with information on the source of water provision, the location of the village, the usual defecation place, the site of refusing dumping and the presence of trash dump in the vicinity of the household. Data have been analyzed using descriptive statistics. In addition, analyses of variance and log-linear analyses have been applied to test the various factors in the outbreak of diarrheas. Results have allowed a hierarchical organization of the drinking water sources with regards to their use and to the cases of diarrheas (boreholes: p < 0.001; rainwater and territorial water: p < 0.001; wells: p = 0.547 and pipe-borne water: p = 0.277. If we rule out people’s insanitary behaviors, the impact of some risk factors such as the sites of waste disposal (2%) and excreta disposal (1%) is of little influence in comparison to the water supply source and the place of residence, which play respectively for 62% and 30% in the outbreak of episodes of diarrheas in households. It follows that, to curb the diarrhea morbidity, there is the need to improve the water supply policy and the environmental sanitation.
1. Introduction
Diarrheic diseases are permanent health concerns in West African countries in general and in Benin in particular. Figures show that these diseases rank third as the most killing infectious diseases in the world with some 2.5 millions of death in 2004, irrespective of age [1]. In terms of Disability-Adjusted Life Year (DALY), diarrheas rank first in 2007. A Sub-Saharan African individual is likely to suffer from diarrhea in a range of 39.1% against 7.2% for an individual in developed countries [1]. In Benin and for diarrheic diseases alone, the number of DALY per inhabitant and per year which is imputable to environmental factors (water, sanitation and hygiene) is of 34 years for 1000 inhabitants in 2007 against 0.2 for lowest rate in the world [1]. Thus, environment is the major factor of diarrheic diseases which, in turn, are the major consequence of inadequate or polluted environment. An epidemic-breeding area is known as “an area which hosts pathogen germs, which causes in the body some pathological processes that contribute to the breakout and spread out of morbid phenomena within a given community” [2]. Likewise, the interactions between the ecological conditions and the spread-out of contagious diseases are estimated through the factors of insalubrity such as the lack or the bad quality of water supply, a poor sanitation, an inadequate draining of solid wastes etc. [3]. Thus, factors like access to water and environmental sanitation play a key role in the breakout of diarrheic diseases. In many studies, the various ways people get drinking water have been identified as major risk factors of diarrheas [4-8]. This diversity and alternation in water supply sources causes drinking water to bear multitude of physical, chemical and biological agents that make a number of water sources unhealthy [9]. As to insalubrity itself, the main concern bears on sanitation with the presence of pathogen germs on refuse heaps [10]. A lot of pathogen germs survive in the environment via excreta, solid and liquid wastes from households and the community as a whole [11]. It is believed that wastes from households and waste water are vectors of almost the types of pathogen germs (bacteria, viruses and parasites) that are dejected by sick people and carriers of endemic enteritis diseases [3,12]. Those solid and liquid wastes can be considered as the most serious potential source of great variety of pathogen agents. It is also admitted that almost all the pathogen agents that are present in excreta can survive enough in water, waste and soil to put people’s health in danger [10]. Thus, the infections agents of diarrhea are spread out by feca-oral route notably through ingestion of contaminated water or food by stools or by direct contact with some infected stools. The farmers living in the depression of the TCHI are not exempt from this situation. The epidemiologic features in this area, following the situation in the humid areas in the southern part of the country, position diarrhea as the second or third of the most frequent affections [13]. The analysis of this epidemiologic feature makes believe at first that there is a standardization of the incidence of diarrhea within the population. This false view is being investigated in a humid area where the poor water supply and the unhealthy conditions help increase the centers of incubation for various pathogen microorganisms. The objective of the present study is to analyse the causes of the variation of the incidence of diarrheas in the depresssion of the TCHI community and to assess the most important factors of the incidence of diarrheas.
2. Material and Methods
2.1. Description of the Area of Investigation
The depression of the TCHI community is part of the western segment of the great central clayish depresssion that runs east and west of the sedimentary basin in the south of Benin and which is known as the Lama depression. Covering the Mono and Couffo regions, the depression of the TCHI is located between the plateau of ADJA in the north, that of COME in the south and the non-irrigated lauds of the AGAME in the west. It is comprised between latitude 6˚52' North, latitude 6˚37' south, 1˚58' longitude East, 1˚50' longitude west (Figure 1).
A river known as the Couffo runs through the depresssion. It is 190 km long with a tropical hydrology rate of flow (9.59 m3/s in August and 9.83 m3/s, when there are floods, 0.58 in May and 0. 92 m3/s in times of drought [14]. When there is rise in the river, the poorly flooded areas are used for market gardening and for the second season crops. The depression has a subequatorial climate type characterized by an annual succession of four seasons with some 950 mm to 1000 mm of rain per year [15]. The population of LALO Local Government has grown from 46,673 inhabitants in 1979 to 79,685 inhabitants in 2002 [16]. The density is 182 inhabitants/km2, with an estimated farmer population of about 70,180 individuals.
2.2. Sampling Methods and Collected Datas
Data have been collected on the basis of a semi-structured interview with selected households in the depresssion following a simple random sampling scheme. The total number, n, of targeted people for the survey has been determined using the normal approximation of the binominal distribution [17]:
 In (1), n = sample size; p = proportion of households in the surveyed district (p = 88.27%; INSAE, 2002);
 , = value of the normal random variable of probability value 1–α/2. With α = 0.05,
 ; d = margin of error of the estimation of any parameter to be calculated from the sample of size, n; for d = 3%, the number of households to be investigated have been estimated at 442. A proportional sample has thereafter been used to determine the number of households to be investtigated in a given community, Nr:
 ;
;
N = number of households in the community (N = 442); NT = total number of households in the investigation area; the number of surveyed households by community is shown in Table 1.
Data collected in every household were related to water provision sources, cases of diarrheas known in the household, trash and excreta management and the sanitation in the house.
2.3. Data Analysis
The effect of the type of population on the choice of a priority source of water provision by a given population has been assessed by applying a two factors log-linear analysis [18]. Besides, to assess the effect of the type of population and of the area on the prevalence of diarrhea, an analysis of variance with two fixed actors has been conducted out. In such a model, the two factors considered are the type of population and the source of water provision. Where the interaction between the two factors is significant, the adjusted means of the levels of each of the factor have been estimated with regard to the other factor and have been accordingly tested. Moreover, in order to measure the distribution of diarrheas considering the space (the communities where the study has been carried out), a hierarchical model of an analysis of variance has been used. In this model, the main factor is the area (plateau and the depression) and the nested factor to the area is the community.
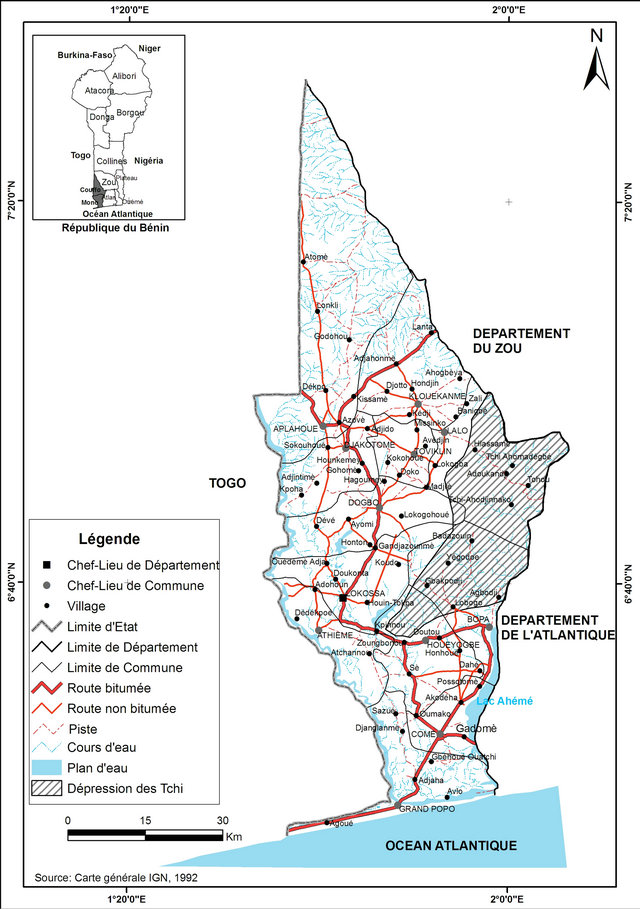
Figure 1. Site map of the depression of the TCHI.
Finally, in order to measure the weight of some significant factors of the occurrence of diarrheas, an analysis of variance has been applied to the data related to the effect of each of these factors of the incidence of diarrheas (water provision source, location of the village, the place where children defecate, the refuse dumping site, the usual defecation place, the presence of trash dump in the house yard). The F statistical values of FisherSnedecor have been considered for each factor. In fact, those values show the importance of the number of cases of diarrhea and have been used to draw graphics that illustrate the weight of each factor in the occurrence of diarrhea.
3. Results
3.1. About the Water Provision
The sources of water supply the most used in the area are wells, boreholes, and rainwater (Table 2). From Table 1, we deduce that all these four types of water provision sources are of use in the area with a high reliance on water from boreholes. So the priority source is the borehole (1093 households) whereas waterborne are the least used (56). Nevertheless, the extent at which every source
Table 1. Surveyed communities and details of the sample.
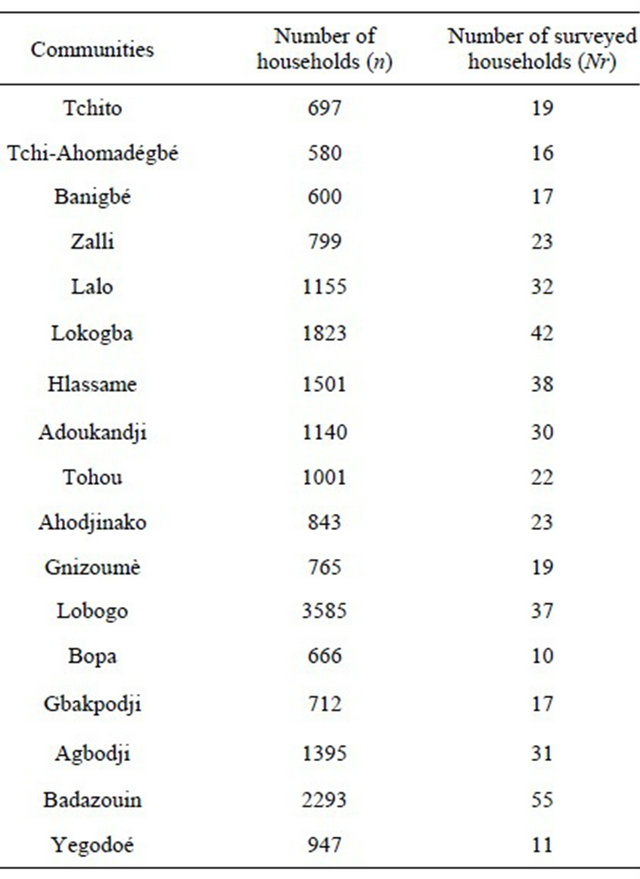
Source: INSAE, 2002.
Table 2. Distribution of water sources supply in every household, irrespective of social class.

is used varies from one population to the other (Table 3).
Results of log-linear analysis applied to Table 2 reveal some significant difference between the sources (p < 0.001), which, despite the alternation of sources in relation to seasons, is an evidence of their hierarchical structure. A major difference (p < 0.001) can also be observed when one considers the types of populations, which shows that they do not share the same habit in the provision of water. The significant interaction between the type of population and the water provision sources indicate that the distribution of households based on the four sources is determined by the group to which a population belongs. It follows that households do not choose the types of water sources at random. Whether they live on
Table 3. Distribution of number of cases of diarrheas according to the type of population and water provision source.
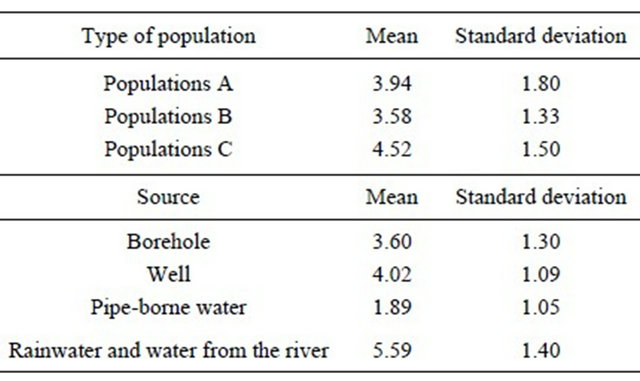
Population A: households living and working in the wetland; Population B: households living on the tableland but working in the wetland; Population C: households that living and working on the tableland plateau.
the plateau or in the depression, or that they go and work on the plateau or in the depression, the priority sources are not the same. It is then established that, whatever the type of population, sources differ. The significant interaction reveals that the types of populations do not use the same sources. However, it is mainly the wells, pipeborne water and the other sources (rainwater and water from Couffo River) that help discriminate the most the populations because boreholes are widely used by them.
3.2. About the Environmental Sanitation
As for the disposal of domestic waste in the nature, it concerns 55.2% of the households and is generally made not far from the compounds. Only 25.8% of the households dispose their waste at more than 100 m away from the houses. As to the draining of excreta, it is done in two ways: discharge in the environment (74.2%) and the use of common pits that are present in some compounds (25.8%). In addition, animal dejections were noticeable in the compounds of 50.9% of the households.
3.3. Impact of the Risk Factors on Health
3.3.1. Access to Water and Diarrheic Episodes
The mean score of cases of diarrhea by type of population and by source is shown in Table 3.
The distribution of the average cases of diarrheas per type of population shows that populations C are the ones that experience the most cases of diarrheas (4.82). Then follow populations A and B with 3.94 and 3.58 respectively. The distribution of cases of diarrheas per type of sources indicates that rainwater and river water are responsible for most cases of diarrheas (5.59) followed by water from the wells with a mean score of 4.02 cases. Water that originates from the pipe is responsible for only 1.89 cases of diarrhea on average. Results show that the hierarchical organization of the sources and the distribution mentioned above has an impact on the number of cases of diarrheas in the households (Table 3). Thus, there is a close relationship between sources of water and cases of diarrheas. The comparison between the types of population and the sources taking into account the cases of diarrheas is shown on Table 4.
Results of log-linear analysis show a difference between the types of populations (p < 0.001) and the sources (p < 0.001) with regards to the cases of diarrheas. Thus, the types of populations do not suffer from diarrheas the same way and do not experience the same number of cases. The interaction between the type of population and the source of water supply being significant (p < 0.001), the populations have been assessed in relation to themselves for each source of supply and the sources of supply have been compared for each type of population with the option “sliced” of SAS Software. Results are presented in Table 5.
Table 5 shows that for each of the populations A, B and C there is a very significant difference in the sources of provision with regards to the number of cases of diarrheas. Likewise results of Table 6 indicate a significant difference in the vulnerability of populations to diarrhea as far as boreholes, Rainwater and river water are concerned. For the other sources, however, there is no difference between the types of populations.
3.3.2. Refuse Management and Episodes of Diarrheas
With regards to the dumping site, we notice that the average number of cases of diarrhea is 3.85 with the populations which dispose their waste close to the house and 4.34 for the households which take their refuse as far away as a 100 m from their compound, that is, at a fixed point in the radius. That average goes up to 3.16 for those who dispose their waste at a more than 100 m away from the house and to 4.41 for the households which pile up refuse to make small heaps at home before taking them away (Figure 2).
There is a significant relationship (p < 0.001) in the distance between the house and the disposal site and the number of cases of diarrheas taking into account the area (wetland and tableland). Thus, the more distant the site
Table 4. Comparison of the types of population and the sources with regards to the number of cases of diarrheas: results of log-linear analysis.
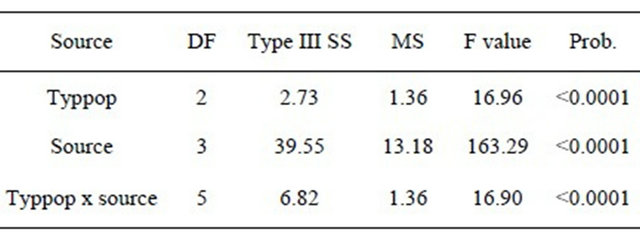
Typpop: type of population; Source: water supply source; Prob.: probability value at α = 0.05.
Table 5. Decomposition of the interaction between types of population and the source of water provision.

Population A: households living and working in the wetland; Population B: households living on the tableland but working in the wetland; Population C: households that living and working on the tableland plateau.
Table 6. Comparison of diarrhea cases taking into account some diarrhea risk factors: results of ANOVA.
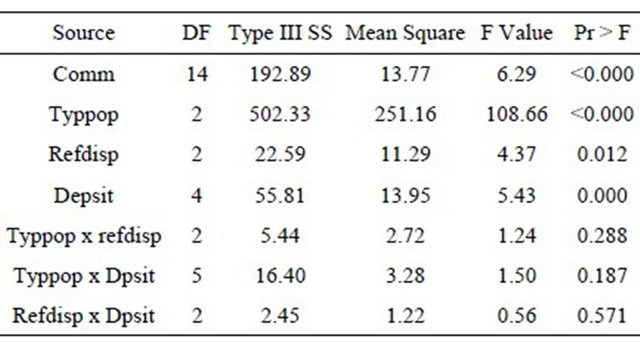
Comm.: community; refdisp: refuse disposal mode; dpsit: dumping site; Typpop: type of population.
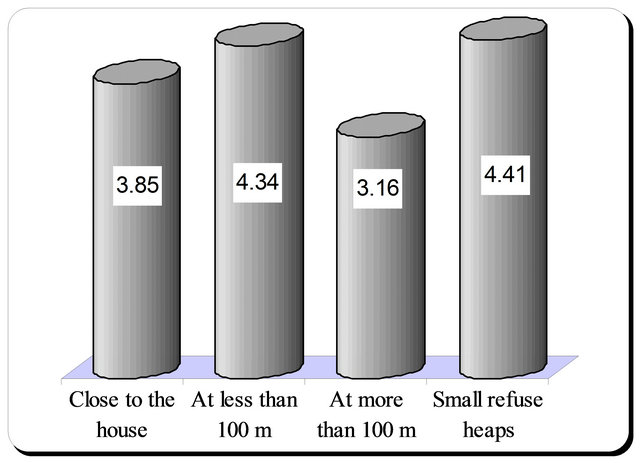
Figure 2. Distribution of cases of diarrheas on the basis of the evacuation mode.
of disposal from the house, the less frequent episodes of diarrheas in the household. With regard to cases of diarrhea, neither the savage defecation nor the use of septic pits is responsible for the same number of cases of diarrheas (p < 0.001). The average number of cases of diarrheas considering the usual defecation place is 4.16 for the population who are used to defecating carelessly and 4.05 for those who make use of septic pits. However, data show that the highest number of cases of diarrheas (4.25) is registered in households where children are used to defecating close to the house. Then follow the households where children defecate behind the house (54.11) and those which have a disposal not far from the house (4.10). Obviously these results are barely significant when compared to one another except with the users of septic pits who display an average number of less high cases.
3.3.3. Housing and other Risk Factors in Cases of Diarrheas
The distribution of cases of diarrheas with regards to factors like space and the management modes of wastes is shown in Table 6.
This table shows a significant difference (p < 0.001) between communities as to the number of cases of diarrheas, which means that the distribution of cases is made in accordance to two areas (plateau and depression) with different numbers of cases of diarrheas. As for the refuse disposal site and the management mode, there is a high significant difference. It follows that there is a differentiation in the cases of diarrheas with regards to the set variables. The distribution of cases of diarrheas taking into account the inhabited area (plateau and depression) is shown in Figure 3.
The distribution of average cases, with regards to communities, shows that communities which are located in the wetland experience more cases than those living on the tableland. The villages with a high rate of cases of diarrheas happen to be in the wetland whereas those with a low rate are on the tableland. That distribution also corresponds to the water service standard in the local government where the studies have been carried out. Nevertheless, the ordinary defecation places account for the same number of cases of diarrheas (p < 0.364) whereas the comparison of the areas show that communities that are located in the wetland and those on the tableland experience average numbers of different cases of diarrheas.
3.3.4. Assessment of the Influence of Some Risk Factors
The comparative analysis of the influence of several risk factors shows that water and space have a great influence on the cases of diarrheas in the households, which means that there is a difference of influence of these factors in the incidence of diarrhea (Figure 4).
From this figure, the hierarchical organization of the F values of the ANOVA on risk factors shows that the supply source (F = 292.71) has the greatest influence (62%) compared to the other risk factors. Then follows the loca-
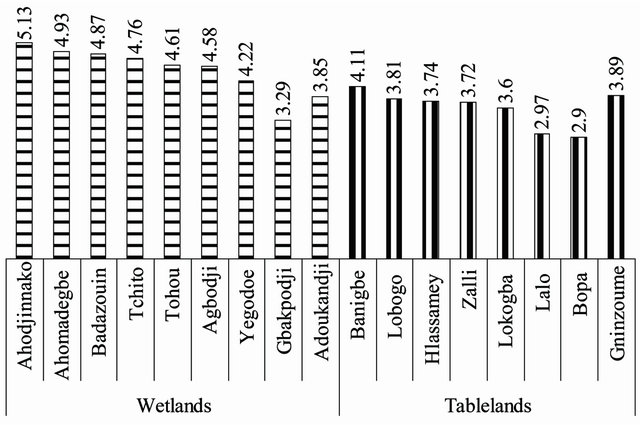
Figure 3. Spatial distribution of cases of diarrheas in the area of investigation.
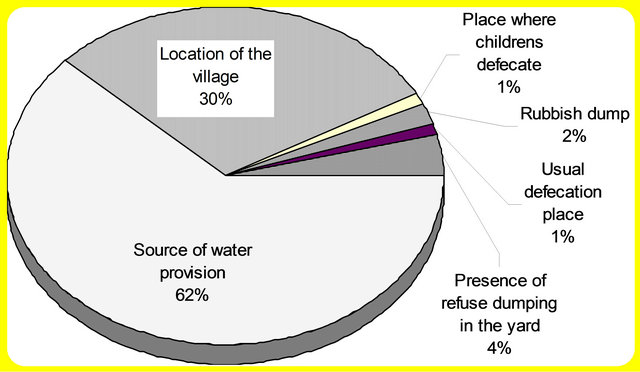
Figure 4. Degree of influence of some risk factors on the diarrheic morbidity in the area of investigation.
tion of the village (F = 139.9) with a degree of influence of 30%. The other factors of risk contribute for less than 8% in the morbidity related to insanitary. These are the refuse dumping site (F = 5.92), the usual defecation place (F = 1.03); the place where children defecate (F = 3.84) the present of small dumping for a first level collection of refuse in the courtyard (F = 20.32).
4. Discussion
4.1. Water Supplying and the Variation of the Incidence of Diarrheas.
The variation of the incidence of diarrheas with regards to two important risk factors that are water and space is real. Water is then a pathogen factor often cited with the incidence of diarrheas, as it is for many other diseases, in the sense that it constitutes an essential link in the epidemiology chain of many of them [19], especially in regions where there is a lack of it. An adequate supply of clean water helps prevent the spread of diarrheic diseases and promote family hygiene [20]. The hierarchical organization of sources is the consequence of the seasonal alternation of water supply sources within the households. During the dry season there is a great tendency at using water from boreholes and wells, whereas the rainy season makes it easier the use of other sources. Such an alternation is explained by the fact that water service in the area is rather poor and so does not help meet the need of households. The link between water and diarrheas then resides in the changing of sources of supply of drinking water as it is noticed within the communities. However, the diversity in the modes of drinking water supply has been identified as a significant risk factor of diarrhea [5-8,21]. Nevertheless, besides the contamination and the alternation of the sources in accordance with the season, the difference between the populations can be fully grasped when one follows the remark made by Augur [22]. He held that, generally speaking, man reacts well against the water pathogen agents that usually prevail in his environment. But he is prone to intoxication when he gets exposed to new stereotypes due to change of environment or of supply source. Then alternation also explains the link between the sources of water supply and the cases of diarrheas. In other words, the more satisfying the access to water is, the more limited the contamination, with a significant curb in diarrheic morbidity [10]. However, caution should prevail not to exaggerate the interpretation of the choice of a source which is much more dictated by the restriction of the supply rather than by any real preference among available sources, knowing that the move is generally towards immediate sources. It is nonetheless noticed that at equal distance, households often prefer boreholes sources. Anyway the supply source is considered an indicator of people’s behaviors as regards hygiene, health or environmental sanitation [10].
4.2. Space Effect and Spatial Variation of the Incidence of Diarrheas
Variations linked to the environment modulate the expression of diseases according to places and times [23], which explains why the variation of the incidence of diarrheas at the space level is significant [10]. However, this modulation is expressed in terms of how much insanitary the environment is. So, the contribution from space cannot be fully grasped without the conjunction of other risk factors like the management of waste. At this level, the people’s perception of space as a “no man’s land” on which refuse can be dumped is a parameter to be taken into account. The destruction of the vegetation, which is noticed on the plateau as well as in the depresssion, contributes to the flow out of rainwater, which eventually carries away the waste to the zone of depresssion. The leaching of the land which results from it displays a wide variety of physical, chemical and biological phenomena for which anaerobic processes overlap to pollute ground water. In the meantime, it is admitted on the one hand that diarrhea spreads out more rapidly in area where hygienic conditions are poor or disastrous. [8,12,24-26] and, on the other, [27] observes that of the determining risk factors so far known in the diarrhea contamination of children under five, the modes of excreta evacuation are of high importance. If we posit it that, for a transmissible disease to become endemic in an area when we rule out the sources of contamination, there is the need for the causal agents to find some propagation ways [12] and for the survival of the pathogen germs in the external environment to be so long as the environmental conditions could allow it [6], we could agree with [7] that ingestion of fecal pathogen germs via drinking water could result in diarrheic diseases. Nevertheless, in some other studies on the origin of the contaminations of water, there are nuances to these results. Indeed, [28] states that “low population densities (2 to 20 inhabitants/km²) and the dispersion of excrement to the soil surface, rather than their incorporation into concentrated flows through the sewers” are involved in weak contamination of groundwater. The low population density in rural area in comparison with the urban area is an unfavorable factor to the mass-production of waste. But the geomorphology of some spaces like the zones of depression leads to a mass contamination. Meanwhile, it is inadequate to perceive the spread out of excreta as a limiting factor to groundwater contamination, since the use of the environment as excreta draining site and the disposal of waste in the vegetations that border the villages contribute to drinking water contamination, through rainwater streaming or infiltration, and, even in some cases, through passive contamination by wandering house animals.
The diversity of the ways people get drinking water, the alternation of the supply sources according to the seasons, the poor access to drinking water and the insanitary conditions are the significant risk factors of cases of diarrheas in rural areas. It follows that throughout the year diarrhea appears endemic with varying episodes according to space, water supply source and healthy behaviors. If the comparative study of the mean score for the different supply modes, the insanitary conditions and for the space has established the association of the incidence of diarrheas to these risk factors, it is then a fact that the benefits of any improvement of these factors should have some impact on the reduction of the incidence of the disease. Hence, there is the need on the one hand to carry out further studies on the seasonal character of diarrheic morbidity in relation to environmental parameters, and to draw the implication of the studies for the economical capacity of households at participating in the sanitation process in order to make policies best adjust to local realities.
REFERENCES
- N. Thapar and I. R. Sanderson, “Diarrhoea in Children: An Interface between Developing and Developed Countries,” The Lancet, Vol. 363, No. 9409, 2004, pp. 641- 653.
- G. Remy, “Le Dialogue Entre les Maladies Transmissibles et le Milieu Géographique,” GEOS No. 4, Université Paul Valery de Montpellier, Béziers, 1988, 32 Pages.
- R. G. Feachem, S. N. Cousens, B. Kirkwood and T. E. Mertens, “Case Control Studies of Childhood Diarrhoea, 1-Minimizing Bias,” WHO, CDD/EDP/88.2, Geneva, 1988.
- P. Handschumacher, “Gestion de l’Eau et Santé des Jeunes Enfants à Niakhar (Sénégal). Une Approche Géographique en Milieu Rural Soudano-Sahelien,” Thèse de Doctorat de Géographie, Université Louis Pasteur de Strasbourg, Strasbourg, 1987, 326 Pages.
- H. Boukir et B. Brun, “Facteurs Environ Nementaux et Sociaux de la Répartition des Maladies Hydriques Dans la Médina de Fès (Maroc). In Villes du Sud et Environnement,” Travaux de la IXème Journées Scientifiques de la Société d’Ecologie Humaine Tenues à Chioggia, 29 au 31 Mai 1997, pp. 54-63.
- B. S. Schwartz, J. B. Harris, A. I. Khan, et al., “Diarrhoeal Epidemics in Dhaka, Bangladesh, during Three Consecutive Floods: 1988, 1998 and 2004,” Journal of Tropical Medicine & Hygiene, Vol. 74, No. 6, 2006, pp. 1067-1073.
- M. Baneto, C. A. Milroy, A. Strina, M. S. Prado, J. P. Leite, E. Ramos, H. Ribeiro, N. M. Alcântara-Neves, M. G. Teixeira and L. C. Rodrigues, “Community-Based Monitoring of Diarrhea in Urban Brazilian Children: Incidence and Associated Pathogens,” Transactions of the Royal Society of Tropical Medicine and Hygiene, Vol. 100, No. 3, 2006, pp. 234-242. doi:10.1016/j.trstmh.2005.03.010
- V. A. Curtis and S. Cairncross, “Effect of Washing Hands with Soap on Diarrhoea Risk in the Community: A Systematic Review,” London School of Hygiene and Tropical Medecine, London, 2003.
- F. Charlet, “Les Sources de Contamination Biologique au Cours du Transport et du Stockage de l’Eau,” Colloque Pluridisciplinaire Géographie-Médecine sur l’Eau et la Santé en Afrique Tropicale, Limoges, 1991, pp. 37-44.
- I. Sy, “La Gestion de la Salubrité à Rufisque (Sénégal); Enjeux Sanitaires et Pratiques Urbaines,” Thèse, d’Etat de l’Université Louis Pasteur-Strasbourg, Strasbourg, 2006, 528 Pages.
- P. Hartemann, “Approvisionnement en Eau et Assainissement en Milieu Tropical,” Médecine Tropicale, Vol. 61, No. 3, 2001, pp. 210-213.
- WHO, “Improving Water and Sanitation Hygiene Behaviours for the Reduction of Diarrhoeal Disease,” The Report of an Informal Consultation, CWS/CDD/WHO, Genève, 1993, 24 Pages.
- MS, “Statistiques Sanitaires,” SSRDO/MSP, Cotonou, 1997, 2007, 110 Pages.
- MMEE, “Base de Données Informatisées sur l’Hydraulique au Bénin,” Base de Données Informatique Consultable au MMEE, 2008.
- ASECNA, “Tableau de Synthèse des Données Météorologiques,” Zone Sud-Ouest du Bénin, Report, ASECNA 58-71, 2004.
- INSAE, “Troisième Recensement généRal de la Population et de l’Habitat,” Volume 1, Insitute National de la Statistique et de l’Analyse Econocique, Cotonou, 2002, 251 Pages.
- P. Dagnelie, “Théories et Modèles Statistiques,” Applications Agricoles, Tome 2, 21ème Édition, 1998, 464 Pages.
- A. Agresti, “Categorical Data Analysis,” John Wiley & Sons, New York, 2010.
- M. Mortimore, “Adapting to Drought. Farmers, Famines & Désertification in West Africa,” Cambridge University Press, Cambridge, 1989, 299 Pages. doi:10.1017/CBO9780511720772
- J. K. Tumwine, J. Thompson, M. Katua-Katua, M. Mujwajuzi, N. Porras and L. Johnstone, “Diarrhoea and Effects of Different Water Sources, Sanitation and Hygiene Behaviour in East Africa,” Tropical Medicine and International Health, Vol. 7, No. 9, 2002, pp. 750-756. doi:10.1046/j.1365-3156.2002.00927.x
- P. Handschumacher, D. Laffly et J.-P. Hervouet, “De l’Ecologie des Maladies à la Mise en Evidence d’Indicateurs de Risque Sanitaire. Pour une Géographie Appliquée à la Santé Publique en Afrique Subsaharienne,” Historiens et Géographes, No. 382, 2002, pp. 129-137.
- L. Augur et P. Hatermann, “Introduction à la Medécine de l’Environnement,” Frison-Roche, Paris, 1993, 367 Pages.
- W. P. Butz, J. P. Habicht and Davanzo, “Environmental Factors in the Relationship between Breastfeeding and Infant Mortality: The Role of Sanitation and Water in Malaysia,” American Journal of Epidemiology, Vol. 119, No. 4, 1984, pp. 516-525.
- R. Feachem, M. Rahaman, G. Briscoe, G. Bradley, H. Garelick and D. Mara, “Sanitation and Disease: Health Aspects of Excreta and Wastewater Management,” John Wiley & Sons, Chichester, 1983.
- M. Daigl, “Evaluation des Facteurs de Risque Pour le Paludisme et la Diarrhée Dans les Quartiers Yaoséhi, Niangon Sud Sicogi et le village d’Azito—Commune de Yopougon, Abidjan, Côte d’Ivoire, Mémoire en Science, Schweiz,” Tropeninstitut, University Basel, Basel, 2002, 108 Pages.
- S. Gagneux, C. Schneider, P. O. Matt, G. Cissé, M. L. O. Selmane, D. O. Cheikh, A. Touré and M. Tanner, “La Diarrhée Chez les Agriculteurs Urbains de Nouakchott en Mauritanie,” Médicine Tropicale, Vol. 59, No. 3, 1999, pp. 253- 258.
- N. M. Mirza, L. E. Caulfield, R. E. Black and W. M. Macharia, “Risk Factors for Diarrhoeal Duration,” American Journal of Epidemiology, Vol. 146, No. 9, 1997, 776-785.
- R. Maire, S. Pomel et J. N. Salomon, “Enregistreurs et Indicateurs de l’Environnement en Zone Tropicale,” Presses Universitaires de Bordeaux, 1994, 492 Pages.
NOTES
*Corresponding author.