Journal of Environmental Protection
Vol. 3 No. 9A (2012) , Article ID: 22959 , 6 pages DOI:10.4236/jep.2012.329134
A Cost-Benefit Evaluation of the Air Quality and Health Impacts in São Paulo, Brazil
![]()
1Purchasing Department Lear Corporation, Caçapava, Brazil; 2Escola Politécnica, Universidade de São Paulo, São Paulo, Brazil; 3Faculdade de Medicina da Universidade de São Paulo, São Paulo, Brazil; 4Earth and Exact Sciences Departament, Universidade Federal de São Paulo—UNIFESP, Diadema, Brazil.
Email: simone.miraglia@unifesp.br
Received June 18th, 2012; revised July 20th, 2012; accepted August 12th, 2012
Keywords: Air Quality; Cost-Benefit; Health Impacts; Transportation; São Paulo; Brazil
ABSTRACT
The objective was to assess the impact on health due to the exposure to air pollution derived from the renewal of the urban bus fleet in São Paulo. The study analyzed the substitution of the bus fleet through the variation of the concentration of atmospheric pollutants such as PM10 in the municipality of São Paulo and its associated health’s benefits values compared to the investments performed in the bus fleet renewal. PM10 average annual reduction due to the bus improvement system resulted on 22.3%. A cost-benefit evaluation considered the renewal investments’ costs compared to the obtained valued health benefits and it resulted in 4.31. Although the result may suggest a not viable investment, it must be observed that air pollution reduction favors health impacts and that this relation could be improved if additional investments on sustainable transportation increase.
1. Introduction
São Paulo city, in Brazil, has 11 million inhabitants, with an area of 1509 km² divided in 96 districts, while São Paulo Metropolitan Region (SPMR) has 18.8 million inhabitants within 39 municipalities [1].
In order to attend to the needs of a region of that magnitude, a complex and huge transportation system is required. This system is composed mostly by diesel buses (fleet with 14,761 vehicles), an insufficient subway network coverage (61.3 km) and individual transportation (estimates indicate 6.5 million cars and 574.2 thousand motor bicycles). Urban trains comprehend the peripheral area in connection with other modal alternatives reaching a 122.7 km network in the metropolitan area. Adding to this, we must mention trucks for heavy transportation (134 thousand vehicles).
The vehicle fleet is characterized by different fuels such as gasoline, diesel, ethanol, natural gas and, in the subway and train system, electricity. These fuels generate different atmospheric pollutants which can distinctly affect the environment.
Public transportation is an essential service and directly influences the population’s life quality. Varied transportation policies are employed aiming to provide efficient and effective service, despite investments and alternative solutions restraints. However, frequent episodes of vehicular congestion occur in São Paulo, adding to meteorological conditions and topographic characteristics which lead to adverse air quality panorama. The transportation system is the main source of air pollution in São Paulo, being responsible directly and indirectly for 90% of inhaled particulate matter emissions—PM10. The pollutants are associated to the incidence of respiratory and cardiovascular diseases as well as neoplasia, impacting the health system in terms of hospital admissions, emergency room visits and increasing mortality [2-5].
These externalities have a monetary impact, generating economic losses due to extra time and fuel spent in traffic jams as well as expenses in terms of adverse health effects-diseases and mortality associated to air pollution concentration [3].
The federal legislation (Resolução CONAMA n˚ 3, de 28/06/1990) characterizes and establishes the maximum limits for atmospheric pollutants in order to maintain public health. However, several local studies have pointed to many health effects even when pollutants concentration are under the limits [6].
Respiratory diseases (pneumonia, bronchitis, asthma and obstructive pulmonary diseases), cardiovascular diseases (ischemic heart disease and cerebrovascular diseases) and neoplasia are associated to air pollution [3,4].
The age groups more susceptible to the effects of air pollution are the elderly (individuals aged 65 or more) and the children (aged 5 years or younger) due to the diminished capacity of the immunological system [7].
The mortality profile is an important health data indicator in order to represent the level of development and the degree of the quality of life of a population, as well as to subsidy the planning of preventive actions by public services [1].
The responsibility for implementing, monitoring and controlling the bus public system fall upon the municipality or the state depending on the magnitude of the enterprise. On the other hand, the companies which provide this service for the users regard it as a business therefore adjusting the offer to the market demands, not taking the direct influence upon the health of users and non-users into consideration. If bus fares are set higher than the real cost of the service, the passengers’ purchase power is taxed and, in the other hand, if they are set at a lower level the expected revenue of the contractors is reduced. In these calculations, the externalities generated by the transportation system are not considered, such as the damages to public health due to diesel buses’ pollutants emissions.
The contractor’s justification for not renewing the fleet is the direct impact on the bus fares and consequently in the users’ budget. The introduction of buses with modern technology in the city of São Paulo would reduce atmospheric emissions and consequently the associated adverse health effects. A law published by the municipality of São Paulo determines a bus renewal every 5 years in order to guarantee a level of service and prevent buses’ aging.
The best approach in order to evaluate the impact of a public investment and the potential social and environmental benefits is the utilization of the environmental cost-benefit analysis. Discussions concerning environmental justice are necessary so that to orientate the return of investments aiming to reduce inequalities [8].
The study evaluated the environmental and health benefits of the bus fleet renewal in the municipality of Sao Paulo in terms of air pollutants’ concentration and associated mortality indicators in the period of 1996 to 2006 compared to the costs of the buses incurred in the renewal process initiated in 2002.
2. Methods
We performed a descriptive temporal evolution analysis of pollutant concentrations, elderly mortality indicators and bus fleet from 1996 (baseline year) to 2006 and the consequent avoided health costs through environmental valuation approach compared to buses investments initiated in 2002 performing a cost-benefit analysis. For this analysis we estimated the air pollution apportion due to the buses’ fleet considering emission factors, trips’ modes and trips’ routes averages distances.
This time series analysis included the following parameters:
1) evolution of the pollutants concentration, taking particulate matter (PM10) as the reference pollutant due to the consistency on adverse effects on human health observed in epidemiological studies;
2) elderly mortality indicators due to respiratory and cardiovascular diseases;
3) estimates on health chronic effects of the exposure to pollutants;
4) bus fleet evolution and number of passengers transported;
5) investments performed in fleet renewal.
All estimates were conducted in a conservative approach.
Values on the costs of buses acquisition were obtained from the municipality of São Paulo. Data related to bus fares and the buses fleet on an annual basis was released by the company responsible for buses transportation management (SPTrans) [9], while pollutant concentration data on a daily basis were obtained from the Environmental State Company (CETESB) [10]. Finally, mortality data on a daily basis were collected from the program on mortality data information of the municipality of São Paulo (PROAIM) [11].
3. Results
The results showed the positive effects of the bus fleet renewal which resulted in the reduction of the annual average concentrations of PM10 from 60.69 mg/m3 in 1996 to 32.62 mg/m3 in 2006 (as it can be observed in Figure 1). This 50% reduction in the pollutant concentration is associated to a drop in the mortality panorama after a lag of 2 years (Figure 2) from the environmental improvement and the economic investment of US$1 billion in new cleaner technologies buses.
The annual quantity of transported passengers has registered an increase of about 100% from 2002 on whereas the number of operational bus lines in the period of the study has registered a small decrease, suggesting a more effective service of the bus company after the bus renewal program. In the other hand, the tariff evolution increased continuously in the studied period.
The value of the public transportation fare in the municipality of São Paulo is based in the cost per passenger factor. The calculation procedure for this estimation is based on fixed and variable costs that compound the total cost of transport which are registered in a specific sheet.
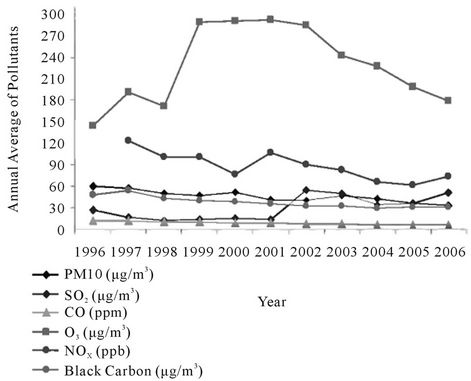
Figure 1. Pollutants’ concentration evolution (1996-2006).

Figure 2. Mortality evolution (1996-2006).
Fixed costs correspond to the parcels which present no variation with traveled distance, including: salaries, taxes and capital depreciation. Among the variable costs the elements proportional to the traveled distance such as fuel consumption, wastage, maintenance, tires and lubricants are included.
The fare is calculated dividing the total amount of fixed and variable costs—Total Cost (TC) by the Index of Passenger per kilometer (IPK) that is, the average of transported passengers by bus by traveled kilometer.
Thus, the cost of traveled kilometer (KC) is divided by the IPK. Costs also depend on the level of the service which is intended to be offered (GEIPOT) [12].
The fare evolution in Brazilian money (Real—R$) presented a significant increase as fares charged in 2006 (R$2.30) reached 3 times the value charged in 1996 (R$0.80), that is, an increase of 187.5%. The accumulated inflation in the period was 170.85% (ICV-DIEESE) [13]. This increase impacted on the users’ purchase power, which can be observed comparing the fares to the values of the minimum wage in the referred period—in 1996 it was possible to buy 344.5 passages with the minimum wage, while in 2006 it was possible to buy only 152.
The monitoring stations of the environmental state agency (CETESB) considered in this analysis for computing the annual average of each pollutant were selected under the criteria of the data record. In this sense, only stations of the automatic network were included and stations with discontinuous pollutants measures were disregarded.
Figure 1 shows the evolution of the pollutants concentration in São Paulo—particulate matter (PM10), sulphur dioxide (SO2), carbon monoxide (CO), ozone (O3), nitrogen dioxide (NOX) and black smoke—all presented a significant decline from 2002 on.
Analyzing specifically the PM10 as this pollutant is more representative in terms of promoting adverse health effects, we could observe a decrease in the annual average from 60.69 mg/m3 in 1996 to 32.62 mg/m3 in 2006. This 50 % reduction in the pollutant concentration consists in an indicator of the environmental benefit gained with the bus fleet renewal introduced in São Paulo in 2002 (as shown in Figure 1).
Figure 2 shows a trend in the respiratory and cardiovascular diseases mortality profile from 1996 to 2004. From this period on, however, it is observed a discreet inversion of this profile showing a decrease in the number of events until 2006. This fact may be indicative of a necessary response period for an alteration of an environmental quality aspect which in this study is suggestive of 2 years. This finding is consistent with studies from Schwartz [14] where long term associations were observed to exposure to PM2.5 with mortality indicators to several causes, including respiratory ones.
The total urban buses fleet in São Paulo was of 10,000 in 2002 and it diminished to 8500 in 2005 and finally enlarged to 14,000 in 2006.
The referred fleet renewal computed in this study started to occur in 2002. For the estimates of amount of renewed buses in 2006 it was considered the average age of the fleet inferior to 5 years [9]. This amount resulted in 73% of the fleet in 2006.
The average values spent by the type of urban bus technology utilized in São Paulo’s fleet varied from R$123,000 for a microbus to R$750,000 for a doublearticulated bus (source: SPTrans [9] base period November 2006). For calculation purposes in this study, our estimates were conservative assuming values for the renewal process as the conventional bus (basic type, R$173,509).
In this sense, the investment estimated in the bus fleet renewal in 2006 results:
Investment performed (R$) = Bus fleet × Fleet Renewal Index × Basic bus average cost (conventional);
Investment performed (R$) = 14,761 × 0.73 × R$173,509;
Investment performed (R$) = 1869651.43400.
Considering that this investment was performed through 5 years, we could estimate an average investment of US$200 million per year. Under the consideration of environmental and transportation management, investments in the fleet system must be performed in a continuously basis so that environmental improvements in terms of air pollution scenery can be reflected in health counts.
In order to estimate the parcel of the air pollution benefits attributable to the bus fleet renew, the so-called phenomena was modeled to the calculation presented below.
According to the Air Quality Report of the Environmental State Agency of the State of São Paulo (CETESB) [10], the sources of air pollution in São Paulo is characterized in terms of PM10 as shown in Table 1.
Among diesel vehicles, there are buses and trucks. As selection criteria to quantify the particulate matter emissions from buses considered, it was adopted an estimative of the average routes covered by the bus fleet in São Paulo. According to FIPE8 each bus runs approximately 9393 km/month performing 313.1 km/day. Considering the 14,000 buses fleet (SPTrans) the total amount of buses’ journey in São Paulo is 4,383,400 km/day [9].
In the other hand, the truck fleet registered is of 152,808 trucks and covers about 60 km/day, totalizing 9,168,480 km/day of trajectory.
As in Sao Paulo municipality, the truck fleet travelling an average of 3 days in a week and the bus fleet travelling 6 days in a week as an indicative of fleet flow’s journeys, we reach contributions displayed in Table 2.

Table 1. PM10 emissions per fuel engine and participation share.
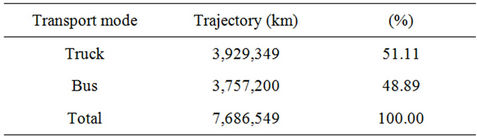
Table 2. Transport mode trajectories and participation share.
The participation of each mode in terms of proportionality in emissions is as demonstrated above. Taking into account the individual contribution of each type of vehicle to the particulate emissions scenario defined by CETESB’s measurements (Table 1), diesel vehicles corresponds to 70.71% of this sort of emissions. Considering the bus share in the transport mode of 48.89% (Table 2), the buses parcel corresponds to 35% of total particulate emissions.
However, pollutants’ emissions can not be directly converted in pollutants’ concentration because some factors can interfere like meteorological conditions, chemical reactions and topography. The ratio between pollutants’ emissions and pollutants’ concentrations varies from place to place. A study of the emission and concentration distribution of the vehicular pollutants in the urban areas based on the meteorological data and the emissions distribution in Beijing was modeled accurately for this specific region [12].
As, at least to the moment, there are no consistent empirical models to estimate pollutant emissions and its correspondent resulted concentration for Sao Paulo city in this scenario analysis, we estimated the parcel of PM10 reductions in the analyzed period attributable to the bus system improvement based on the proportionality of the trips performed by bus and individual vehicles from 1997 to 2007. According to the research on trips’ habits and mode (Metro) [15], the proportionality on transportation mode evolution between individual and bus is shown in Table 3.
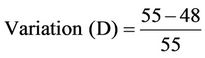
In order to determine the variation of the reductions in PM10 observed in the analyzed period attributable to the bus system improvement, we calculated based on Table 3 as follows:
Variation (D) = (bus share’ participation in transport mode in 2007-1997)/(bus share’ participation in transport mode in 2007);
 ;
;
Variation (D) = 12.7%.
Considering the result showed above on the buses parcel correspondent to total particulate emissions of 35%, discounting the variation of 12.7%, the final impact of the PM10 reduction due to the bus improvement system will result on 22.3%.
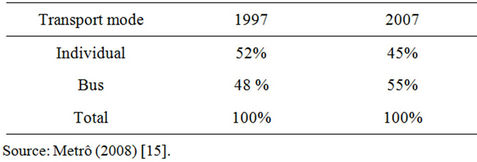
Table 3. Transportation mode share through 1997-2007.
In this stage, it is necessary to estimate the amount of benefit associated to this reduction in buses’ emissions, remarkably in terms of health indicators and related costs. Miraglia et al. (2005) performed a valuation of the adverse health effects due to air pollution concentration in São Paulo resulting in a burden of US$208 million per year due to respiratory and cardiovascular diseases mortality and morbidity through epidemiological approach and DALY methodology [16].
Taking into consideration the 22.3% share of PM10 concentration reduction due to the buses’ renewal fleet and considering its equivalency in the amount of burden estimated in health terms (total burden of US$208 million) is equivalent to US$46.4 million annually.
Annual health Benefit from Valuation Study (US$) = 208 million;
Expected avoided burden parcel due to buses’ renewal (US$) = 46.4 million;
Cost-Benefit Analysis (Buses’ renewal) = 200 million/ 46.4 million = 4.31.
4. Discussion
The cost-benefit analysis apparently resulted not viable in terms of monetary return. However, it must be stressed that this estimate only considered the benefits valued in a previous approach 13 which comprehended adverse health effects in the elderly and in children, and these age groups were evaluated only for partial morbidity and mortality outcomes.
Besides the other end points not included (morbidity indicators and other diseases), the age group of adults was also not considered and it corresponds to a considerable impact magnitude. Moreover, in order to consider total benefits of PM10 reduction, some other values as: expenses with medicines; work losses days; loss of productivity; prejudice to the fauna and flora; and materials deterioration among others could still be considered.
For each of the aspects mentioned before, a specific valuation study should be conducted in order to acquire the broad range of values incident in the environmental air quality deterioration. Certainly, values obtained from these potential studies would show that the benefits of air pollution reduction far outweigh the costs to implement it. The considerable potential for greenhouse gas emission reductions adds further to the health, environmental, and social benefits of sulfur and particulate reduction obtained by cleaner technologies.
The offer of an efficient and qualified transportation service accessible to the unprotected levels of the population is a matter of social justice and equity.
The fares’ composition system input the costs of the transportation system improvement to the population harming the social justice once the government saves resources in terms of avoided health expenses due to this investment.
The estimate of averted environmental and health costs through environmental valuation may constitute in a management tool in order to subsidy the government in the evaluation of social-economic risk of no investments in good quality public transportation.
The environmental awareness is increasing as a consequence of the concern with health and environment. However, the air quality in urban centers is decreasing and preventive and mitigating measures are essential in order to provide well being to the society. As it could be seen, the amount of investments revealed to be small compared to the social and environment resulting benefits.
Despite the fact that the population has been burdened with the diminishing of its purchase power with the fare increment, other costs and benefits must be considered for a wide evaluation of the cost-benefit relation of the bus fleet renewal in São Paulo.
The current use of impact assessment methods reviewed showing that although practices are evolving there is a little routine assessment of distributional inequalities 10.
Aspects of environmental and social justice implicate for conflict within decision making processes and must be addressed so that to guarantee the effectiveness of investments’ return, aiming the society well being. Furthermore, Health Impact Assessment (HIA) considers multiple effects on health of policies, programs, plans and projects and thus quantitative estimation has desirable properties for the purpose of HIA [17]. In this sense, a cost-benefit evaluation which considers the value of health outcomes is an adequate tool for quantification social aspects leading to environmental and social equity.
5. Conclusions
The environmental improvement of the air quality is associated to the infrastructure investments in the transportation system, which in this study is shown through the public bus fleet renewal in the municipality of São Paulo, a process initiated in 2002.
The increase in bus fares justified by the sheet calculation which considers the fixed and varied costs of the transportation system coincide with the improvements in terms of pollutants concentration and mortality indexes analyzed in this study taking the year 2002 as a reference according to the results. It was observed a lag period of 2 years for the mortality indicator to reflect the improvement in the parameters of atmospheric pollutants.
The verified 50% reduction on PM10 concentration is associated to economic investments of R$2 billion in new buses implemented with cleaner technologies for the city’s fleet. Other factors are also associated to the referred reduction in pollutants concentrations such as PROCONVE—the government program which established emission limits in the new vehicles, including cars, buses and trucks.
Considering the investment performed and the impact benefits estimated in avoided health expenses, the costbenefit evaluation of this measure is positive and justifies the continuity of apportion in this area, contributing for a sustainable development.
REFERENCES
- SEMPLA—Secretaria Municipal de Planejamento, “Mapas e Dados,” 2007. http://sempla.prefeitura.sp.gov.br/mapasedados.php
- D. W. Dockery, et al., “Air Pollution and Daily Mortality: Associations with Particulates and Acid Aerosols,” Environmental Research, Vol. 59, No. 2, 1992, pp. 362-373. doi:10.1016/S0013-9351(05)80042-8
- C. A. Pope 3rd, et al., “Lung Cancer, Cardiopulmonary Mortality, and Long-Term Exposure to Fine Particulate Air Pollution,” Journal of the American Medical Association, Vol. 287, No. 9, 2002, pp. 1132-1141. doi:10.1001/jama.287.9.1132
- P H Saldiva, et al., “Air Pollution and Mortality in Elderly People: A Time-Series Study in Sao Paulo, Brazil,” Archives of Environmental Health, Vol. 50, No. 2, 1995, pp. 159-163. doi:10.1080/00039896.1995.9940893
- J. Schwartz, et al., “Is Daily Mortality Associated Specifically with Fine Particles?” Journal of the Air & Waste Management Association, Vol. 46, No. 10, 1996, pp. 927- 939. doi:10.1080/10473289.1996.10467528
- P. A. Andre, et al., “Environmental Epidemiology Applied to Urban Atmospheric Pollution: A Contribution from the Experimental Air Pollution Laboratory (LPAE),” Cadernos de Saúde Pública, Vol. 16, No. 3, 2000, pp. 619-628. doi:10.1590/S0102-311X2000000300011
- G. M. Conceicao, et al., “Air pollution and Child Mortality: A Time-Series Study in Sao Paulo, Brazil,” Environmental Health Perspectives, Vol. 109, No. 3, 2001, pp. 347-350. doi:10.1289/ehp.01109s3347
- W. Gordon, “Environmental Justice, Impact Assessment and the Politics of Knowledge: The Implications of Assessing the Social Distribution of Environmental Outcomes,” Environmental Impact Assessment Review, Vol. 30, No. 5, 2010, pp. 312-318. doi:10.1016/j.eiar.2010.04.005
- SPTRANS—São Paulo Transporte SA, “Dados,” 2009. http://www.sptrans.com.br/new05/conteudos/tarifas/tar_evolu.htm. Acessed on 22/09/2009
- CETESB—Companhia de Tecnologia de Saneamento Ambiental, “Qualidade do Ar,” 2007. http://www.cetesb.sp.gov.br/Ar/ar_saude.asp
- PROAIM—Programa de Aprimoramento das Informa- ções de Mortalidade no Muncípio de São Paulo, “Dados de Mortalidade,” 2007. http://ww2.prefeitura.sp.gov.br/cgi/deftohtm.exe?secretarias saude/TABNET/SIM/obito.def
- GEIPOT, “Planilha Tarifaria Para o Estado de São Paulo,” 2007. http://www.geipot.gov.br/Estudos_Realizados/cartilha01/Tarifa/Tarifa.htm
- DIEESE—Departamento Intersindical de Estatística e Estudos Socioeconômicos, 2008. http://www.dieese.org.br/
- J. Schwartz, “Harvesting and Long Term Exposure Effects in the Relation between Air Pollution and Mortality,” American Journal of Epidemiology, Vol. 151, No. 5, 2000, pp. 440-448.
- METRO, “Região Metropolitana de São Paulo,” Síntese das Informações, São Paulo, 2003.
- S. G. Miraglia, et al., “An Evaluation of Air Pollution Health Impacts and Costs in Sao Paulo, Brazil,” Environmental Management, Vol. 35, No. 5, 2005, pp. 667- 676. doi:10.1007/s00267-004-0042-9
- R. Bhatia and E. Seto, “Quantitative Estimation in Health Impact Assessment: Opportunities and Challenges,” Environmental Impact Assessment Review, Vol. 31, No. 3, 2011, pp. 301-309. doi:10.1016/j.eiar.2010.08.003